Reposted from Dr. Roy Spencer’s blog
December 6th, 2019 by Roy W. Spencer, Ph. D.

People’s Climate March in Denver, CO on April 29, 2017 (CNN).
It’s that time of year again, when we are subjected to exaggerated climate claims such as in this Forbes article, 2019 Wraps Up The Hottest Decade In Recorded Human History. Given that the global average surface temperature is about 60 deg. F, and most of the climate protesters we see in the news are wearing more clothing than the average Key West bar patron, I would think that journalists striving for accuracy would use a more accurate term than “hottest”.
So, I am announcing that in our 41-year record of global satellite measurements of the lower atmosphere, 2019 will come in as 3rd least-chilly.

For the decade 2010-2019, the satellite temperatures averaged only 0.15 C higher than in the previous decade (1990-1999). That’s less than a third of a degree F, which no one would even notice over 10 years.
If you are wondering how your neck of the woods has fared this year, the latest year-to-date plot of 2019 temperature departures from the 30-year average (1981-2010) shows the usual pattern of above- and below-normal, with little visual indication that the global average for 2019 is now running 0.36 deg. C above normal.

Latest 2019 year-to-date average surface temperature departures from the 1981-2010 average from the NCEP CFSv2 global data assimilation system (graphic courtesy of Weatherbell.com).
The use of the term “hottest” to describe recent warming belies the fact that the rate of warming we have experienced in recent decades is minuscule compared to the several tens of degrees of temperature change most people experience throughout the year — and sometimes from one week to the next.
So, how are we supposed to react when the arithmetically-averaged temperature, across all extremes, goes up by only a small fraction of a degree in ten years? With horror? Outrage? Is the term “hottest” in a headline supposed to move us? Seriously?
Should we all get someone to fly across the Atlantic so they can transport us to Europe on a luxury yacht to help Save the Earth™ on our next European vacation?
The click-bait journalism typified by terms like “hottest”, “climate emergency”, and now “climate catastrophe” helps explain why the public is largely indifferent to the global warming issue, at least if we are asked to spend more than a few dollars to fix it.
This is why the alarmist narrative has moved on from temperature, and now focuses on wildfires, droughts, floods, hurricanes, snowstorms, and sea level rise. Yet, none of these have worsened in the last 100 years, with the exception of global sea level rise which has been occurring at a rate of about 1 inch per decade for as long as it has been monitored (since the 1850s, well before humans could be blamed).
And, just in case some new visitors to my blog are reading this, let me clarify that I am not a denier of human-caused climate change. I believe at least some of the warming we have experienced in the last 50 years has been due to increasing carbon dioxide. I just consider the fraction of warming attributable to humans to be uncertain, and probably largely benign.
This is fully consistent with the science, since the global energy imbalance necessary to explain recent warming (about 1 part in 250 of the natural energy flows in and out of the climate system) is much smaller than our knowledge of those flows, either from either theoretical first principles or from observations.
In other words, recent warming might well be mostly natural.
We just don’t know.
IPCC AR4 Chapter Ten Page 749
Temperature Extremes
It is very likely that heat waves will be more intense, more frequent and longer lasting in a future warmer climate. Cold episodes are projected to decrease significantly in a future warmer climate.
Almost everywhere, daily minimum temperatures are projected to increase faster than daily maximum temperatures, leading to a decrease in diurnal temperature range.
Decreases in frost days are projected to occur almost everywhere in the middle and high latitudes, with a comparable increase in growing season length.
So far they are NOT right about the heat waves
In the last two decades be have had 2 records for hottest state temperatures and 4 records for coldest state temperatures.
By far the hottest temperatures were in the 1930s when 24 state records for hottest day were set that still exist. https://en.wikipedia.org/wiki/U.S._state_and_territory_temperature_extremes
That’s right. Half of existing state highest temperature records were set prior to 1941, and that was long before most of our widespread urban heat island effects.
Reduced frost days also means less energy used in heating. I would think this would be desirable.
“The Third Least-Chilly in the Satellite Temperature Record” is a very apt and accurate choice of words. It goes with “Decreasing alkalinisation of Oceans”.
There is absolutely no science to temperature records that change right before you eyes. This is all part of the Socialist Word Salad. Their objective is to subliminally stimulate the libido with meaningless nonsense that seems frightening despite having no foundation in reality.
I just wish, here in the Mid Atlantic, they would send some of that “third least chilly” climate because we just lived through a miserably cold November with little hope of a Global Warming Christmas.
Is it odd that the area with the best long term temperature records and the USCRN is also the place with the strongest cooling trend? Is it odd that the area with the most difficult to measure temperatures has the strongest warming trend?
I noticed that also. Would be interesting to see how satellite corresponds to USCRN vs rest of world.
This defines the global warming/ global cooling issue, basing the feathers average temperature on land based stations . US weather stations are not uniform in there spacing. Thus you have states like Rhode Island (1,500 square miles) having 2 weather station and midwest and mountain states having 20-30 stations. If station siting were geographically uniform, states like Wyoming (97,000 square miles), Montana (147,000), North and South Dakota (77,000 and 70,000) etc.would have 200 to 300 stations. This skewers the temperatures and favors warmer stations of the costal, southern states. and more importantly it favors the urban heat island effect. In recent years (about 1970 on) the NOAA has actually reduced the number of stations in the plains and mountain states which exacerbates the issues, ie if you remove traditionally colder reporting stations of the mountain and northern states the average/mean temperatures are going to rise.
Which is why this Global Warming trend is entirely “man-made”, by the way man has recorded the temperatures.
scott
There is another issue. Flat states can probably get by with fewer weather stations than states with rugged topography. The lapse rate will cause temperature changes with elevation, and rugged topography will cause various microclimates to exist. Because of the microclimates and associated variable winds, even the anomalies will vary more rapidly with distance. Therefore, one needs more weather stations per unit area to properly capture the variability in areas with highly variable elevations.
scott allen December 7, 2019 at 9:20 am
This defines the global warming/ global cooling issue, basing the feathers average temperature on land based stations.
/ probly. basing the feathers –> basic features
Ricardo
Where do you believe the best long term temperatures records are maintained and back to which date?
Tonyb
US Climate Research Network was specifically designed and set up to avoid measurement errors, changes in technology, changes in procedures and UHI. It covers the entire country. It shows the US is not warming since it was initiated. In fact, 2018 and 2019 are both colder than the first three years (2005, 2006, 2007) that the system was up and reporting.
https://www.ncdc.noaa.gov/temp-and-precip/national-temperature-index/time-series?datasets%5B%5D=uscrn¶meter=anom-tavg&time_scale=p12&begyear=2004&endyear=2019&month=11
USHCN has a lot more long term data and it shows that the 1930’s were way hotter than the present in the US. Some of these stations are compromised by UHI and other changes so the results are subject to cherry picking and data manipulation. Check out Tony Heller at realclimatescience.com if you want good analysis of other temperature histories.
I am like every other skeptic who has looked at the temperature histories and I think the NOAA/NASA version (the cleaned, adjusted, homogenized, V4 of their global temperature report) is hopelessly confirmation biased.
https://www.ncdc.noaa.gov/temp-and-precip/national-temperature-index/time-series?datasets%5B%5D=uscrn¶meter=anom-tavg&time_scale=p12&begyear=2004&endyear=2019&month=11
Dr Roy wrote, “ I just consider the fraction of warming attributable to humans to be uncertain, and probably largely benign.
Benign???
How about “probably largely beneficial”.
That’s the real truth the idiot climate alarmists will never admit.
Both the warming and the fossil fuel use is hugely beneficial… both to mankind and the environment. By environment, I mean, for one example, we’re no longer slaughtering whales to obtain oil for our lighting. The forests of the North America have largely recovered from the vast clear cutting for fuel of the 18th-19th Centuries. Human waste-laden sewer water is treated and filtered before returning to rivers and oceans with the use of fossil fuel energy. Our crops are now more productive than ever with a milder climate of higher lows, less intense heat waves, and longer frost free growing seasons.
No, beneficial is definitely the correct descriptor.
We were already suffering from a foot on horse manure in most of our big city streets when cars were invented. Just disposing of 50 million horse carcasses a year would be a very big task.
+1,000 Joel
You have a point. The satellite temperature record began when the winters were abnormally cold enough that “climate scientists” warned of an emerging ice age. 1979 was the winter of discontent in the U.K. and in the U.S. too. We’ve emerged from those dark years incredibly well. Compare global GDP today with global GDP in 1979.
YES! If we weren’t putting CO2 back into the atmosphere accidentally, we would eventually do it intentionally, because it is so beneficial. Sea level rise is the only potential downside to a warming world, but that is far less of a threat than advertised because coastlines are dynamic!
Ice core temperature studies clearly show we’re headed towards the next glacial period, and we live on a planet that started slowly cooling 8,000 years ago. Our CO2 emissions probably won’t stop the decline, but they may slow it down a bit. Threat would be totally awesome!
Exactly, Joel! And his parting words are a gem too: “In other words, recent warming might well be mostly natural. We just don’t know.” Of course we know! Carbon dioxide is NOT warming the planet and AGW is a fraud. Is Dr. Spencer pandering, controlled opposition or just dumb? In any case, doubt is deadly, and the fraudsters know it and he’s playing right into their hands. There’s no doubt or ‘middle ground’ with a fraud, and with the full weight of the establishment behind it only assuredness can trump it!
“Is Dr. Spencer pandering, controlled opposition or just dumb?”
No, Dr. Spencer is just being very careful. And he has it right: CO2 may or may not be warming the planet and recent warming might well be mostly natural.
That’s the position every person on Earth should be taking, because this is the extent of our knowledge of the situation.
Tom Abbott: well said.
+1000 Joel. Before the history revision (Lamb), the warm periods were “optimums” & nobody questioned it. After revision, they’re “anomalies”.
The increased CO2 is coming from more people becoming able to buy electricity and gasoline powered vehicles. That is a good thing.
If solar energy is desirable then this press release “Carbon Nanotubes Could Increase Solar Efficiency to 80 Percent – Not by enhancing solar panels—by capturing the heat around them” should help them. https://www.popularmechanics.com/science/green-tech/a28506867/carbon-nanotubes-solar-efficiency/
This press release points a way to 95% solar conversion efficiency that some ocean organisms have that human should be able to mimic. https://www.sciencedaily.com/releases/2019/05/190509112258.htm
We are still in a long-term ice age that started 2.6 million years ago and everybody I know has bunches of clothes to keep warm.
Cold weather kills 20 times as many people as hot weather, so a warmer climate may be better for us.
https://www.usatoday.com/story/weather/2015/05/20/cold-weather-deaths/27657269/
Most of the heating seems to be in the upper latitudes where it is usually much cooler.
C02 doesn’t affect the temps.
And Jeffrey Epstein didn’t kill himself.
The real question is how does current temperature compare to history. Fact is that we DO NOT have good date before the satellite era.
* Our ONLY world wide coverage is satellites and they only go back to 1979. Therefore there is not enough history to make long term judgements about world climate. We cannot say it is warmer or cooler than the last 100 or 200 years. (climate has many cycles of differing length, including a major one of 1000 years)
* Radiosones go back further, but not back to the last warm spell, the 1930s, so we cannot make useful comparisons to the last really warm period, let alone the early 1900s and late 1800s. Again, not enough history to make long term judgements about world climate.
* NOAA data (and its many derivatives) are crap because they have to constantly revise them. Which is the correct climate history? The one from a few years ago that showed 1930s to be warmer than 1998? Or the one that shows 1998 to be warmer? Can we rely on the latest one? NO – because tomorrow may bring yet another revision.
* Ocean data is virtually non-existent. Even today we have a only a few thousand buoys measuring millions of square miles of ocean. We have almost ZERO data below the surface before the buoys. Surface data before satellites was mostly from ships along trade routes, measurement methods were poorly controlled, inconsistent, and changed over time.
* Surface data suffers from station moves, time of observation changes, constant revisions, and changes in surrounding land use. Most (90%) are rated below top quality with errors of 1 degree or worse. The ONLY good surface data is USCRN which shows ZERO warming over its short span. World coverage is quite poor outside of the developed countries and arctic and even worse before about 1950. Many stations have been dropped from the official reports and estimates substituted.
This means that we simply do not have the data to judge if today’s climate is unusual. If it is NOT unusual, then there is nothing to be concerned about and nothing to blame on CO2 and no amount of CO2 reduction will change it.
Then one must add things like “hiding the decline”(Jones- 0942777075 .txt) , “mike’s nature trick” (Jones- 0942777075 .txt) and other arbitrary “adjustments” such as this: “I’ve chosen 0.15 here deliberately. This still leaves an ocean blip, and i think one needs to have some form of ocean blip to explain the land blip” (Wigley – 1254108338.txt) . And don’t forget that Mann wrote “it would be nice to try to “contain” the putative “MWP”(Mann-1054736277.txt)
This pretty much sums up the whole field of climate research:
“there have been a number of dishonest presentations of model results by individual authors and by IPCC. (Wigley- 1255553034.txt) and As we all know, this isn’t about truth at all, its about plausibly deniable accusations. (Mann- 1256735067.txt)
Jim K … at 6:33 pm
NOAA data (and its many derivatives) are crap because they have to constantly revise them.
Here are the month by month number of changes NASA’s GISTEMP made to their Land Ocean Temperature Index – LOTIso far this year:
Jan Feb Mar Apr May Jun Jul Aug Sep Oct Nov Dec
843 370 481 633 1359 566 281 400 674 284
If the boyz and girlz at NASA/GIZZ ain’t a lyin’, they ain’t a tryin’.
79 ? Its probably a lot more recent than that. Even Wonkypedia, hardly following a sceptical agenda on CC, observes the lack of operating standards amongst the satellites that observe temperatures. I’d have to think that the first ones up there were probably less than capable if one relates the power of these things to the PC’s of the day ? Then of course there’d be the question of how long the satellites give reliable readings ? Remember the one that was showing the Great Lakes hot enough to cook an Egg a few years back, and lets not forget the Satellite (not weather) a couple of years ago that was recording negative radiation that somehow escaped the notice of NASA, and was only revealed by a school kid here in the UK asking questions.
I doubt there’s 25 years worth of data thats in anyway dependable. A pretty short snapshot upon which to base any conclusions.
“Our ONLY world wide coverage is satellites and they only go back to 1979. Therefore there is not enough history to make long term judgements about world climate.”
Are you saying that people in the 20th century cannot read a thermometer properly?
Well according to NASA/NOAA they can’t/couldn’t, that’s why they have to constantly adjust the past temperature records. Right now they cool the past by almost .8 of a degree, as they adjust for TOBs, which may or may not apply to every station, but they still apply it to all.
As a biologist I look at what will grow or not grow in our current climate, not what some thermometer reads. If anyone were to look into that and read real research on growing start dates and freeze dates you will find that farmers are planting seeds that grown faster and mature earlier (those parameters reduce yields but increase the likelihood the crops will mature in cooler weather). Check with any seed dealer or seed company. Plants will tell the truth as to a warming or cooling planet.
Certainly land use affects local climates. I wonder how much of global warming is due to changes in land use. Anyway, CO2 isn’t the only possible way humans affect the climate.
I certainly agree we need to be better stewards of our world. But CO2 is not any problem. Blighting the landscapes horzon to horizon with endless bird-killing wind turbines on the other hand…
The windmills cause local warming. A lot of windmills could cause more warming than the CO2 caused warming they’re supposed to prevent. link
C02 doesn’t affect the temps.
And Jeffrey Epstein didn’t kill himself.
Joel
I share your dislike with what wind turbines are doing to the landscape and ecosystems.
” more clothing than the average Key West bar patron”
Not necessarily…right after you put this together…we bottomed out at 51 degrees the other morning…
Kids were waiting on school buses in parkas with hoods, toboggans, gloves, two pr socks…everything but snow shoes
Pink tourists were running around in shorts and sandals…..the contrast is hysterical
But you’re right….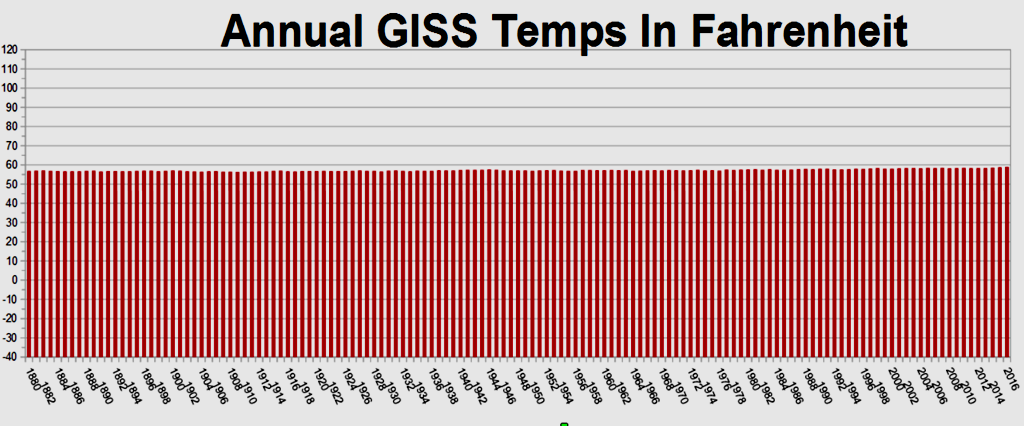
No one would have noticed >
If you squint. If you zoom in. If you focus on the perturbations. It’s a veritable roller coaster ride. Nay, it’s helter skelter. The end is nigh. Happy Festivus!
Parkas and hoods at 51? Chuckle, that’s downright balmy here on the steppes. Talk about “snowflakes”! > ; }
Great article Dr. Spencer !! Thank you.
The medieval warm period is definitely part of the recorded human record.
The Roman warm period is also part of the recorded human record.
The Minoan warm period, depending on how you define “recorded” is also probably part of the recorded human record.
All three of these events were warmer than it has been during the last decade, as much as 2 to 3 degrees C warmer.
Nope,
at least not in the European Alps.
There we are approaching the holocend maximum and we are very likely already above the Roman warm period.
Really?
“The key message is that the alpine glacier extent was often smaller than in 2005. The timberline was at least 300 meters higher, which indicates a minimum of 1.8° C higher temperatures than today. An example of this is Hannibal, who managed to cross the Alps with elephants during the Roman times.”
https://notrickszone.com/#sthash.3s6xCwzT.dpbs
Actually, Caesar, who fastidiously recorded the natural history & geography of the Europe he encountered north of Italy, crossed the Alps a couple times with his legions, going from Cis-Alpine Gaul to Trans-Alpine Gaul and back again and never mentioned anything about glaciers or the cold. Hannibal, OTOH, lost half his army and 36 of his 37 elephants to the harsh weather, making the same trip 160 yrs earlier.
I stand corrected, thank you.
So Ceaser is the one who experienced the Roman Warmjng in the Alps, seems appropriate!
You also have Ötzi, whose corpse was found in 1991. According to Wiki, he lived between 3400 and 3100 BC. Based on the way he was dressed, there most likely weren’t any glaciers in his way.
There are tree stumps from BACK THEN found in the Alps that are above what is NOW the snow line. They are a record of what the “climate” was like back then, much more so than guessing what the temperature was.
There is a difference between weather cycles, which include precipitation (rain and snow), dry periods, and a seasonal mix, and climate cycles.
Greenland was certainly much warmer a thousand years ago. If you don’t believe me I invite you to try cultivating barley and oats there as the Vikings did.
“… transport us to Europe on a luxury yacht to help Save the Earth™ …”
————————-
Made me smile, see what looks to be sponsorship names pasted all over the petrochemical created coat Greta’s wearing to prevent exposure to cold on arrival at Lisbon:
Shouldn’t she at least wear a Sea Otter coat?
Here in Utah, our daily highs and lows can be more than 30 degrees. Right now, this week, highs and lows are only around 10 degrees different, but in the summer, the swings are much wider.
As of Dec 6, Colorado’s state snow-water equivalent is 119%.
https://www.wcc.nrcs.usda.gov/ftpref/states/co/snow/state/daily/co_update_snow.pdf
A few weeks ago there was a “drought” in the southwest corner of the state. Now those drainages are:
Gunnison – 106%
San Miguel, Dolores, Animas and San Juan – 115%
Upper Rio Grande – 117%
Great article Dr. Spencer, thank you!
Curious when looking at the map as most of the heat in 2019 appears to be in the polar regions with an abundance of warmer and colder regions in between. I thought the satellites had difficulty in the polar regions measuring temps.
November was 5 degrees below normal in NorthEastern Wisconsin and averaged below normal for every month except September and July.
Jim
Keep in mind that the map shows the anomalies, i.e. the deviation from long-term averages, which also tend to be primarily increases in the low temperatures. For a human-interest comparison of the polar ‘heat,’ read the following:
https://news.yahoo.com/deserted-5-old-takes-toddler-013801561.html
“… 5-year-old child… carried a toddler half a mile to a neighbor’s home in the bitter cold wearing only socks and light clothing…in temperatures that dipped to 31 degrees below zero”
a half mile in 31 below wearing socks?
Mike
They both needed medical attention after the ordeal! When I spent some time in Point Barrow, our Eskimo Weasel driver related to me how he once broke through the ice crossing a river in a bulldozer. He was wearing army-issued Mickey Mouse boots while driving the ‘dozer. When he realized he had to hike several miles to get help, he put on his native muluks, which are better than just socks, but not nearly as warm as the Arctic boots. So, as long as the kid kept moving, he was probably in less danger than had he been sitting wearing shoes.
thanks for the story. I’ll remember that if I’m ever stuck in that kind of weather.
And this winter the climate activists, celebrities, and climate crusading politicians will fly off to vacation in places that are 10 to 30C warmer than their home locales.
They are not alone,
I’m currently in Tenerife (as a climate refugee ) it’s 12C warmer than home !
Take care, “saveenergy December 7, 2019 at 1:31 am
They are not alone,
I’m currently in Tenerife (as a climate refugee ) it’s 12C warmer than home !” –
https://www.google.com/search?client=ms-android-huawei&sxsrf=ACYBGNTN2aVXKdckPbfoo2vTJbIAKQupAA:1576678387144&q=tenerife+death+2019&sa=X&ved=2ahUKEwj7_cLZsL_mAhWLtIsKHT1bAjIQ1QIwFHoECA0QBA&biw=360&bih=574
I’m looking at the following paragraph…
For the decade 2010-2019, the satellite temperatures averaged only 0.15 C higher than in the previous
decade (1990-1999). That’s less than a third of a degree F, which no one would even notice over 10 years.
I would have thought the previous decade would have been 2000-2009. Can someone clarify? If the numbers are handy, what are the decade to decade temperature increases for the other decades in the satellite record?
Ton Steve, “they” are acyually right about heat waves, its just bthat the media and green nuts lie about it. The IPCC says there has not been an increase in heat waves and other extreme weather during the period 1918-2018. And what Steve has quoted is where bthey say the increase in temps come from…less extreme cold.
However, we know thanks to Dr Jennifer Marohasy that the BOM at least has been lying about our cold extremes by homogenizing them out of existence and I am certain every other participating weather org is doing the same. http://joannenova.com.au/2017/08/scandal-australian-bureau-of-meteorology-caught-erasing-cold-temperatures/
I have been watching the Antarctic SST anomalies for a decade and have never seen a chart showing the above Antarctic above average warmth….ever….it is a lie….does that surprise anyone here? No, no it doesn’t. Here is todays typical offering https://www.eldersweather.com.au/climimage.jsp?i=sstag
The “hottest” places on that global map, the places with the deepest reds, are places where no people and few animals live. No warming in the US, very little in South America, most of Africa south of the Sahara is cooler than normal, no warming in India. Looks like very little warming where most of the people in the world live.
“Looks like very little warming where most of the people in the world live.”
Really? What about China? Europe? SE Asia? All pretty warm.
Central Europe and China look to be mostly in the 1 degree range. Far western Europe looks neutral along with far western Africa. Scandinavia looks cooler than normal. Central China has a lot of blue if you click the map link and get a clearer picture. The areas that contribute most to the global average, though, seem to be the polar regions and that is likely due to warmer winter temperatures. Sure, warming from -35 to -30 is a lot and will significantly impact the annual average but in the overall scheme of things doesn’t do much to biology. It certainly doesn’t kill pikas or anything.
Continental US really hasn’t’ seen any warming since 2005. I know that isn’t the planet but it’s a pretty good sized sample of 25% of it. What I would like to see is more networks like CRN deployed in various places like Australia. No adjustments required.
https://www.ncdc.noaa.gov/temp-and-precip/national-temperature-index/time-series?datasets%5B%5D=uscrn¶meter=anom-tavg&time_scale=p12&begyear=2005&endyear=2019&month=10
crosspatch
And, those anomalies are given as absolute changes in the average temperatures, not the percentage change. The reason that is important is because life that is adapted to extreme temperatures will only have difficulties when the temperature excursions are in the direction of being more stressful. That is, a 5 deg C decrease for animals living right on the edge of survivability may be life-threatening. However, a 5 deg C decrease in the tropics or deserts, were it to occur, may be beneficial when organisms are living at the high end of their edge of survivability, such as the Silver Ants of the Sahara.
So, increasing temperatures in cold climates, or decreasing temperatures in hot climates may not be threatening. Probably the percentage change is a better indicator of the environmental stress than an absolute change because for any given change, such as 5 deg, the percentage change is smaller in very cold or very hot climes. Other factors come into play, but a single number rarely is sufficient to describe the impact on biological organisms.
“Really? What about China? Europe? SE Asia? All pretty warm.”
Would it be better if they were pretty cold? Why don’t we ask them?
To the calibrated eyeball, the reds and blues pretty much cancel each other! It IS Global MEAN Temperature after all! Yawn!
Nick your life must be pretty sad chasing the boogeyman 🙁
“That’s less than a third of a degree F, which no one would even notice over 10 years.”
No one would notice over 10 seconds.
Are the billionaire globalists orchestrating a panic over 0.1 F? No
The climate crisis is a cover for their real agenda.
Ah, you have to wait until NASA adjusts the numbers. then it will be warmer.
“The use of the term “hottest” to describe recent warming belies the fact that the rate of warming we have experienced in recent decades is minuscule compared to the several tens of degrees of temperature change most people experience throughout the year — and sometimes from one week to the next.”
Whaa? Only if you don’t know the difference between apples and oranges. The daily diurnal variation is a magnitude greater than the fall of the Little Ice age too. Therefore what?
Obviously Roy knows the difference, so just put this down to a feeble attempt to disinform. Sad to see him stoop to this but I guess disinformation is all you’ve got left when the only years that can compete are especially un-chilly, super el nino spike years.
”Whaa?”
It means the only reason people are frightened is because we can measure it with instruments.
If we couldn’t, you would never know.
Right. So the LIA didn’t have any effect, ’cause how could anyone have noticed.
Because of the insidious use of averages and means when dealing with temperatures from disparate places, some places would have been much colder during the LIA, some less so, some might have been warmer. That’s how it works. Averaging them all together is a lie.
A lot of people STARVED TO DEATH due to crop failure during the LIA so they noticed it.
How many people have been starved, flooded, etc. to death by this global warming? None!
No one would have any concern without the “Climate Science” fake news regarding this horrible warming happening because NOTHING NEGATIVE to human life on this planet has happened. Weather is weather. Why call it Weather, because we don’t know whether it is going to rain/snow/blow/get colder/get warmer on any given day a week or more from now with any level of certainty.
That butterfly in the Amazon flapping it’s wings has a more provable effect on weather than the change of CO2 has had. Without the Climate Change industry around to profit from the panic THEY HAVE ATTEMPTED TO CREATE, there would rightly be NO CONCERN among the general population because there have been no NEGATIVE climate changes over the last 50 years.
A typical LIA dialogue:
“We are cursed living in this day and age!”
“It was the witches what done it!”
“Yeah. Witches.”
“We know what to do with witches, don’t we?”
“Yeah.”
“Well, what DO we do with witches?”
“I dunno. It was you brought it up.”
“We burn em, that’s what”
“Right. We burn em. Burn the witches.”
A pity that world map is Mercator . Too much arctic red
How would we we know if there is “Too much arctic red”?
It has previously been discussed that there are virtually no thermometers in the two Arctics.
A solution would be to equip 1% of the polar bears with Pt100 ohm sensors and transmitters. It would at last cover the Arctic and give the some kind of return on the money the IPCC otherwise just suck up for parties and air miles. That’s about 300 to 400 polar bear driven dynamic remote sensing polar weather stations./SARC(more less)
LOL. I had not thought of that. I think there might be a problem when the bears go for a swim which they do a lot of but if we could put on a liquid sensor and adjust for bear body temp it might be fun.
Coeur
Yes, an equal-area projection would be preferred, particularly when the (Ant)Arctic regions get so much press. The impact is that it would no longer look like the cooling balances out the warming. The cooling would predominate! It seems strange that in climatology there usually seems to be an attempt to “accentuate the positive” temperatures.
So, I am announcing that in our 41-year record of global satellite measurements of the lower atmosphere, 2019 will come in as 3rd least-chilly. – article
Yah, but, fella, the temperature here is going to drop to subfreezing levels by Monday night and I have no desire to have to fight with Mr. Freezeyou over it. Could you just push a button or something and keep it warmer?
And for Pete’s sake, just what IS wrong with having warm weather? Someone please EXPLAIN this to me. In warm weather, crops get planted and grow and we harvest them. Livestock get out an munch on grazing lands, Birds are back up here in my kingdom, wildflowers are in bloom everywhere, and the trails are not clogged with snow and slippery ice spots, which means I can get out with my camera and not have to wear spikes or snowshoes on my boots, so what’s NOT to like about warm weather?
And just HOW is one-half degree of average warming supposed to physically destroy something? (Crickets.)
I don’t get it. I just don’t.
I don’t get it either — never have. Plus, most of the warming is in arctic/subarctic regions, which are presently pretty much wastelands from the cold.
We should be ecstatic we’ve enjoyed 0.85C of beneficial warming recovery since the end of Little Ice Age (1280~1850), because it has: made winters less severe, increased arable land in Northern latitudes, extended growing seasons, reduced crop frost loss, reduced winter heating expenditures, reduced exposure deaths, increased crop yields, lowered food prices, etc.
Higher CO2 levels have also been extremely beneficial: increased crop yields, made plants more drought resistant, increased global greening by the size of the continental US, reduced famine, lowered food prices, increased living standards, etc.
The only “catastrophe” has been the $trillions Leftist government hacks have wasted on the Global Warming Hoax.