Iain Aitken
In this essay I propose that there are many things about climate change that the general public, journalists, academics, environmentalists and politicians may think they ‘know’ to certainly be true that are actually, at the least, highly equivocal (or demonstrably false) and that once these misconceptions are corrected perceptions of the issue are (or, at least, should be) transformed. Note that throughout I use the World Meteorological Organization (WMO) and Intergovernmental Panel on Climate Change (IPCC) definition of ‘climate change’: ‘a statistically significant variation in either the mean state of the climate or in its variability, persisting for an extended period (typically decades or longer)’. By ‘global warming’ I mean a rise in the Global Average Surface Temperature of the Earth.
Although the exact terminology and language may vary, we are repeatedly told that the essential ‘facts’ about climate change are that:
a) Global warming is happening, at rate that is unprecedented and accelerating
b) It has been caused by our carbon dioxide emissions from burning fossil fuels
c) It has already caused an alarming and accelerating rise in sea levels
d) It has already caused an alarming and accelerating increase in the frequency and intensity of extreme weather events
e) It has already caused alarming and accelerating global species extinctions
f) We are experiencing a climate change crisis that will soon be catastrophic (potentially even causing a mass extinction event) if we don’t stop climate change
g) We can stop climate change by urgently switching to renewable energy sources, such as wind and solar, so eradicating our emissions
h) The science behind the above points is settled and beyond reasonable dispute.
My assertion is not that these ‘facts’ are ‘fake news’ (deliberately reported falsehoods) or ‘myths’ (implying that there is no truth whatsoever in them) but that they are fundamental misconceptions based on misunderstandings of what the science and evidence actually tell us. These misconceptions appear to have assumed the mantle of ‘collective beliefs’ (or ‘memes’) that through extensive repetition in the media are mistakenly taken to be indisputable truths, despite the ready availability of science and evidence to disprove (or, at the least, seriously question) them. Few people will have heard the opinions of scientists (including many of the world’s most eminent climate scientists) who doubt this ‘man-made climate change crisis’ narrative because their voices have largely been silenced (typically by branding them ‘climate change deniers’ or even ‘science deniers’). In the current climate of hostility to even considering alternative viewpoints there is apparently only one politically correct position to take, the ‘right’ position of accepting that the alarmist narrative is beyond dispute.
It’s hardly surprising that these misconceptions have arisen because for most people (whether they be the general public, politicians or, indeed, journalists) their exposure to the climate change issue is predominantly through the media. Furthermore when the media concerned is mainstream (such as the BBC), and so ‘trusted’, people reasonably believe that they are being told the ‘whole truth’ by unbiased journalists who must have understood and critically investigated the science and evidence. Sadly such understanding and critical analysis is rarely to be found, journalists typically simply taking on trust what the ‘scientific authorities’ tell them (as gleaned from Press Releases and ‘executive summary’ documents from which all the complexities and profound uncertainties, unknowns and ambiguities have largely been expunged). This often superficial understanding is then communicated to the target audience using unscientific, emotional, hyperbolic language (such as ‘climate emergency’ and ‘climate change crisis’) and quoting extreme outlier predictions that are virtually impossible to occur in order to create an impression of urgency and danger; rhetoric appealing to the emotions coupled with alarming images (like ice calving, hurricanes and wildfires or computer-generated drowning cities) are always likely to sway public opinion far more powerfully than rhetoric appealing to logic coupled with complicated science, graphs and data. In this way highly improbable risks in the far future come to be perceived as existential crises today. In fact if you want to convince the general public (and journalists and politicians) that ‘we are experiencing a man-made climate change crisis’ then, because few will understand the fundamental differences between man-made climate change and global warming, let alone the differences between man-made climate change and natural climate variability, you typically need only convince them that ‘global warming is happening’ (which nobody denies). So one temperature graph showing warming (there are thousands available on Google Images) is all it may take to apparently ‘prove’ your case. Yet evidence that global warming is happening is not evidence that man-made global warming is happening and not evidence that climate change is happening (let alone evidence that man-made climate change is happening) because the global warming may just result from natural climate variability. Natural climate variability is variability in the mean state of the climate on all temporal scales (beyond that of individual weather events) resulting from natural processes.
This confusion was epitomized in ‘Climate Change – The Facts’, Sir David Attenborough’s BBC documentary (that appeared on British TV 18th April 2019) that was a catalogue of scientific misconceptions, spanning claims of man-made climate change causing escalating heatwaves, droughts, storms, floods, ice melt at the Antarctic, sea level rise, species extinctions and widespread coral death. Sample criticisms of the programme can be found here and here and here. It included the claim (also being made by such extremist groups as Extinction Rebellion) that globally we must achieve net-zero carbon dioxide emissions by 2050 and not exceed a further half a degree Centigrade of global warming if we are to avoid a climate catastrophe and possible mass extinction event – a claim that, to put it as charitably as possible, is not at all supported by the science, as is evident to anyone with even the most basic understanding of climate science or anyone who has actually read the IPCC SR15 report that ostensibly formed the basis of this claim. Furthermore to achieve this goal would, according to the IPCC, ‘require unprecedented changes in our lifestyle, energy and transport systems’, effectively a global social and economic revolution.
The essential problem for those who are prepared to open their minds to alternative viewpoints is that to understand the flaws in the alarmist narrative’s simplistic certainties requires that you delve quite deeply into the science, statistics, politics and economics of climate change – and that is time-consuming, hard work that requires quite a high degree of scientific literacy. However if you do make the effort a very different (far less alarming) picture appears:
1) Global warming and climate change are both unequivocally happening (the latter being reflected in, for example, glacier retreat and sea level rise) but so far both at a rate that is well within the bounds of natural climate variability (and not unprecedented)
2) There are substantial uncertainties about the extent to which human activity (principally in the form of global warming from greenhouse gas emissions and global cooling from aerosol and soot emissions) has contributed to the observed post-industrial global warming and climate change, not least because of the extreme difficulty of separating man-made climate change from the ‘background noise’ of natural climate variability. Nevertheless on the balance of probabilities human activity was responsible for half or more of the global warming observed between 1950 and 2010 (a period of escalating carbon dioxide emissions)
3) Sea levels are rising at a rate of about 7-8 inches per century, a rate that has remained steady despite our escalating carbon dioxide emissions, i.e. the cause is probably predominantly natural. We could globally cease all carbon dioxide emissions overnight and sea levels would continue to rise, an inevitability to which we must adapt
4) There is no remotely compelling scientific evidence that extreme weather events have increased in frequency or intensity in post-industrial times (although the reporting of such events certainly has)
5) There is no remotely compelling scientific evidence that climate change (man-made or otherwise) has resulted in widespread species extinctions (most extinctions have been attributed to habitat loss, over-exploitation, pollution or invasive species)
6) If you remove the (entirely natural) El Niño warming of 2015-16 there has been little statistically significant global warming this century
7) Recently (essentially this century) global warming has been slowing down (while our carbon dioxide emissions have continued to escalate), this illustrating the fact that there is no direct (or linear) correlation between global surface temperatures and carbon dioxide emissions
8) It is impossible to control the Earth’s average surface temperature (on the timescales of decades to centuries) just by controlling our carbon dioxide emissions
9) It is impossible to stop climate change happening – climate change is inherently complex, unpredictable and uncontrollable
10) It is impossible to specify a threshold for global warming beyond which the climatic effects become net-harmful (the 20C goal of the Paris Climate Accord is essentially politically arbitrary)
11) Carbon dioxide is an incombustible, colourless, odourless and tasteless gas that is a very effective plant nutrient. Thanks to our carbon dioxide emissions increasing concentrations in the atmosphere there has been a greening of the Earth that is already equivalent in size to twice the area of the USA and could fundamentally change the Earth’s carbon cycle by adding such a vast carbon sink. Furthermore, as the ‘fuel’ of photosynthesis and the creation of oxygen, it is absolutely essential to the existence of complex life on Earth (which includes us). Dr. Richard Lindzen, Professor of Atmospheric Sciences at Massachusetts Institute of Technology, has stated that the idea that carbon dioxide is a dangerous, planet-destroying toxin ‘will be remembered as the greatest mass delusion in the history of the world’
12) Carbon dioxide concentrations in our atmosphere today are about 46% higher than their (280ppm) pre-industrial level (largely because of our emissions) but about four times lower than their average level and at least 10 times lower than their highest level in the history of the Earth (based on paleoclimatology estimates)
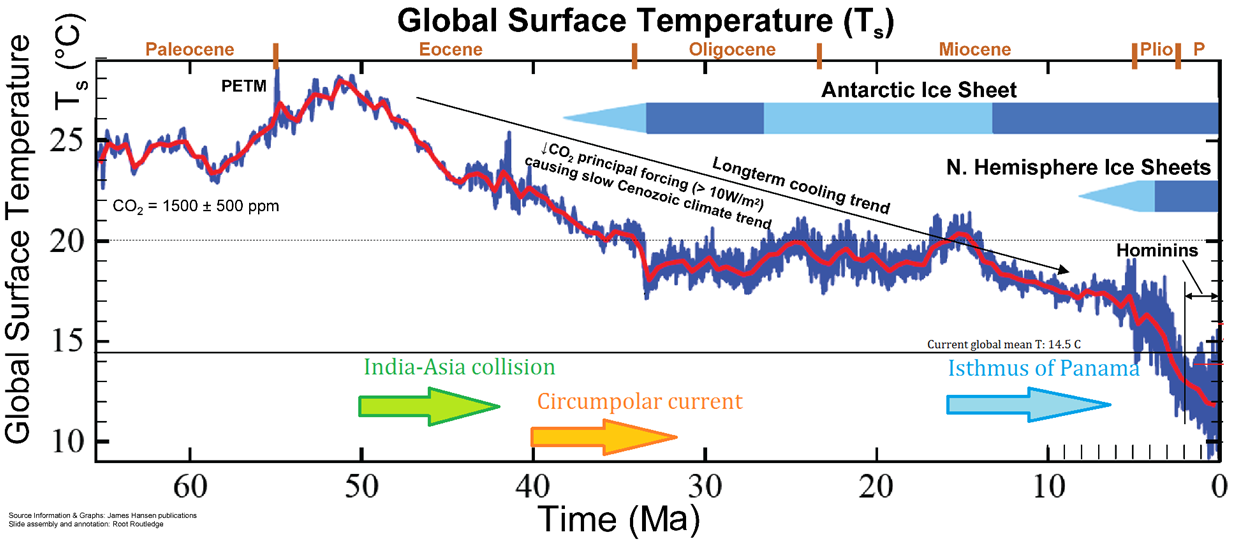
13) The global average surface temperature today is about 10C higher than its pre-industrial level but about 60C lower than its average level and at least 130C lower than its highest level in the history of the Earth (based on paleoclimatology estimates)
14) Climate change computer models are proving very unreliable guides to future climate change (in particular they are substantially overestimating warming) – yet it is the most extreme ‘predictions’ of these models that are driving global climate and energy policies
15) The future costs and impacts of decarbonization may well exceed the future costs and impacts of man-made global warming, i.e. even if future man-made global warming becomes net-harmful it may not be cost-effective to mitigate it with decarbonization
16) Based on observational estimates of climate sensitivity (simplistically how much warming you get when you double the amount of carbon dioxide in the atmosphere) on the balance of probabilities further man-made global warming this century is unlikely to exceed 1.50C and its climatic effects might actually be net-beneficial for humans and the environment for many regions of the world [Here I am assuming climate sensitivity not exceeding 20C (based on the best empirical evidence) and ‘business as usual’ emissions trajectories leading to carbon dioxide concentrations not exceeding 700ppm by 2100. Note that by ‘business as usual’ I mean a reasonable extrapolation of economic, population and energy mix trends. This is not to be conflated with recent trends which have roughly tracked the IPCC scenario RCP8.5 (its most extreme emissions scenario, which is virtually impossible to occur)]
17) Climate disruption (e.g. the failure of the Gulf Stream) before the end of this century resulting from man-made global warming is not absolutely impossible but is extremely unlikely
18) A ‘mass extinction event’ before the end of this century resulting from man-made global warming is a virtual impossibility; however a global economic recession/depression resulting from climate policies designed to limit future warming to a half degree Centigrade (and so ostensibly avert such a catastrophe) is a virtual certainty
19) Intermittent wind and solar power is not the solution to any potential future climate change problem (certainly with any foreseeable development of battery technology to ‘plug the intermittency gap’)
20) Climate change science is currently immature, highly disputable and not remotely ‘settled’. This is precisely why many very different interpretations of the science have arisen
Based on the above points the politically correct vogue for councils/counties/countries to declare a ‘climate change emergency’ is clearly profoundly scientifically misconceived (in fact it is hard to avoid the word ‘delusional’) based on any reasonable definition of the word ‘emergency’. It might well make good political sense (to attract the ‘green vote’) but it makes no real scientific or economic sense. For example, the only statistically significant change in Britain’s climate for hundreds of years has been that it has warmed slightly – yet the UK Parliament has now declared a ‘climate change emergency’. Basically it is hard to see how climate change that so far has probably been net-beneficial for humans and the environment, that has lifted us out of the misery of the Little Ice Age that preceded it, with its droughts, crop failures, famines and epidemics, and has been accompanied by the Industrial Revolution’s soaring wealth and life expectancy (according to the World Bank’s World Development Indicators 2014) could reasonably, in the round, be described as an ‘emergency’; indeed quite the opposite.
Despite all of the above, if nevertheless the radical global decarbonization route is to be followed it cannot succeed without global concerted action, in particular from major emitters like China (30% of the world’s carbon dioxide emissions, and rising – and funding about $36 billion of coal projects globally according to the IEEFA). Decarbonization unilateralism by small emitters is worse than pointless. For example even if Britain (1.1% of global emissions) somehow totally decarbonized its economy (with technologies not yet viable, like Carbon Capture and Sequestration), as is being recommended by its Committee on Climate Change, the future reduction in global warming would still be undetectably and unmeasurably small (estimated to be of the order of a hundredth of a degree Centigrade by 2100) and so basically just extremely economically, socially and environmentally damaging ‘virtue signalling’. The only basis on which this could possibly be described as even vaguely rational or responsible would be if major emitters, like China, followed Britain’s lead – and there is, to say the least, a negligible chance of that.
Of course these 20 conjectures are a great deal more complicated, qualified and uncertain than the 8 simple, absolute and certain ‘facts’ at the start of this essay. Given a choice between the complex uncertainties of my conjectures and the simple certainties of the ‘facts’ many would prefer the latter. So can we reduce all this complexity to a relatively simple ‘alternative climate change narrative’, at the very real risk of being as trite as the original set of ‘facts’? If forced to make such a gross simplification my suggestion would be:
a) Global warming is happening, albeit at a rate that is unexceptional and not accelerating
b) It has been caused by both human activity and natural activity (i.e. it has not just been caused by our carbon dioxide emissions)
c) It has caused a rise in sea levels, albeit at a rate that is unexceptional and not accelerating
d) It has not caused an increase in the frequency or intensity of extreme weather events
e) It has not caused accelerating global species extinctions
f) We are not experiencing a ‘climate change crisis’ or a ‘climate change emergency’ (indeed arguably quite the opposite) but climate disruption in the far future, although very unlikely, is not impossible
g) We cannot stop climate change but we can reduce climate change risks (albeit at an economic, social and environmental cost that may be prohibitive) by gradually transitioning to lower carbon-intensity energy sources (like natural gas), so reducing our emissions
h) The science behind the above points is immature and subject to dispute. There is almost total scientific consensus that global warming and climate change are happening and that we are contributing to them – but profound disagreements about the extent of our contribution, whether it will lead to ‘dangerous’ climate change and whether urgent global decarbonization is the correct policy response.
Now all this is highly controversial and iconoclastic because it subverts the politically correct orthodoxy on climate change, those alarming ‘facts’ that we are not supposed to question. Many would doubtless disagree with this alternative, more circumspect and far less alarming narrative, perhaps saying ‘well that’s not what the IPCC say.’ The IPCC is typically described as, ‘The internationally accepted authority on climate change’ and is viewed with reverence, not to say awe, by most academics, politicians, environmentalists and journalists, who regard it as virtually infallible and omniscient in all climate change matters. In fact many of my 20 points are directly derived from IPCC reports. Actually I suspect that the IPCC would privately agree with most of these 20 points (but would never publically admit it for fear of reducing the fear). Furthermore the IPCC, in keeping with its remit from the UN to support the UNFCCC (the United Nations Framework Convention on Climate Change, which is the main international treaty on climate change), focuses almost exclusively on man-made climate change at the expense of important aspects of natural climate change and is arguably predisposed to a ‘presumption of guilt’ of carbon dioxide emissions. Basically to ignore the opinions of the IPCC would be as foolish as to believe that they are beyond reasonable dispute.
To really understand the climate change issue we must accept that it is far more complicated and nuanced and uncertain than the simplistic way it is typically reported in the media. We must open our minds to the wide range of expert opinions about the issue, give them deep thought, apply common sense, make careful judgements, and above all be wary of any simplistic all-purpose solutions, such as urgent global decarbonization. Unfortunately few people have available to them the time, inclination and perseverance to do that. As Dr. Richard Lindzen has said, ‘Most arguments about global warming boil down to science versus authority. For much of the public authority will generally win since they do not wish to deal with the science.’ The apparent overwhelming message from the authorities (as mediated by the media) is that we are experiencing a man-made climate change crisis that can only be fixed through urgent and radical global decarbonization and it is perfectly understandable (although regrettable) that the vast majority of the general public and journalists and politicians simply choose to believe this. Why do all that hard, time-consuming work when you can just believe. The simplistic certainties of the alarmist media narrative may be based on profound scientific misconceptions (as the authorities are well aware) but the attitude of the authorities appears to be that because a ‘climate change crisis’ in the distant future is not impossible this possible end justifies the dubious means – after all, even this alarmist narrative has failed to get the nations of the world to act decisively. If the authorities communicated the climate change issue honestly, in all its complexity and uncertainty, it would give governments even more reason to avoid or delay decarbonization. So the behavior of the scientific authorities is perfectly understandable, although regrettable, because it risks radical climate change policies being implemented that may be the cause of deep global regret in the future. And of course the behavior of the media is also perfectly understandable (although regrettable) because bad news sells; it is hard to monetize a ‘no climate change crisis’ story.
When people say that they believe in the climate change crisis because they ‘believe in science’ what they may actually be saying is that because they don’t really understand the science they choose to believe in the alarmist narrative promoted by the authorities and abetted by the media. Few people choose the ‘road less travelled’ of opening their minds to the competing arguments in the climate change debate, embracing complexity, uncertainty, doubt and social opprobrium when they can simply choose to believe what they think the authorities and other ‘right thinking’ people believe. On the one hand you have an apparently scientifically-straightforward, very easy to understand, very certain, very alarming problem (‘our carbon dioxide emissions are causing a climate change crisis’) with an ostensibly very simple solution (‘decarbonize’) and on the other hand you have a scientifically-challenging, very hard to understand, complex, nuanced and uncertain problem that may or may not be alarming and which has no simple solution. To put it another way, on the one hand you have an imminent existential planetary crisis that can only be solved by the radical and urgent transformation of global society and on the other hand you have a possible distant future problem with no obvious ‘correct’ policy response today. It’s not hard to see why certain people, in particular young, idealistic and impressionable people, may be more attracted to the former idea and want to break out the banners and ‘save the planet’ through a world revolution.
Within the climate science community the divide is essentially between those (epitomized by the IPCC) who predominantly put their faith in climate models (i.e. virtual world projections of what might happen in the future) and those who predominantly put their faith in empirical scientific evidence (i.e. real world observations of what has actually happened). The former group tend to focus on the possible high risks of future climate change and urge rapid global decarbonization just in case whilst the latter group tend to focus on the probable low risks of future climate change (and high costs and impacts of decarbonization) and urge circumspection. It might be said that the latter group is looking at the issue in the manner of a businessman, assessing the balance of probabilities, costs, benefits and risks (they are essentially gambling and saying that urgent decarbonization is probably a bad bet) whilst the former group is simply saying that there is a huge potential risk and therefore something (radical global decarbonization) must be done, almost irrespective of the probabilities, costs and adverse impacts. As Obersteiner et al put it in Managing Climate Risk, the key unresolved question is whether global decarbonization ‘will fundamentally reshape our common future on a global scale to our advantage, or quickly produce losses that can throw mankind into economic, social, and environmental bankruptcy.’ Climate scientists who question the dominant man-made climate change crisis narrative are not saying that there is a clear scientific verdict of ‘Innocent’ – instead they are simply saying that our guilt has not been proved beyond reasonable doubt (or even on the balance of probabilities). Perhaps here we need the Scottish legal system’s verdict of ‘Not Proven’.
The fundamental problem with the climate change problem is that it is a ‘wicked’ problem: it is impossible to predict our climate future, determine whether it is benign or alarming and know how best to respond because there are simply too many variables, too many unknowns and too many uncertainties. However we choose to respond is a vast gamble with humanity’s future; however we choose to respond may result in deep regrets.
If that were true, then the alarmists would show charts that reach as far back as data is available.
A) Sea ice is shown starting in 1979, a sea ice maximum.
B) Global and regional temperature charts are shown starting at the low temperatures of the 1960s.
Alarmists go to great lengths to ignore or deny that rising temperature slopes during the 1880s and 1930s that match or even exceed this modern warming period.
C) Sea level increases are modified by assumptions to force the appearance of rapid rise.
D) Alarmists refuse to consider the far more abundant atmospheric water vapor, H₂O, very infrared active over a large amount of infrared wavelengths in favor of a minor trace gas that is infrared active in a few infrared wavelengths.
* i) Alarmists have refused to analyze lapse rates worldwide comparing humid areas of the globe against dry areas of the globe.
E) NOAA and other meteorological organizations actively adjust historical temperatures. Of all the world’s sciences and engineering, why does climatology willfully adjust historical data then present it as natural?
How can anyone still believe that the press still impartially reports the news?
The MSM slanders any scientists who tries to present the facts about the LACK of increasing extreme weather events…calling him or her a “climate denier”.
If there were any journalists left in the MSM, they could easily find out what the actual severe weather trends are. It would only take half an hour to Google the appropriate NOAA and IPCC reports…and make a few phone calls…but they aren’t interested in the least in reporting the truth. IT’S NOT THAT CONFUSING.
The MSM has become the full time propaganda wing of the Democratic party. They aren’t hyping weather events for ratings…they are doing it for the cause.
Every severe weather event is blamed on global warming/climate change (pay attention…you will see no exceptions). Every chance they get, the MSM reporters blame the climate change induced weather events on Trump (and all the climate deniers he’s surrounded himself with).
The truth doesn’t matter. The Democrats will push expensive programs that will continue to make energy more expensive and less reliable. If you haven’t been paying attention, these idiots are serious about forcing us all to quit using oil and coal by 2050…while blocking efforts to build next generation nuclear power plants.
It all comes down to that. How do you con people to believe renewable energy is sufficient for our needs? The renewable energy fetish has a long history. Four of the best-selling environmental books are Limits to Growth 1972, The Population Bomb 1968, Silent Spring 1962, and Road to Survival, 1948. Readers here are probably intimately familiar with the first 3 and may even have read them. But where did those ideas come? Not out 1960’s hippiedom. In 1948, world population was 2.5 billion, and peak oil had yet to be invented (it arrived in 1956). Yet William Vogt’s 1948 ‘Road to Survival‘, was very interested in energy. Even back then. Vogt argued for 2 aims in energy policy:
1. Use as much sustainable renewable energy, with no artificial substitutes. No artificial fossil fuels nor nuclear power because the capacity of such as strictly limited.
2. Fit demand to supply. By either reducing population, or lowering living standards.
This double phobia/fetish (overpopulation fears with its solution: renewable energy) explains the enigma of why we’re living in a global warming climate crisis, when the world is on the brink of another mini- Little Ice Age!
For more on this read Population Bombed.
David,
I never thought we would read such a poorly researched editorial in the Houston Chronicle. Blatantly ignorant of the facts!
This 1 graph disproves the possibility of CO2 anthropogenic induced global warming. 47 years of satellite data. I have spoken to a number of scientists who can’t think of any physical (physics) reason how this graph can coexist with CO2 anthropogenic induced global warming. One or the other must be false, unless you want to argue that there is a bubble around the Great Lakes . I don’t think you want to pursue that argument. Amazingly most people actually do make that argument unwittingly when they say that I have cherry picked one spot on earth. Because CO2 is a well mixed gas in the atmosphere as has been verified by numerous measuring stations; you cannot have global warming taking place in the rest of the world over a 47 year period and not have it take place in the Great lakes which represents 6 quadrillion gallons of fresh water (20% of world total) So these people by saying that I cherry picked the location are arguing the bubble theory. If the bubble theory is correct, then I would like to know what magical materiel the bubble is made out of. Case closed.
https://twitter.com/ATomalty/status/1122698572141453313
Martin Luther nailed 95 theses to the Wittenburg church door and Iain Aitken has nailed 28 theses to the WUTW Church door. Neither had links or references to any primary information – they were merely opinions about how things should work. However, since Martin Luther’s time, we have discovered the scientific method and the age of reason – which have given us better ways to understand the truth about the world.
1) Global warming and climate change are both unequivocally happening (the latter being reflected in, for example, glacier retreat and sea level rise) but so far both at a rate that is well within the bounds of natural climate variability (and not unprecedented)
The globe has warmed 0.9 K in the last half-century. All surface records are roughly consistent with this value, RSS is a little high UAH a little low. When in the past did we experience similar warming??? Don’t point to ice cores in Greenland, a location which today is warming at least twice as fast as the rest of the planet due to Arctic AMPLIFICATION. When the planet was much warmer before the ice ages began, it was modestly warmer near the equator and nearly tropical near the Arctic circle. Furthermore, warming in Greenland is REGIONAL warming, not GLOBAL warming. The MWP, RWP and Minoan WP observe in Greenland are not seen in ANTARCTIC ice cores or ocean sediment cores. There is evidence for an MWP in many places, but not always at the same time, like the warming in the last half-century. Unforced warming from 1920 to 1945 was less than half a much for half as long. You have a best ONE weak precedent, the MWP, for warming over the past half century and that warming didn’t occur in 50 years.
2) There are substantial uncertainties about the extent to which human activity (principally in the form of global warming from greenhouse gas emissions and global cooling from aerosol and soot emissions) has contributed to the observed post-industrial global warming and climate change, not least because of the extreme difficulty of separating man-made climate change from the ‘background noise’ of natural climate variability. Nevertheless on the balance of probabilities human activity was responsible for half or more of the global warming observed between 1950 and 2010 (a period of escalating carbon dioxide emissions).
If overall feedback is positive – which it almost certainly is because VW is the strongest feedback – then anthropogenic warming must have contributed at least half of warming in the last half-century. You don’t need AOGCMs to predict that rising GHGs must have contributed at least 0.5 K to recent warming
3) Sea levels are rising at a rate of about 7-8 inches per century, a rate that has remained steady despite our escalating carbon dioxide emissions, i.e. the cause is probably predominantly natural. We could globally cease all carbon dioxide emissions overnight and sea levels would continue to rise, an inevitability to which we must adapt.
More BS. Sea level only rises when ice on land melts in response to warming. Where else can the water come from? Sea level certainly hasn’t been rising forever.
Sea level rose about 1 m/century for 10 millennia as the last ice age ended, and then slowed below today’s rate of about 0.25 m/century about 7 millennia ago. By 2-4 millennia ago, the rate of sea level rise was undetectable by traditional methods involving coral, perhaps less than 0.05 m/century. Some investigators think sea level may have been higher than today during this period. Sea level almost certainly fell slightly during the LIA and was rising in response the end of the LIA in the late 19th century, when tide gauges began to be used. SLR in response to the end of the LIA continued for at least a century, because sea level was rising long before the rapid rise in anthropogenic forcing after GHGs began rising rapidly after 1970. Since tides are extremely noisy, it is impossible to measure statistically significant SLR with a single tide gauge over periods of a decade or two, so tide gauges aren’t useful for detecting acceleration of SLR. IF you believe satellite altimetry, there has been an increase in the rate of SLR in recent decades.
It takes a century – perhaps a millennium for ice caps to retreat in response to warming. It is an extremely slow process. The rise in response to the end of the last ice age was 20 m of SLR per degC of warming! As ice caps retreat towards the poles, there is less land that can be covered in ice, so let’s estimate the rise is only 1 m/K. Say it warmed 1 degK as we left the LIA. The 0.17 m of SLR in the 20th century would be only a tiny fraction of the change we might expect! Melting in response to the end of the LIA certainly could be continuing today, amplified by 1 degC of warming in the last half-century.
4) There is no remotely compelling scientific evidence that extreme weather events have increased in frequency or intensity in post-industrial times (although the reporting of such events certainly has)
No evidence except for the evidence showing increased hot spells, decreased cold spells, and an increase in number and intensity of short periods of intense rainfall – the kind that causes flash flooding. Climate models don’t predict that we should be experiencing significantly more hurricanes today, that is just alarmist propaganda. Global warming could be slightly increasing their rainfall.
5) There is no remotely compelling scientific evidence that climate change (man-made or otherwise) has resulted in widespread species extinctions (most extinctions have been attributed to habitat loss, over-exploitation, pollution or invasive species)
Some of the “Big Five” Extinction events—End-Ordovician (killed off 60-70% of all species), Late Devonian (70%), End-Permian (90-96% !!!), End-Triassic (70-75%), and End-Cretaceous (75%) – have been linked to climate change, in this case sudden cooling.
6) If you remove the (entirely natural) El Niño warming of 2015-16 there has been little statistically significant global warming this century.
Total BS. The temperature since the 2015-16 El Nino has AVERAGED 0.2 degC above the average for the Pause 2001-2012.
El Nino is a form of INTERNAL variability, where heat existing in our climate system is REDISTRIBUTED. During an El Nino, upwelling of cold water off the surface of Equatorial South American and subsiding of warm water in the Western Pacific both slow. As a consequence, the Eastern Equatorial Pacific is much warmer and transfers much more heat to the atmosphere than usual, warming the entire atmosphere perhaps 0.3 degC. So, instead of burying (by downwelling) the warmest water on the planet in the Western Pacific, the heat in that water escapes to the atmosphere. As soon as upwelling of cold water and downwelling of warm water is restored, the El Nino is over.
GHG-mediated warming occurs by a slowdown in radiative cooling to space and is a much slower process. El Nino warms about 0.3 degC in 9 month and returns to normal in about 9 months – a rate of about 4 K/year or 40 K/decade. Over the last half century, our planet has been warming at a rate of about 0.2 K/decade – so it is not surprising that short dramatic events like El Nino obscure and confuse the long-term trend. However, GHGs and temperature (about 1 K) have been rising at a fairly steady rate for the last half-century and so every sign of continuing for at least another half-century. When you look at the big picture (at least 2 K over a century), the 2015-6 El Nino will hardly be visible.
7) Recently (essentially this century) global warming has been slowing down (while our carbon dioxide emissions have continued to escalate), this illustrating the fact that there is no direct (or linear) correlation between global surface temperatures and carbon dioxide emissions.
Total BS. The average rise in forcing (0.4 W/m2/decade) and average warming rate (0.2 K/decade) has been relatively constant for the last half-century, except for the Pause. When one calculates the warming rate for the Pause (effectively 0 K/decade), the 95% confidence interval for that trend nearly includes +0.2 K/decade. In other word, given the amount of variability we normally see in climate for the last half-century, what happened during the Pause wasn’t extraordinarily unusual. Statistically significant? By some measures, but not others.
8) It is impossible to control the Earth’s average surface temperature (on the timescales of decades to centuries) just by controlling our carbon dioxide emissions
More BS. It depends on how much CO2 we emit, how big natural variability is and what ECS turns out to be. Let’s say ECS is 2 K/doubling, which makes TCR about 1.4 K/doubling given current ocean heat uptake. So, half of a doubling in a half-century would produce 0.7 K of warming. About twice the natural variability seen from 1920-1945. By the time CO2 has doubled, TCR will be 1.4 K (vastly exceeding any natural variability I know of and equilibrium warming will be 2 K!
Iain Aitken concludes: “The fundamental problem with the climate change problem is that it is a ‘wicked’ problem: it is impossible to predict our climate future, determine whether it is benign or alarming and know how best to respond because there are simply too many variables, too many unknowns and too many uncertainties. However we choose to respond is a vast gamble with humanity’s future; however we choose to respond may result in deep regrets.”
Absolutely. However our response should be based on the best reasoning we can muster. The nonsense from the alarmist doesn’t mean we need to put out one-sided nonsense of our own. This is a science blog – we don’t need to be politically correct in discussing evidence.
Frank May 6, 2019 at 10:21 pm
“More BS. Sea level only rises when ice on land melts in response to warming. Where else can the water come from? Sea level certainly hasn’t been rising forever.”
Not forever but sea level has been rising for the last 20,000 in the current inter glacial. Rapid and continuous for 8000 years rising over 100 meters. From 11,000 years ago sea level has continued to rise but fall also. How is it possible to identify a sea level rise of 6cm as human induced when nature managed to raise sea level by 12,000 cm?
Stephen: Here is the standard graph of sea level rise after the last ice age. The current rate of sea level rise is about 2.5 mm/yr according to satellite altimetry or 19 cm over the 20th century or 1.9 mm/yr. Let’s call it 2 mm/yr for simplicity which is 2 m/millennium. How steep is 2 m/millennium and the graph hopefully pasted below, but which otherwise can be found at wikipedia? A line from (-50 m, 24 millennia ago) to (0 m, 0 millennia ago) would have a slope of 2 m/millennium. Clearly overall SLR over the last 6 millennia has been less than 2 m/millennium. The rate of SLR dropped below 2 m/millennium about 7 millennia ago.
The line from (-20 m, 24 millennia ago) to (0, 0) would have a slope of 0.8 m/millennium, or 0.8 mm/yr or 8 cm/century, less than half of the current 2 mm/yr. The slope over the last 4 millennia is clearly less that 2 mm/yr, but how much less is difficult to determine. To my eye, the last 2 millennia look basically flat and all 4 millennia look to be 0.3 mm/yr.
In any case, SLR slowed from 10 m/millennia to 0.3 m/millennia, perhaps reached 0 m/millennia and has now rise to 2 m/millennia (20% of the rate of melting that ended the last ice age.
Cold periods like the LIA caused glaciers to advance and the polar ice caps probably did too. So sea level like feel during the LIA and rose when it ended. However, a few cool centuries isn’t long enough to be detected by coral records like the one in Wikipedia.
Those who say that we have experienced continuous melting since last ice age are grossly wrong. We reached a plateau with a slope that is either zero, or a small fraction of the 20th-century trend. And then sea level began rising at the end of the LIA and into the 20th century.
Frank
These particular threads beginning with yours on the 6th May have been the most ‘Frank’ and considerate and there is much to still digest.
My question still stands though: How is it possible to identify a sea level rise of 6/8 cm as human induced when nature managed to raise sea level by 12,000 cm?
Also I calculate different rates of sea level rise to you although these might be late night typos on your part:
“How steep is 2 m/millennium and the graph hopefully pasted below, but which otherwise can be found at wikipedia? A line from (-50 m, 24 millennia ago) to (0 m, 0 millennia ago) would have a slope of 2 m/millennium.”
24 millenia ago sea level was -130m and not -50 and to run that in a straight line to today would be nearly 6m per millennia.
The most dramatic rise in sea level (all natural was a huge -110 m to -5 m from just under 15 millennia ago and taking just 6 millenia. That is a wapping 17.5m per millennia.
looking at this graphic showing the long term cooling from 50 million years ago there is a sharp down turn around 6 million years ago. Right about the time that the Mediterranean is re flooded for the last time.
Water and Oceans are the greatest heat regulators followed by the land water and vegetation and then the massive air conditioning system in the form of atmospheric currents/winds. Ice at each of the poles are resultants and not drivers as minimum and peak ice are always after minimum and peak temperatures at lower latitudes. Of course the primary heat source is the sun and the amount of heat and distribution is determined by the earth’s elliptical orbit and the Milankovitch Cycles and then all of the above. Is temperature really driven by a trace gas?
Stephen asks: “My question still stands though: How is it possible to identify a sea level rise of 6/8 cm as human induced when nature managed to raise sea level by 12,000 cm?”
Sea level rises and falls GLOBALLY when the amount of permanent ice and snow on the land above the ocean decreases and increases. And when the bulk ocean warms and cools. To a first approximation, therefore, SLR is caused by warming. If the warming is “natural”, the resulting SLR is natural; if the warming is anthropogenic (caused by rising GHGs released by burning fossil fuels and other activities), then the SLR is anthropogenic.
When you look at the graph of SLR after the end of the last ice age, the vertical axis is the height (h) of the sea level relative to today measure in meters and horizontal axis is time (t) measured in millennia. The rate of SLR is the slope of the line tangent to the curve showing sea level vs time. On this graph, the rate of SLR rise has units of meters/millennium. Expressed in the language of calculus, sea level at any time, t, is h(t) and the slope at the point (t, h(t)) is h'(t), the rate of sea level rise.
When we talk about recent sea level rise, the units are usually mm/yr or cm of rise in the 20th century. Many people fail to connect today’s rate of sea level rise with graph of sea level rise in the Holocene. The lowest estimates for the rate of recent SLR are about 17 cm for the average for the entire 20th century (1.7 mm/yr) and 2.5-3.0 mm/yr for sea level rise over the last few decades as measured by satellite altimetry. I want one simple rate for “today’s” sea level rise to use when comparing to the distant past, and 2 mm/yr is a sensible value to use. 2 mm/yr is mathematically equivalent to 2 m/millennia, even though “today’s” rate of SLR has only persisted for a little more than the last century (and probably only began with the end of the LIA).
Looking at the Holocene record of SLR, the major feature is a rise of almost 120 m occurring mostly of a period of a little more than 10 millennia: a rate of rise of 10 m/millennium (10 mm/yr), about 5 times faster than today’s rate of SLR (2 mm/yr or 2 m/millennium). What was the slowest rate of SLR rise during the Holocene? That is the flat part of the curve during the past 6, 4, or 2 millennia. The slope does seem to be decreasing from slightly in recent millennia and may be totally flat in the last two millennia. If you look at the individual data points from different times and locations, changes in height of 1 m are easily within the typical scatter in the data. Coral typically grows up to the low tide line (depending on species), and it is impossible to determine sea level more accurately than 1 m using coral that grew in the past. So, the best we can do from the coral proxy record is detect a change of 1 m over the last millennium (1 m/millennium = 1 mm/yr) or 1 m over the past 5 millennia (0.2 m/millennia = 0.2 mm/yr). If you want to say that I’m being optimistic about this level of accuracy, I won’t argue.
However, today’s 2 mm/year of sea level rise is clear MUCH faster than the AVERAGE rate of SLR observed over the past 5 millennia, and is 5 to 10-fold faster or more than the low rate of SLR observed in the past two millennia. So, sea level rise slowed to nearly zero during the past few millennia and had increased dramatically by the time we began using tide gauges in the late 1800’s. That increase must have been due to the end of the LIA. That rate of rise initially might have been closer to 1 mm/yr, but it takes a whole millennium of SLR at an average rate of 1 mm/yr to produce 1 meter of SLR, the smallest change that can be detected by coral. We know that we experienced periods of warm and cold (LIA, MWP, a cold period, RWP, another cold period, Minoan WP), but those changes in temperature were not big enough nor did they last long enough to be detected in the coral record. “Today’s” rate of 2 mm/yr would need to persist for 500 years to have a chance of being detected in the coral proxy record. Even the alarmist scenario of 1 m of SLR in the 21st century might be missed by the coral record unless it lasted for more than a century.
The simplest way to put today’s rate of SLR in context of the Holocene record is to print the graph and add a line of slope 2 m/millennia (2 mm/year) starting at the present. To understand how slowly sea level rose in the past few millennia, add lines of slope 1 m/millennia, 0.5 m/millennia, and 0.2 m/millennia (50%, 25%, and 10% of today’s rate of SLR). The average rate of SLR during the past few millennia clearly is a small fraction of today’s rate.
Stephen writes: “The most dramatic rise in sea level (all natural was a huge -110 m to -5 m from just under 15 millennia ago and taking just 6 millenia. That is a wapping 17.5m per millennia.”
The exact rate of SLR you calculated for the most rapid rise depends on exactly when and you start and stop. I tend to round off too much: little more than 100 meters in a little less than 10 millennia (roughly a little more than 10 m/millennium). Your value looks slightly high to me, but is certainly more accurate than mine. I’m trying to focus on correctly comparing SLR in m/millennium to SLR in the units used for recent SLR. On the graph you linked, the shortest unit of time is 1 million years, 1000-times longer than the millennia used to characterize the Holocene. When you start talking about change on the scale of millions of years, the continents are moving around and the concept of sea level rise and fall loses its meaning for me.
Stephen: “Is temperature really driven by a trace gas?”
As I’ve written elsewhere on this post, temperature is controlled by the rate of heat transport into and out of the planet, and that occurs only by radiation. Anything that effects these radiative fluxes – including GHGs and albedo, including cloud albedo* – can and does drive temperature change. However, as you correctly note there are large differences in heat content between the surface of our planet, and the deep ocean, and the ice caps. These can change surface temperature in the absence of a radiative imbalance at the TOA. In the field of chaos, such changes are know as internal or unforced variability. Since fluid flow is chaotic, heat exchange between the surface and the deep ocean fluctuate chaotically, which makes it impossible to determine whether any surface temperature change has been “forced” by a change in flux across the TOA or by a chaotic change in internal heat transfer with the deep ocean. The proxy record of temperature change during the Holocene provides us with some idea of how much internal variability might contribute to recent temperature change, but the proxy record mostly describes regional climate change (Greenland ice cores, for example). This makes it difficult to compare the warming of the MWP (that peaked in different places in different centuries) to the 0.9 K of nearly global warming in the last half-century. The proxy record also reflects changes in radiative flux across the TOA (solar, volcanic, “naturally forced variability”) as well as internal variability. El Nino is a dramatic example of internal variability, producing warming followed by cooling of about 0.3 K in nine months each, a rate of about 0.4 K/year. That is about 20X bigger that the average warming rate 0.2 K/decade that the IPCC assesses is essentially all driven by radiative forcing. Was warming during the MWP and cooling during the LIA mostly caused by a change in solar output or internal variability? We don’t know.
Elsewhere I have said that warming is an unavoidable consequence of GHGs reducing radiative cooling to space and the law of conservation of energy – deliberately avoiding the subject of unforced variability and how much warming is anthropogenically forced. It is simpler to say that the heat from any radiative imbalance must be present somewhere below the TOA. However, if all of the heat from a 1 W/m2 radiative imbalance were retained in the atmosphere and a 50 m mixed layer of ocean, the surface would warm at a rate of 0.2 K/year. So the idea that this much heat could be hidden somewhere and not be responsible for warming we observe is absurd. Warming due to rising GHGs is unavoidable – but the exact amount of warming due to a rise in GHGs (ie climate sensitivity) is the major unknown problem in climate change. I prefer not to confuse the existence of anthropogenic warming with the amount of anthropogenic warming.
* Clouds certainly reflect incoming SWR and constantly change the radiative imbalance across the TOA. However, the average cloud lasts for a day. The average water molecule remains in the atmosphere for nine days between evaporation and condensation. So clouds RESPOND to temperature change much faster than they can FORCE temperature change. We account for cloud “forcing” in terms of W/m2/K, the change in average cloud reflection of SWR in response to surface temperature change.
Sorry Frank, but NO to this:”Nevertheless on the balance of probabilities human activity was responsible for half or more of the global warming observed between 1950 and 2010 (a period of escalating carbon dioxide emissions).” No “half,” no nothing. There is no reason to believe that CO2 or human activity of any kind has any effect on climate. No data stream supports this notion.
Ronald: Experiments in the laboratory and in the atmosphere show that rising GHGs will reduce the rate of radiative cooling to space. There is no doubt about this. The law of conservation of energy tell you that when less radiation leaves than arrives, the different becomes internal energy or heat. So unless incoming radiation has slowed (GHGs have negligible effect on SWR), temperature must be rising. As it rises, the planet emits more thermal IR to space and begins to correct the imbalance caused by rising GHGs. If 2XCO2 reduces radiative cooling to space by 3.6 W/m2 and the planet emits an addition 1 W/m2 for every degK it warms (1 W/m2/K), balance will be restored with 3.6 K of warming. If 2 W/m2/K, then 1.8 K of warming will restore a steady temperature. A graybody at 288 K with an emissivity of 0.61, emits 3.3 W/m2/K as it warms, producing a “no-feedbacks” warming of 1.1 K. The amount of warming is uncertain, but the need for warming is unavoidable. When the planet warms during summer in the NH, it emits 2.2 W/m2/K more LWR to space as measured by CERES.
All of this is fundamental physics and you probably want to tell me about natural variability, Pauses, the MWP, RWP, the inaccuracy of the temperature record and possibility other things. Climate behaves chaotically; temperature can appear to change for no external reason. (The reason is fluctuating heat exchange between the cold deep ocean and the warmer surface – INTERNAL variability.) In other words, the Earth is a lousy laboratory for doing experiments that would contradict what we know about radiation and GHGs, and what we know about conservation of energy. The place to reliably study these phenomena is the laboratory. Applying this information to our atmosphere is relatively simple and confirmed by experiments in our atmosphere.
To put it crudely, I wouldn’t care if the temperature fell 1 degK over the next decade. Experiments with our planet are never going to provide conclusive evidence that conservation of energy is wrong or our understanding of radiation and GHGs is wrong. There is more than 2 kilometers of 4 degC cold water at the bottom of both the Pacific and Atlantic, and it would only take a tiny fraction of that water to cool the thin layer of warm surface water by 1 degC. During a strong El Nino, upwelling of cold water slows in the Pacific, producing about 0.3 K of warming IN SIX MONTHS and 0.3 K of cooling in the next six months when upwelling restarts!!! Ocean currents including upwelling and downwelling are chaotic processes. The slow process of warming from radiative forcing only appears against this background of chaotic natural variability over a long period of time. The 0.9 K of warming over the past half-century doesn’t look like natural variability to me. Even if it were, the fundamental physics warming the planet would still be causing warming.
If you already understand something about blackbody radiation and other relevant physics, I suggest reading the Wikipedia article written by a skeptic linked below. It was designed to show how the equations of radiation transfer arise out of quantum mechanics and blackbody radiation and address some common misconceptions (saturation) on both sides of the issue. (There would be no GHE in an isothermal atmosphere and there is no GHE in Antarctica, which is isothermal vertically on the average).
https://en.wikipedia.org/wiki/Schwarzschild%27s_equation_for_radiative_transfer
‘Frank’ said (responding to someone else) “Experiments in the laboratory and in the atmosphere show that rising GHGs will reduce the rate of radiative cooling to space.”
Just a quick coment here that I do understand that this is how the standard or conventional global greenhouse hypothesis is “supposed” to work — even, say, Christopher Moncton’s idealized/revised equations work that, way more or less. However, I would note that I’m pretty sure that some of the more determined skeptics have disputed even this much at times (and I mean even some very learned skeptics, not just “alternative physics” junkies) For instance, I know I’ve read somewhere that Dr. Fred Singer has hypothesized the opposite, that more CO2 could lead to cooling? The idea, I think, is that given the kind of complex atmosphere that earth actually has, with lots of convection and turbulence effects carrying heat flow upward, there is no clear need to think that *all* the heat flow near the surface would be IR blanketed or IR impeded.
What if the overarching effect of more CO2 is to promote ‘cooling’ (since more of an IR active gas means more heat *emission* right along with the ability to *absorb* heat?
If this idea seems doubtful, think carefully about the idea that lots of people seem to maintain about upper atmosphere “ozone”, that *ozone* is supposed to be a greenhouse gas, even when regular ozone formation is supposed to apply high in the atmosphere and *not* near the surface where the greenhouse heat blanketing effect as such is supposed to occur? How is upper atmosphere ozone supposed to do anything other than emit more heat into outer space and thus act as a coolant?
David: Thanks for the serious respectful questions. I’ve been following climate for more than a decade now and was confused for literally years by the same questions, especially why there wasn’t more focus on convection and less on radiation. Eventually, I finally realized that heat only leaves and enters the planet by radiation. If more comes across the TOA than enters, then by COE warming must occur SOMEWHERE below the TOA. Now, you can hope vertical convection speeds up (run the Hadley circulation faster, for example) and cools the surface or minimizes cooling of the surface. However, vertical convection requires and unstable lapse rate. If you move heat to the upper troposphere faster than it can escape to space, the lapse rate becomes more stable and less convection occurs. The rate-limiting step in removing solar energy absorbed by the surface of the planet is radiative cooling from the upper troposphere to space.
I also was desperately confused as to why doubling CO2 didn’t double radiative cooling and double absorption: twice as many thermal IR photons traveling half as far. This is true to a first approximation. The 3.5 W/m2 radiative forcing from 2XCO2 is the net result of near cancellation of two large changes. I didn’t become comfortable with this problem until I learned about the Schwarzschild equation for radiation transfer (see Wikipedia article I linked above). It is a simple differential equation that describes the CHANGE caused by both absorption and emission as it passes an increment of distance ds through a medium. The equation is integrated from the surface to space for OLR and from space to the surface for DLR. Literally within minutes after first seeing this equation, my confusion disappeared. However, mathematical equations don’t always “speak” clearly to everyone.
An alternative to the math is to ask you to think about the radiation passing through a small parcel of atmosphere. We only need to consider the vertical component of that flux, since the horizontal component doesn’t heat or cool. The parcel absorbs a FRACTION of the radiation passing through it independent of its temperature. Since the upward component was generally emitted from where it is warmer and the downward component was generally emitted from where it is colder, the larger upward flux is attenuated more than the smaller downward flux. The GHGs in that parcel emit radiation in all directions proportional to the parcel’s temperature. So the upward flux of thermal IR is constantly decreasing with increasing altitude and the downward flux is constantly increasing with altitude, and the change to the upward flux is slightly bigger. OLR decreases from 390 W/m2 to 240 W/m2 on it way from the surface to space (and 2XCO2 will reduce to 236.5 W/m2) and DLR increase from 0 W/m2 to 333 W/m2 on the was from space to the surface (334 W/m2 with 2XCO2).
This can be a tough subject, with alarmists over-simplifying things and skeptics obscuring the key factors I’ve cited above.
David: In my first reply, I discussed what USUALLY happens in the atmosphere as OLR and DLR pass through it in the USUAL situation where the temperature decreases with altitude. In the case of ozone, you are talking about the stratosphere, where the temperature rises from 200 K to 250 K with increasing altitude and then falls above that. Fortunately, the vast majority of the change in OLR and DLR occurs in the troposphere where the temperature usually does decrease with altitude. The stratosphere makes only small changes to OLR and DLR. You can use MODTRAN to calculate how radiative fluxes change as they travel through the stratosphere.
http://climatemodels.uchicago.edu/modtran/
The stratosphere and troposphere behave very differently. The temperature in the stratosphere is controlled by radiative equilibrium: by how much SWR is absorbed by ozone and oxygen, vs how much LWR is emitted and absorbed by carbon dioxide, ozone and a little water vapor. In the stratosphere, doubling CO2 leads to more emission of LWR than absorption of LWR by the CO2 band; because the average incoming photon was emitted from where it is colder. Therefore, doubling CO2 cools the stratosphere (even though it warms the troposphere). However, most of the energy that makes the lower stratosphere warmer than the upper troposphere is due to absorption of SWR by ozone, while most of the radiative cooling is done by CO2. So loss of ozone cools the stratosphere, even though ozone is a GHG.
In the troposphere, the temperature is controlled by both radiation and convection. The lower troposphere is too opaque to thermal IR to let LWR out as fast as SWR is delivering energy to the surface. The surface would need to warm to nearly 350 K for thermal IR to carry away the 160 W/m2 of energy SWR delivers to the surface. However, when the surface it too hot compared with the upper atmosphere, the lapse rate is unstable and convection automatically develops and continues until a stable lapse rate of about 6.5 K/km has been produced. So the average temperature in convective regions of the troposphere is Ts – 6.5*h, where h is the altitude and Ts is the surface below. So when we do radiative transfer calculation in the troposphere, we assume a fixed lapse rate is present, and imagine the change produced by an “instantaneous doubling” of CO2 before the temperature can change. Without taking convection into account, we can’t determine how doubling of CO2 is going to change the local temperature.
On good place to learn this stuff is the first few years of posts at scienceofdoom.com, which was recommended by Steve McIntyre. The host is a fanatic about getting physics right, which disturbs skeptics. However, physics alone doesn’t predict how much warming will result from a doubling of CO2. In other words, AGW doesn’t imply CAGW.
I’m struggling to understand this sentence:
“This is not to be conflated with recent trends which have roughly tracked the IPCC scenario RCP8.5 (its most extreme emissions scenario, which is virtually impossible to occur)”
To me it says “Recent trends are pretty much the same as scenario RCP8.5. Scenario RCP8.5 is virtually impossible.”
So recent trends are virtually impossible, and yet happening.
Some mistake, surely, either in the writing or my reading.
That statement is confusing.
The RCP8.5 scenario is the worst-case scenario, where instead of cutting back on coal burning, the human race actually increases coal burning to the maximum extent possible.
This scenario is not going to happen as coal-fired powerplants will eventually be replaced by gas-powered and then nuclear-powered electric plants.
The current temperature trend is tracking along the bottom of the RCP scenarios, and is not tracking the RCP8.5 scenario.
What the author may mean is that every time we get a new science study predicting dire consequences for the climate and humans on Earth, they all use the worst-case RCP8.5 scenario as their basis which naturally makes things look as worrisome as possible. They don’t tell us what things would look like under less drastic circumstances, which are much closer to reality. If one’s aim is hyping scary CAGW scenarios then you use the worst-case scenario.
RCP6.0 (realistic) and RCP8.5 (pessimistic) are the same until 2060, when the scenario RCP6.0 there will be some limits on CO2 emissions vs “business-as-usual”. All four scenarios were basically the same for the first decade because it takes a long time for fossil fuel based economies to change. So, the author could have said we have been following any of the four scenario and not been far off.
If one’s aim is hyping scary CAGW scenarios then you use the worst-case scenario.
“we have to offer up some scary scenarios, make simplified dramatic statements and little mention of any doubts one might have.” – Leading greenhouse advocate, Dr Stephen Schneider
You say that decarbonization can cause economic issues or recession – that’s a wrong reason to hold off on reducing our emissions. The bulk of human jobs are useless, and inefficiencies are the biggest driver of employment we have today. For example – I work in a finance company and we have a teams of compliance and legal and HR and all other crap. Every time the government has a new regulation we hire people and vendors and what not to file some document that nobody ever looks at. Or maybe they look at it and the government hires some chump to look at it. All these activities cause a lot of labor and stimulus to the economy. In the same way, all the compliance to carbon emissions will be a net job creator. Nobody wants to live near coal mines and that industry was dying before the climate change issue came up.
In any case I like to travel to cold places and if We don’t see any more glaciers in Alaska that will be sad. Another point is that if you travel to a major city in China or India, you will never see the blue sky – these countries are really shitting on the planet in a bad way. NYC is an amazing breath of fresh air in contrast. we are still doing bad things like overfishing as seen by the and the size and numbers of tuna or beluga caviar or what have you. Looking at jungles of other shithole countries like Indonesia or Brazil also shows some bad trends to deforestation of dense jungle.
In essence my point to you all is that climate concerns are a good thing and a net economic plus – whether or not global warming is man made or not.
>>
. . . climate concerns are a good thing and a net economic plus . . . .
<<
I have to admit, this is one of the better examples of the broken window fallacy. As Thomas Sowell says again and again about government interference in the economy: “It’s a misallocation of scarce resources that have better uses.”
Jim
Maybe, but there is no economic catastrophe recession or whatever on account of this. For example when oil prices crash, or when Saudi and OPEC decides to mess with supply, energy companies are fairly resilient. We spend $500B every year securing the Middle East – patrolling the Gulf with our carrier groups etc. the subsidies to oil are enormous The government is everywhere and the broken windows are everywhere. If we pulled all subsidies it would be great. Just like the claim that our planet is resilient, the global economy is also pretty resilient. Jobs move around and yeah it sucks that coal miners lose jobs to solar technicians just like it sucks that sub Saharan Africa becomes more hellish as Minnesota becomes more pleasant. If we can get our shit done with fewer emissions then we should – energy independence is worth it.
“Decarbonization unilateralism by small emitters is worse than pointless.”
Wie will man die Atmosphäre “entkohlen” wenn man keiner “Kohle” in der Erdatmosphäre habhaft wird.