I have previously addressed the NASA study that concluded the AIRS satellite temperatures “verified global warming trends“. The AIRS is an infrared temperature sounding instrument on the NASA Aqua satellite, providing data since late 2002 (over 16 years). All results in that study, and presented here, are based upon infrared measurements alone, with no microwave temperature sounder data being used in these products.
That reported study addressed only the surface “skin” temperature measurements, but the AIRS is also used to retrieve temperature profiles throughout the troposphere and stratosphere — that’s 99.9% of the total mass of the atmosphere.
Since AIRS data are also used to retrieve a 2 meter temperature (the traditional surface air temperature measurement height), I was curious why that wasn’t used instead of the surface skin temperature. Also, AIRS allows me to compare to our UAH tropospheric deep-layer temperature products.
So, I downloaded the entire archive of monthly average AIRS temperature retrievals on a 1 deg. lat/lon grid (85 GB of data). I’ve been analyzing those data over various regions (global, tropical, land, ocean). While there are a lot of interesting results I could show, today I’m going to focus just on the United States.

AIRS temperature trend profiles averaged over the contiguous United States, Sept. 2002 through March 2019. Gray represents an average of day and night. Trends are based upon monthly departures from the average seasonal cycle during 2003-2018. The UAH LT temperature trend (and it’s approximate vertical extent) is in violet, and NOAA surface air temperature trends (Tmax, Tmin, Tavg) are indicated by triangles. The open circles are the T2m retrievals, which appear to be less trustworthy than the Tskin retrievals.
Because the Aqua satellite observes at nominal local times of 1:30 a.m. and 1:30 p.m., this allows separation of data into “day” and “night”. It is well known that recent warming of surface air temperatures (both in the U.S. and globally) has been stronger at night than during the day, but the AIRS data shows just how dramatic the day-night difference is… keeping in mind this is only the most recent 16.6 years (since September 2002):
The AIRS surface skin temperature trend at night (1:30 a.m.) is a whopping +0.57 C/decade, while the daytime (1:30 p.m.) trend is only +0.15 C/decade. This is a bigger diurnal difference than indicated by the NOAA Tmax and Tmin trends (triangles in the above plot). Admittedly, 1:30 a.m. and 1:30 pm are not when the lowest and highest temperatures of the day occur, but I wouldn’t expect as large a difference in trends as is seen here, at least at night.
Furthermore, these day-night differences extend up through the lower troposphere, to higher than 850 mb (about 5,000 ft altitude), even showing up at 700 mb (about 12,000 ft. altitude).
This behavior also shows up in globally-averaged land areas, and reverses over the ocean (but with a much weaker day-night difference). I will report on this at some point in the future.
If real, these large day-night differences in temperature trends is fascinating behavior. My first suspicion is that it has something to do with a change in moist convection and cloud activity during warming. For instance more clouds would reduce daytime warming but increase nighttime warming. But I looked at the seasonal variations in these signatures and (unexpectedly) the day-night difference is greatest in winter (DJF) when there is the least convective activity and weakest in summer (JJA) when there is the most convective activity.
One possibility is that there is a problem with the AIRS temperature retrievals (now at Version 6). But it seems unlikely that this problem would extend through such a large depth of the lower troposphere. I can’t think of any reason why there would be such a large bias between day and night retrievals when it can be seen in the above figure that there is essentially no difference from the 500 mb level upward.
It should be kept in mind that the lower tropospheric and surface temperatures can only be measured by AIRS in the absence of clouds (or in between clouds). I have no idea how much of an effect this sampling bias would have on the results.
Finally, note how well the AIRS low- to mid-troposphere temperature trends match the bulk trend in our UAH LT product. I will be examining this further for larger areas as well.
How much of this is due to irrigation? I know a lot of the farming areas are more humid places than they were in years past, thanks to irrigation. Throw in lawn watering, and that’s a lot of extra moisture being put into the air.
Irrigation?
Well there are are GIS datasets showing the part of the planet that are irrigated
If you take the temperature stations that are in irrigated areas and compare them to non irrigated
there is no statistical difference.
OR, you can search around and find data that comes exlcusively from Ag nets
( temerature stations NOT used by NOAA etc)
and you can compare these to the stations used by NOAA.
answer?
No difference
Been at this since 2009, 10 years of looking at these kinds of things.
IT
IS
GETTING
WARMER
Oh ten whole years! That’s like 0.0000000000000001% of the time we need to understand climate. Keep going, you’ll get there one day.
And yes, it may well be getting warmer. But relative to what? When it was cooler? The 1930s? The MWP? The Roman Warm Period?
I think “Mosher’s” point is don’t point to irrigation as a cause of warming if you want to contribute substantively to the skeptical position.
sycomputing
There is little doubt that places like Phoenix are more humid than they were 50 years ago. Besides the abundant well-watered golf courses, WV from automobile tailpipes, and the proliferation of swimming pools, there are the ubiquitous misters at gas stations, bus stops, and people’s patios.
While the actual temperatures may not be increasing, the heat index surely is. More importantly, the evaporation of the abundant water transfers the heat upwards and downwind and, while in the air as the vapor phase, WV helps retain heat radiated from the surface.
While the actual temperatures may not be increasing . . .
I suspect this is “Mosher’s” point. Unless you would argue that a “heat index” is a more accurate measurement of warming than actual temperatures.
sycomputing
The latent heat of evaporation may be stabilizing the temperature at the source areas of WV. However, that doesn’t mean the increased water vapor isn’t impeding cooling that would otherwise take place. The radiated heat is absorbed by the WV and transported elsewhere. So, while the source areas may not be warming, that doesn’t mean that the globe isn’t heating from the increased WV.
Mosher was typically cryptic. What he didn’t say may be more important than what he did say. That is, he denied that there is a statistical difference in temperatures between irrigated and non-irrigated areas. The implication is that is the annual, average temperature. What is happening to the TMin temperatures? How is it possible to find microclimates that are comparable to irrigated areas that aren’t under cultivation unless there is sufficient water at the surface to not need irrigation? Thus, there is plentiful water to supply WV through evapo-transpiration. In my example (elsewhere) of Phoenix, the immediate metropolitan area doesn’t grow as much as it did 50 or 60 years ago, but the agricultural water has been supplanted by numerous other sources. Is Phoenix one of the “non-irrigated” areas used to compare to irrigated areas? Mosher’s statement is virtually meaningless without all the details.
‘Mosher was typically cryptic. What he didn’t say may be more important than what he did say.’
+1
Yup. There are a few places where you can see the difference. Not a big issue
Mosher
Dale Quatrocchi has demonstrated that urban air masses affect weather for tens of miles downwind. If you are comparing the temperatures of urban areas as defined by corporate boundaries, or even impervious surface percentages, then you are not getting the right results because the rural areas are being contaminated with the urban air masses.
Also, one has to define just what it is that is being warmed. The ground level air is warmed substantially by dark surfaces such as asphalt, whereas irrigated areas are cooled at the surface by evapo-transpiration. However, the water vapor-enriched air rising especially from the irrigated areas offers more opportunity for absorption of IR at night, thus warming the upper air downwind.
Anecdotally, years ago, I used to commute regularly between San Jose (CA) and Sacramento. My car didn’t have air conditioning, so I usually drove with the window down. Somewhere around Davis I would encounter a noticeable drop in temperature, probably around 10 deg F. I would look over and there were several acres of well-watered alfalfa. Clearly, irrigated fields have a significant impact on the local temperatures, although it might not show up in a 25 x 25 Km square.
The coarseness of sampling may be why the impact isn’t more noticeable to you.
And before that (1940-1980)
IT
WAS
GETTING
COLDER
“IT
WAS
GETTING
COLDER”
Because there were -ve forcings in place that overrode the +ve of CO2 – which was only at 310ppm in 1940 (0.5 W/m^2), and 340 ppm in 1980 (1.2 W/m^2).
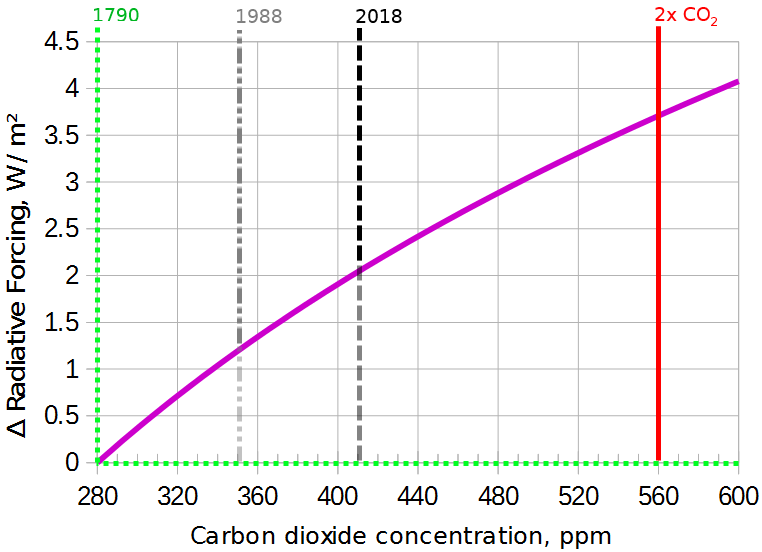
It’s now ~410ppm or 2.1 W/m^2.
http://en.es-static.us/upl/2015/05/carbon-dioxide-ice-core-mauna-Loa-1-e1430956077573.png
And increasing SO2 aerosols ….

Then we have the influence of the PDO ….
Um, they have looked at places like rural Iowa and the central valleys of California. They are moister. Their nights are warmer. There is a lot of crop irrigation.
Yes. Isolated cases.
Not global.
It’s getting warmer.
There was an LIA
Mosher
An inquiring mind might want to understand just why increasing humidity doesn’t cause an increase in temperature. Might it be the latent heat of evaporation is cooling the surface while transporting the heat up and downwind?
IS
IT
GOING
TO
DESTROY
THE
WORLD?
Or are you just back here arguing your angels on the head of a pin again?
Gee Mosh, it took me ten seconds to find opposing claims.
The first is from 2008, before you had been “at this.”
https://journals.ametsoc.org/doi/full/10.1175/2007JCLI1755.1
The second is from 2015.
https://www.weforum.org/agenda/2015/09/how-does-irrigation-affect-climates/
The third is from 2017.
https://phys.org/news/2017-04-cooling-effect-agricultural-irrigation.html
No, irrigation does not create warming…but it certainly affects temperature and apparently even climate.
Does not effect the global mean
And yes you can find isolated areas where it makes a small difference.
We are about 1.2 c warmer than 1850.
It
Isn’t
Irrigation
70 percent of the globe is ocean
FFS
And isn’t the majority of C02 coming from the ocean – something a bit less than 60%?
FFS you claimed, “If you take the temperature stations that are in irrigated areas and compare them to non irrigated
there is no statistical difference.”
FFS the links I provided suggested otherwise.
Now FFS you’re claiming these are just “isolated areas where it makes a small difference.”
FFS here is another that finds a small global impact https://www.upi.com/Science_News/2010/09/08/Study-Irrigation-affecting-global-warming/66711283985586/
FFS it also says irrigation can match or exceed the effect of GHGs at the regional level.
FFS I never said “it is irrigation” that is causing warming or a difference between the trends in day vs night temperatures, just said FFS that your baseless and unsubstantiated claim was false.
Australia too
Warming is seen mostly in daily TMIN and mostly in winter months
https://tambonthongchai.com/2019/02/12/australia-climate-change-daily-station-data/
The USA data
https://tambonthongchai.com/2018/04/05/agw-trends-in-daily-station-data/
I can confirm that for SE Australia, Tmax shows a distinct Pause in the 21st century, whereas Tmin has warmed in a bit in that period.
I think it would be informative to look at the data from 2003 up to 2014. This was before the super El Nino. Over this period I doubt there is much of a trend in the overall data. So, is there still a difference in the day-night values? Are the days cooling and the nights warming?
If the answer to these questions is yes then it could provide some answers. It would tell us how much of the trends of both day and night were not due to the El Nino and how much was. It may be this would provide good data that we need to understand climate sensitivity. It would also tell is how much of the warming was due to the El Nino.
I don’t get it. From wood for trees the linear trend for the UAH data over that time period is .0155C per year or .155C per decade. But the graph looks like it’s about double that. What am I missing?
Joel, certainly they should use AIRS to check out the responses from the middle of the Sahara, the middle of the Amazon/Congo, boreal forests, Antarctica, mountainous areas – all uninhabited regions, and then in urban, suburban, and rural areas of a variety of climate conditions. Who said you couldn’t do experiments in climate?
I think it’s high time we made real scientific use of all this superb instrumentation to advance the science. Even this simple example proves to be surprising to a climate scientist of Roy Spencer’s caliber. Willis uses satellite data in interesting ways and manages to surprise himself every time with the results. When I read the literature, I see mainly that the science of Tyndall and Arhenius hasn’t been improved upon vis a vis CO2 GHG effect. Com’on, let’s finally get a handke on this science. The “Team” actually has no intention or motivation to get at the truth it seems.
I would further want to investigate solar cycle/cosmic ray effects on cloud formation. I have long suspected the effects of cloud cover drive our climate much more than previously understood.
One reason I got the AIRS data was to study cosmic rays
NO effect. no matter how you cut the data
Mosher
You said, “NO effect. no matter how you cut the data” At least none that you could find. “Lack of evidence in not evidence against something.”
Clyde people predicted that a change in GCRs would change the clouds.
I looked found nothing.
They made a prediction. I looked.
nothing.
at some point you actually need some evidence for your theory,
other than your desire for it to be true.
Now, YOU never looked. you never practiced self skepticism
You just believe your theory because you read something.
maybe a paper.
me?
I’m skeptical. There was cloud data … I looked.
nothing.
zip
nada
from some of the best data there is.
global… nothing
NH? nothing
SH? nothing
Different latitude bands? Nothing
low clouds? nothing
high clouds? nothing
over land? nothing
over ocean? nothing
individial grid cells? nothing
zip.
Mosher,
In other words, there were no obvious, first-order effects that jumped out at you after looking at several data sets, and you feel confident that you have demonstrated there are no effects. Once again, “A lack of evidence is not evidence against something.”
You are making assumptions about my past history that are unwarranted as you know nothing about my background or work history. Do you do that with everything?
It might take a more sophisticated approach to teasing out the relationships between variable such as temperature, humidity, clouds, and GCRs than what you have applied.
What is the temperature impact of complete cloud cover?
Is it different in the winter compared to the summer?
The plot indicates that UAH LT temperature trend is about 3.4 °C/decade. Is it correct? This UAH plot shows lower global trend IMO. Does it mean that the US is heating up faster?
http://www.drroyspencer.com/wp-content/uploads/UAH_LT_1979_thru_March_2019_v6.jpg
From the suburbs of Northwest NJ to New York City there is about a 3C temperature increase. I fear the alarms about the end of humanity from such warming are already in evidence – there is something drastically wrong with many of the inhabitants of NYC, starting with their mayor and recent Congressperson.
Catastrophic Anthropogenic Political Climate (PC) Change
As for circumstantial warming, there are open questions. Is it normal? Is it beneficial? Is it anthropogenic, and, if so, how do we sustain it? Will disassembling high-density population center heat islands help people?
Roy
I did the Airs work a few years back comparing both Skin and SAT products
http://rankexploits.com/musings/2014/berkeley-earth-airs/
matches
I was going to investigate Min Max and compare to UAH, but at that time I couldnt figure out
How to get Absoluate T from your files. I figured that out now.
Here in Raleigh during the winter every house and building is heated. Exhaust gases from NG furnaces constantly pour into the atmosphere heating the air. The daytime requires much less heating. The heat generated at night is not inconsequential.
First, there is no instrument at each elevation so the sensor in the satellite is getting convolved sample set of all values integrated together. Then some principle are applied to a deconvolution operator to say how much of the signal comes from each elevation of the atmosphere. So from a sensor standpoint at the top of the graph looking down, the convolution operator error increases with distance from the sensor, essentially exponentially worse. Nothing else is going on. Day vs night? Infrared specular reflectance effect which increases closer to the surface. Essentially, IR scatter.
“the day-night difference is greatest in winter”
Warming always was predicted to be greatest at the cold times and places. It seems this has be confirmed.
It also means that warming means less cold, not more warmth. So in fact global warming is a reduction in extremes of temperature. It means plants an animals are not exposed to such cold temperatures, which is surely beneficial to them.
Agreed, that is the conclusion I arrived at when I first heard of global warming (about 1990).
Warming reduces the problems of extreme cold a lot more that it increases the problems of extreme heat; a net benefit.
Also weather is driven by temperature differences, so raising minimum temperatures more that maximum ones reduces extreme weather.
I think that because we are using a large land mass here that there will be a difference between night and day in the south and north both in winter and summer but I don’t know how that would affect the data.
It’s not the UHI effect.
The exact same thing is going on at the highest latitudes but is stretched out into a seasonal variation vs diurnal because of the great disparity in the length of day between Winter and Summer.
Look at the Artic for instance. It’s the Winters that have become much warmer because the Winters are an extended version of night. The Arctic Summers, however, have not warmed that much. Not coincidentally, they are also an extended version of daytime with solar radiation around the clock(though from a low angle).
There is no UHI effect in that part of the world.
I believe it’s from increased water vapor/higher dew points. Put more moisture into the air and it reduces the spread/disparity between daytime temperatures…….which warm slower and nightime temperatures ……that cool slower.
It takes more solar energy to heat humid air and that humid air takes longer to cool it at night/radiate heat out because it’s holding more energy.
We can all agree that H2O is the main greenhouse gas. This diurnal temperature signature is exactly what you see when you increase water vapor.
It’s more amplified at the higher latitudes because the air is driest there and the contribution of increased water vapor is more significant.
As an operational meteorolist for 37 years, I’ve noted big positive temperature anomalies over the highest latitudes for very long stretches in the Winter months at both the Arctic and the Antactic.
In the Summer months, it’s just the opposite, with negative temperature anomalies often prevelant and almost never the positive anomalies that we commonly have witnessed during the Winters for the past 2 decades
You will also note the same difference between regions with dry air masses compared to more humid regions. The diurnal temperature spread decreases with increasing H2O in the air.
What would happen to our planet if we took all the water vapor out of the atmosphere?
Nights would be brutally cold.
Just the opposite is happening because of a bit of an increase in water vapor across the globe, with the effects greatest over the driest areas……..high latitudes……land.
One thing that has changed a lot during this time is aerosols.
If aerosols cools when present it will give less cooling when lacking.
Less cooling is warming.
But why not warming at daytime?
Interesting stuff. I am slightly confused by using a decadal trend for 16 years worth of data though? That seems really inappropiate for a data set less than two “units” long. Its also intriguing and rather counter-intuitive that higher nighttime temperatures don’t feed through into higher daytime temperatures. It suggests a high degree of independence that I would not have suspected.
I have collected 5 minute temperature data at my rural KS site on a 24/7/365 basis since 2002. My data shows very similar results as Dr. Spencer shows. My data shows that daytime temperatures are actually trending downward and not upward as Dr. Spencer shows. My data also shows that nighttime temperatures, however, are trending up. A linear regression on all of the data shows a slight upward trend, mainly fueled by the higher nighttime temperatures.
I don’t have the knowledge to explain why this is but I believe that our rural agriculture transition away from low evapotranspiration crops such as wheat, milo, and pasture grasses to higher evapotranspiration crops such as soybeans, rice, and corn has something to do with it. This evapotranspiration provides water vapor that cools during the day but insulates during the night. One result of this is longer growing seasons. That is not a bad thing.
I also suspect that this transition to high evapotranspiration crops is happening on a global basis as these crops represent high energy crops that can feed a growing population. Is this enough to cause what Dr. Spencer has identified? I simply don’t know. But it is possible that it is a contributing factor.
Tim,
Great observations. This also effects the entire Cornbelt/Midwest in similar fashion………..during the growing season.
Tightly packed rows of corn(twice as dense as 40 years ago) are adding tremendous amounts of moisture to the air from evapotranspiration……….especially during the months of June/July when evapotranspiration peaks.
From September to the following April(into much of May for seasons like this one), this can’t be a factor because the crop is no longer actively growing.
Mike, the graph appears to show the average deviation from some seasonal average cycle which I’m not sure its origin. If the deviation of the nighttime temperatures go up during the summer and fall seasons then the overall average will go up as well. It’s like have a data set of 1,2,3,2 for the four seasons (winter, spring, summer, fall) and then having a dataset of 1,2,4,3 equivalent to having higher deviations in the summer and fall due to evapotranspiration. The average deviation goes up, it doesn’t stay the same or go down. So just because it happens during part of the year doesn’t prevent it from impacting the overall average deviation.
OK, wait. The Sun heats the Earth during the day. When the Sun goes down, the Earth becomes the heat source and emits its blackbody radiation. That’s when the GHG’s are at work.
That means we would expect what the NASA graph depicts
No. Earth emits blackbody radiation all day and night. It emits most OLR during the day because it is warmest during the day! According to theory GHGs work 24/7/365. They have no holidays.
50% of weather stations are located in urban or urbanized areas like airports. But globally only 5% of earth’s population live in 95% of land area. So 95% of the population live in only 5% of the area! In a country such as UK, 3% of our land is built on. It seems likely that some 50% of weather stations are located in or near the 5% of land where 95% of people like; and that the other 50% of weather stations are in the 95% of land where only 5% of people live.
I suggest we move all weather stations away from built up areas. Stop measuring daily average temperature by taking the average of the highest and lowest readings for the day. Outfit all weather stations with hourly, or half-hourly recording equipment. Get them to phone in, or use satellite relays. That way we avoid human error too when measuring. Ensure all stations use 3 separate thermometers which work on 3 separate temperature measuring principles. In that manner, each acts as a control for the other two. This kind of thing should’ve been done decades ago. Stop wasting money on useless desk-bound computer gamers. Start spending money gathering excellent quality data.
The Urban heat island effect best explains this warming at night.
+1. I would only add that an average daily temperature, even if determined by hourly readings, is useless for determining what is actually happening. You can calculate an average speed for a train that leaves Point A and derails at Point B. But it won’t tell you that the train was going to fast for the curve at Point B!
Mark Pawelek
But, the nighttime temperatures coincide with an emission peak that is nearly identical to the overlapping absorption features of H2O and CO2, thus closing the door. However, the daytime summer highs move the emission peak to a region that is more transparent. That is, a hot daytime temperature can radiate to space more effectively than a cool nighttime temperature.
My post above is in error. Dr Roy is almost certainly right: higher night surface temperatures are due to more cloud cover. Of course – this is something one needs to show. No evidence suggests that, with a clear sky, an atmosphere with 400ppm CO2 will be noticeably warmer at night than one with 300ppm.
“The Urban heat island effect best explains this warming at night.”
no.
The AIRS satillite views all of the USA at a 25km resolution.
The portion of US teritory that is urban is TINY,
For example
https://www.citylab.com/equity/2012/03/us-urban-population-what-does-urban-really-mean/1589/
For every 25km grid that is urban, there are 20 that have zero people
Mosher
A bit of hyperbole! Except for some of the highest mountains and hottest deserts, there are probably few areas in the country that have “zero people” Even Death Valley has permanent residents and transient tourists year round.
Compared to even Landsat with a nominal 28m pixel resolution, 25KM is extremely coarse. You can’t see the trees, only the forest. When doing multispectral classification, resolution can affect the result significantly because with Landsat, shadows are a part of the spectral signature. At the resolution of SPOT or the Worldview satellites, shadows become a separate spectral class that are only separable by context, as with object-oriented classifiers.
The approaches that you have used suggest that you have little direct acquaintance with remote sensing.
“50% of weather stations are located in urban or urbanized areas like airports. ”
nope
The earth emits only when it is the heat source, that is when it is hotter than the atmosphere and incoming solar radiation.
Joe G,
You are wrong. Any body above absolute zero will radiate, with the peak IR emission governed by the temperature. I think you are confusing IR radiation with conduction, where heat moves from the higher temperature to the body with the lower temperature.
So Earth Day should be replaced with National Asphalt Parking Lot Day.
The Urban Planning Profession is complicit.
Daytime highs hardly changing and nighttime lows increasing agrees w/my own observations here in the rural central Appalachians. A reasonable person would think that would be a good thing….
At the risk of stating the Obvious…
1. Temperature T is relevent only for dry air, for moist air T is “swamped” (sorry) by Enthalpy making T irrelevent as an indicator of energy content.
2. If warming is predominantly reflected in Tmin (night) then the temperature gradient driving weather should be weakening ergo reducing the probability of violent storms.
Good post with some enlightening comments!
Cheers
Mike
“But I looked at the seasonal variations in these signatures and (unexpectedly) the day-night difference is greatest in winter (DJF) when there is the least convective activity and weakest in summer (JJA) when there is the most convective activity.
One possibility is that there is a problem with the AIRS temperature retrievals (now at Version 6).”
___________________________________________________
It is probably in winter
a greater difference between air surface temperature and temperature throughout the troposphere
than in the summer.
___________________________________________________