Excerpts of the Business Insider article by Aylin Woodward
Hawaii’s iconic Waikiki Beach could be engulfed by the ocean in 20 years — here’s the plan to save it

In May 2017, high tides engulfed parts of the iconic Waikiki beach, edging dangerously close to waterfront hotels. This kind of high-tide flooding, often called a king tide or sunny-day flood, occurs when ocean water surges to higher levels than coastal infrastructure was designed to accommodate. In that case, water levels rose 2.5 feet above average in Waikiki, drowning nearby roads and sidewalks.
According to a 2017 report (which was updated in September 2018), Hawaii’s state capital and Waikiki Beach – along with other coastal strips on Hawaii’s five islands – are expected to experience frequent flooding within 15 to 20 years.
“This flooding will threaten $5 billion of taxable real estate; flood nearly 30 miles of roadway; and impact pedestrians, commercial and recreation activities, tourism, transportation, and infrastructure,” Shellie Habel, lead author of the 2017 study, said in a release.
Now, Hawaii state lawmakers are taking steps to shore up the state’s beaches and coastal cities. A new bill that mandates a statewide shore protection program has passed both houses of Hawaii’s state legislature, and will soon makes its way to the governor’s desk for approval.
All well and good that they want to improve beach resilience. But, the claim that ” Hawaii’s iconic Waikiki Beach could be engulfed by the ocean in 20 years ” is totally bogus.
Here is why:
First, lets look at real world data (as opposed to model projections).

Source:
https://tidesandcurrents.noaa.gov/sltrends/sltrends_station.shtml?id=1612340
According to the official NOAA data, there is a 1.49mm per year sea level trend extending back to the year 1900.
According to elevation data via Google Earth the top of Waikiki Beach is about 8 feet above the mean sea level there.
8 feet = 2438.4 milimeters
…at a rise rate of 1.49mm/year based on the NOAA sea level rise rate we have:
2438.4 mm / 1.49 mm/year = 1636.5 years
In 20 years, sea level would have advanced only
1.49 mm/year x 20 years = 29.8 mm or 0.098 feet
Once again, reporters can’t do basic math, but they sure can exaggerate.
Next, let’s look at the 2017 Report they cited as “having passed peer review”, from the methodology section:
Modeling, using the best available data and methods, was conducted to determine the potential future exposure of each island to multiple coastal hazards as a result of sea level rise. Three chronic flooding hazards were modeled: passive “bathtub” flooding, annual high wave flooding, and coastal erosion. The footprints of these three hazards were combined to define the projected extent of chronic flooding due to sea level rise, called the sea level rise exposure area (SLR-XA). Not all hazards were modeled for each island due to limited historical information and geospatial data. Each of these hazards were modeled for four future sea level rise scenarios: 0.5 feet, 1.1 feet, 2.0 feet and 3.2 feet based on the upper end of the IPCC, Assessment Report 5, representative concentration pathway 8.5, or “business as usual” sea level rise scenario.
Even with 3.2 feet of projected sea level rise, the threat when viewed in terms of real-world data is many years away:
3.2 feet = 975.36mm 975.36mm/1.49 mm/yr = 654.6 years.
As anybody in the climate business knows, RCP8.5 is a ridiculous “worse than worst case” climate model that has no real-world counterpart. Only politicians and low information journalists give it any credence.
The follow of this entire thing is that they’d rather look at model data, than the real-world data. But then again, you can’t get grants for stuff that will happen 600 to 1000 years in the future, can you?
It doesn’t matter, as really super smart people tell us that the world will end in 12 years (or is it 11?), so it doesn’t matter what floods in 20 years.
/scarc
Here’s a good discriminator for you to use:
If one person tells another the world will end in 12 years, and the other person believes them, then neither of them is super smart, and you may safely discount the opinions of both.
your parenthetical question assumes the author of the prediction can perform basic math functions. 12, 11, 12.5 billion? Its a bit paradoxical
Hey, it’s 11 yrs 9 months now!! Get me a DBL tall Vodka club with a twist AOC!!!
For those next 12 years, China and India canon continue increasing CO2 emissions under the Paris Accords that Kerry and Obama worked so hard on.
One failed bartender who spoke to Gaia said that there’s only twelve years left to save the world. What part of this don’t you get?
The sad part about this is that Scott Adams of “Dilbert” fame is 100% correct; facts don’t matter. As scientists we need to get over ourselves and understand that the radical greenies want us to continue arguing facts because facts are for losers. The radicals understand that clicks and re-Tweets are all that matter now.
Fortunately, Trump gets that too and he’s the only one fighting fire with fire.
1.49 mm, lost in the background noise.
I have spent most of my working life measuring sea level, initially mechanically with rubber diaphragms attached to ‘elephants feet’ and tide poles now with solid state sensors. The accuracy and precision has improved considerably over the years, but I have never seen anything that can measure 1.49mm.
Those would be Seattle-lites
1.49 mm/y is the slope of the linear regression on 120y of data. Could you measure 18cm?
NOT over 120 yrs at the same spot!
I just want to thank WUWT. I always turn to it upon reading the latest gloom and doom report, as I did today about Hawaii beaches and some recent flood events, and I always find solid information. Thank you. PS: I have found that the best way to confront alarmists is with their own propaganda resources. For example, even the IPCC says there is no evidence to support climate change/global warming causation for supposedly more frequent and more severe hurricanes and similar weather events, yet alarmists keep conflating them; and a federal court judge recently tossed a case against oil companies over causing climate change simply by reading the actual IPCC reports in full, which in detail do not support the headlines they generate. (Brilliant move by the oil companies.) This usually makes anyone who will listen at least wonder if the emperor is wearing no clothes. Of course, there aren’t that many who will listen
Business Insider = worthless clickbait
The sand has been being replenished for nearly ONE HUNDRED YEARS.
https://www.hawaiimagazine.com/blogs/hawaii_today/2009/2/20/Waikiki_beach_sand
‘Now, Hawaii state lawmakers are taking steps to shore up the state’s beaches and coastal cities. A new bill that mandates a statewide shore protection program has passed both houses of Hawaii’s state legislature, and will soon makes its way to the governor’s desk for approval.’
Government ‘help’ will surely ruin it.
Waikiki beach is man made any way. I would think that erosion is the normal state of things as natural processes try to remove this unnatural anomaly.
They must be eroding someone else’s coastline to keep building this one up.
Indeed, that is a problem, which was solved a long time ago. I recall about 50 years ago seeing a big pile of sand on Waikiki beach; people were sunbathing on it. I was informed this pile of sand had just been shipped over from Molokai, and would soon be spread out to maintain this major tourist beach.
Indeed, that is a problem, and it was solved a long time ago. About 50 years ago I was a big pile of sand on Waikiki beach; some people were sun-bathing on it. I was informed this sand had just been shipped over from Molokai, and would soon be spread out to maintain Waikiki, the main tourist beach.
What this does for me, and ought to do for the opposition as well, is to put all forecasts of rising sea levels in perspective. Erosion may be inexorable but it is also a very slow process; even if the sea were rising a meter or more per century, you can easily keep ahead of it if you’re willing to put the earth-moving machines to work once a year or so. If a piece of dry land isn’t worth that level of effort to preserve, then it’s unlikely to be missed.
But it is also an indictment of Aylin Woodward and Business Insider. And the state legislature. The replenishment of Waikiki Beach is COMMON KNOWLEDGE. Yet the above don’t know it. How can they not know it? The state capitol is less than 3 miles away.
When I lived on the island of Molokai not far from where the sand for Waikiki came from the facilities to trans ship sand was still in place. Sand was trucked to the tip of Molokai and the natural current flow barged all the way to Waikiki. The boat paddle race is still run there.
Of course they have to replenish the sand at Waikiki, there wasn’t any there until Matson Lines shipping Company decided to make Hawaii a tourist destination and built the Royal Hawaiian Hotel and covered the natural black lava with imported white sand.
Did they cherrypick 1988-2017 to claim bad future developments?
I saw similar news on Hawaii with a graph that didn’t look too real a while ago.
What a lot of people fail to take into account is that sand beaches change all the time. Right now Lake Michigan is higher than it’s been in years, but we have more beach than the last 3 or 4 years because it has been reshaped dramatically over the last 8 months. Funny that people think that sand just stays in place when wave action is working on it 24 hours a day
Even a short time studying the geography of beaches can be very instructive.
In places like the East coast of the US, the shape of the shoreline varies over the course of a year.
Gentle waves in Summer move sand from offshore onto the beach. Large waves from storms move it from onshore to offshore.
Storms that erode beaches away just move the sand a few hundred yards at most.
Over longer periods, sand is transported perpendicular to the shoreline, north to south in most places on the US East coast, for example.
It seems from reading the quoted paragraph, they modeled damage which might result if sea level rises some amount. They did not model the consequences of “climate change” on sea level and then the resulting damage. Why not insert a rise of 100 feet into the model. Then I am sure, the damages will be very substantial.
Furthermore, PSMSL.org shows two GPS elevation gauges in Honolulu. They show that Honolulu is sinking at a rate of -0.23 or -0.62 mm/yr. Pick your gauge. This reduces the absolute sea level increase to somewhere around 1 mm/yr.
Surely if we sacrifice Gore to “Madame Pele”, this will save the beaches?
If nothing else, it will demonstrate the futility of such gestures.
But I would feel SO much better!
In Seattle, when early flush toilets were installed in the basements,
tide charts were tacked on the nearby wall.
A person might need “to go” in a hurry, but the city functioned.
In 50 or 100 years, waterfront buildings may need minor adaptations.
More likely, new buildings will replace what’s there now.
Meanwhile the islands slide off to the northwest and join the Emperor Seamounts.
Ha ha, I just got done making this little graph to post somewhere else:
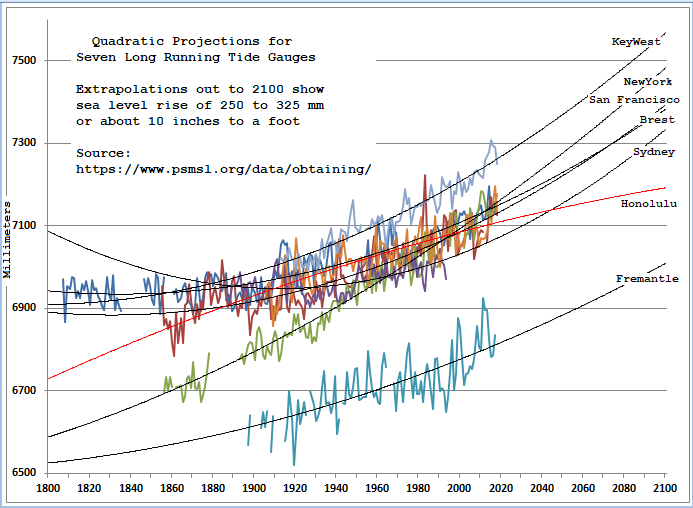
Honolulu is on course to maybe see a little over 3 inches of sea level rise by 2100
“The relative sea level trend is 1.49 millimeters/year with a 95% confidence
interval of +/- 0.21 mm/yr based on monthly mean sea level data from
1905 to 2018 which is equivalent to a change of 0.49 feet in 100 years.”
…6 inches in 100 years
Latitude April 25, 2019 at 1:46 pm
An extrapolation of the quadratic gives you a little over 3 inches by 2100 and the linear trend yields about 4 inches and yes (100years x 1.49mm/yr)/25.4mm = 5.87mm or 4.9 feet And thanks for the reply.
(100years x 1.49mm/yr)/25.4mm = 5.87mm or 4.9 feet
extra-large mm?
Steve, that’s the NOAA quote at the bottom of the NOAA tide gauge data for Honolulu….
https://tidesandcurrents.noaa.gov/sltrends/sltrends_station.shtml?id=1612340
This was on my “Sea Level” Google News search a day or so ago:
Waikiki Flood Concerns Spur Push For Hawaiʻi Shore Protection
My comment over there says:
“The Honolulu Tide Gauge
https://www.psmsl.org/data/…
when plotted out shows us that sea level rise is on
course to increase by about 100 mm (~4 inches) by 2100.
https://i.postimg.cc/1XXKGs…
Policy makers need to question how the
“Sea Level Rise Vulnerability and Adaptation Report”
comes up with three feet by 2100. After all, the report says:
As with all models, it is important to understand the methods,
assumptions, limitations, and uncertainties of the methods used.
The risks associated with use or non-use of the results are assumed
by the user.1“
Note the text on those tide chart pages.
Those graphs are not data at all.
I wonder if they have the raw tide gauge data available for examination?
Wait, wait, they did say “could”. Lots of things could happen in 20 years. We could be invaded by space aliens and no longer exist. Or be wiped out by a super bug, or a large space rock. Heck, the sky’s the limit.
What this study will do is to allow an excuse for the local jurisdictions to poke around with “erosion control & beach stabilization” pet projects, while at the same time continue telling private folks that they can’t do the same … because of the environment.
Ho hum, just another catastrophic prediction to add to the heap of failed predictions that they conveniently ignore.
I bet the Waikiki residents have the best handle on what is happening to their seafront.
How have property prices been heading since the Global Warming scare took root over the last 40 years?
Is there a fire sale of owners hoping to pass something on to mugs with only a decade before their paradise is inundated.
This is the level of journalism you can expect when our public schools are teaching the three basic rock types (igneous, sedimentary, metamorphic) as all you need to know about geology.
Current level is about the same as 1980 or 1940 insighttps://tidesandcurrents.noaa.gov/sltrends/sltrends_station.shtml?id=1612340
Level 100 years ago was about 6 inches lower. The average tidal range, low to high is less than 2 feet.
Umm…IF pedestrians are ‘threatened’ by the sea level rise….then they deserve to get wet…..just saying!!
Thinking about it, the author must have been a pedestrian somewhere and got wet, for the article is a carry over of that event and is itself a touch soggy.
“If the data does not match observations, change the data.. or the observations.. or both”
Thus spake High Priest Aypee-Sisi
Speaking of disappearing, Baltimore mayor who filed climate lawsuit after Bill Deblasio’s suit was thrown out…
https://www.google.com/amp/s/www.washingtonexaminer.com/policy/energy/baltimore-mayor-sues-over-climate-change-after-de-blasios-case-gets-thrown-out%3f_amp=true
disappears after FBI/IRS raid ger home and offices.
https://www.google.com/amp/s/www.wbaltv.com/amp/article/fbi-searches-baltimore-mayor-catherine-pughs-home/27267886
The tide gauges show little cause for concern, but even they cannot be trusted for any scientific purpose, let alone to guide policy making decisions.
The idea that those tide gauge charts are “real world measured data” is deceptive, and may be completely bogus.
This is the text below the tide charts:
“The relative sea level trend is 1.49 millimeters/year with a 95% confidence
interval of +/- 0.21 mm/yr based on monthly mean sea level data from
1905 to 2018 which is equivalent to a change of 0.49 feet in 100 years.
The plot shows the monthly mean sea level without the regular seasonal fluctuations due to coastal ocean temperatures, salinities, winds, atmospheric pressures, and ocean currents. The long-term linear trend is also shown, including its 95% confidence interval. The plotted values are relative to the most recent Mean Sea Level datum established by CO-OPS. The calculated trends for all stations are available as a table in millimeters/year and in feet/century (0.3 meters = 1 foot). If present, solid vertical lines indicate times of any major earthquakes in the vicinity of the station and dashed vertical lines bracket any periods of questionable data or datum shift. ”
So, it says right there that this is not data, it is a modelled result, processed to remove all sorts of information, and then plotted as an deviation (anomaly) from a calculated value, the so-called ” Mean Sea Level datum established by CO-OPS’.
So, what the hell are those charts actually showing?
They aint data!
Just look at what was reported as the sea level record prior to the beginning of the climate change shenanigans in the late 1980s.
There are several decades long periods where the sea was falling or static.
The charts on that page all look monotonic because they are fake.
For real world, how about looking at phot evidence?
We all know that for crimes and such, video or photos, provided they are verified as undoctered, are far more compelling that what anyone says or what a chart or graph tells us.
Many sea side locations have photographs of the beach and adjacent areas, going back well over 100 years in many cases.
There is not a single location that shows, via comparison of photographs from many decades ago vs. ones taken now or recently, that shows a visible change of the ocean in relation to structures or infrastructure.
It is a manufactured issue, 100%.
Erosion is a problem, sea level rise is not.
Storms are a problem, not the rising oceans.
The East coast of the US, and most other places where people live I suppose, used to have massive dunes in wide areas. These have been flattened, and in many cases stabilizing vegetation removed.
People build and rebuild in locales in which there is very little chance of 100 years passing between storms large enough to overwash the barrier islands completely.
That is how those barrier islands even exist!
They are a large scale fractal analogue of sand bars that can be seen to form in the surf zone.
Can someone tell me/us how to post a photograph?
Is it even possible to post an actual image, rather than a link to one?
AFAIK, you have to link to it.
Wasn’t the home of Gavin Schmidt supposed to be under sea water, sea levels being “level” globally, over 20 years ago?
Did someone mention clickbait?
Surely if the legislature is committed to stopping claimed sea-level rises they would attack the problem at what they believe is its source by banning all carbon dioxide-producing tourism flights to the state!