An El Niño that began to form last fall has matured and is now fully entrenched across the Pacific Ocean. Changes in sea surface temperatures (SSTs) brought about by an El Niño affect the atmosphere, resulting in distinctive changes in the rainfall pattern across the Pacific Basin. These changes show up as anomalies or deviations in NASA’s analysis of climatological rainfall.

This map shows sea surface temperature (SST) anomalies for the Pacific Basin, shown as degrees Celsius above or below average.Credits: NOAA Climate Prediction Center
In a typical El Niño, warmer than average SSTs off the coast of Peru lead to enhanced convection (rising air that condenses and forms clouds and storms) and above average rainfall in the eastern Pacific near to the Equator and lower than average rainfall over the western Pacific.

This map shows the average precipitation rate across the globe in millimeters per day for the past 30 days leading up to April 1st, 2019, calculated using the TRMM Multi-satellite Precipitation Analysis (TMPA) product.Credits: NASA’s Goddard Space Flight Center
However, recent estimates of monthly average rainfall and corresponding rainfall anomalies show heavy rain and above-average rainfall located across the Equatorial Central Pacific not the eastern Pacific. This is what is known as El Niño “Modoki” (Japanese for “a similar but different thing”) or a Central Pacific El Niño, wherein enhanced SSTs and rainfall occur near the dateline and not near the coast of Peru.
The estimates are generated from the legacy TRMM-based TMPA rainfall product at NASA’s Goddard Space Flight Center in Greenbelt, Maryland. TRMM was the Tropical Rainfall Measuring Mission satellite that the rainfall product was based on and named for, but TRMM has been succeeded by the Global Precipitation Measurement (GPM) constellation of satellites. TMPA rainfall is the TRMM Multi-satellite Precipitation Analysis.

This map shows where precipitation rates were higher or lower than the climatological average, for the past 30 days leading up to April 1st, 2019.Credits: NASA’s Goddard Space Flight Center
As with a traditional El Niño, the effects from a Central Pacific El Niño can still spread to the U.S. Also, clearly visible in the NASA-generated monthly average rainfall was an area of heavy rain over the southeast coast of Africa associated with the passage of Cyclone Idai, which devastated the region with torrential flooding.
For more information about El Nino, visit: https://www.pmel.noaa.gov/elnino/definitions
Learn more about NASA’s Precipitation measurements: http://pmm.nasa.gov/trmm
By: Steve Lang
NASA’s Goddard Space Flight Center, Greenbelt, Md.
The precipitation map suggests to me that the wet spring we have had in California is nothing unusual.
This is the wettest spring I have seen of the last 9 years for Northern California. This is the first April to see heavy snows in the surrounding mountains here in Trinity County. Most of the previous winter/springs saw no snow in the mountains after late January, except on the peaks in the Trinity Alps. Now driving into the town of Weaverville the surrounding ridges to the west are snow covered down to around 4,000′ elevation. Looks different to me.
Two points: Only 9 years is a very short time. The precipitation anomaly map is relative to the “climatological average” which presumably reaches back at least to 1979.
Also, 2017 was a banner snowpack year in the Sierra (as was 2011). So … not sure how your locale missed out on the 2017 party.
That was a good rain/snow winter, well above average. The snow melted early though. It was gone by the end of February, because of the continued warm conditions. So this winter/spring is a notable change from the last 9 years. For example in spring of 2015 and 2016 the snow was gone by the middle of January. That was exceptionally early.
The 9 years has to do with my moving into this area in 2011. Of note in that though was that in April and all through May of 2011 temps in the spot where I stayed did not rise above 50 F where I was staying. That was partly due to the location having a ridge sitting to the southwest. That makes that piece of property a cold spot, but still surprising that temps stayed so cold all through May of that year. Looking back there is that cold dip at the end of 2010 and into 2011 which explains why such cold temps so late in the year for the area.
Is this a last big hurrah, where the earth is belching out heat energy, that may not be so easily replenished???
No. The El Niños tend not to cool the ocean as much as it has been globally warming, so nothing to fear in thst sense.
Californians need occasional El Niños to get water, so good to see one around. Let’s hope they don’t break the Oroville and that they understand that logging reduces future fuel at the logged area.
HUGS: That’s what I mean… by belching out heat, it will cool the ocean… the heat eventually leaves the earth and may not be replaced with the current solar conditions… if there is less supercharging during the following La Nina or ENSO neutral conditions.
Taking solar forcing as a single source. But what about the seamount volcanic activity? A 5% constant state of actively erupting surface volcanoes, which is more like 15% in recent history, translates to quite a lot of heat energy when tabulated against the estimated 3 million seamount volcanoes. A potential uptick from 150,000 to 450,000 active seamount volcanoes pumping heat into the World’s oceans.
SeanC: Sounds like a negative feedback possible based on your post. Didn’t I hear somewhere that low solar activity leads to changes in our magnetosphere that affect earth’s core… this increasing volcanic activity?
Intriguing ideas above, Sean and Mario …
A couple of cites re: solar magnetic activity, seamount volcanoes, and lava geochemistry which, I hope, might be helpful here (emphases mine):
1)
(Source: Abstract for Ebisuzaki, Toshikazu & Miyahara, Hiroko & Kataoka, Ryuho & Sato, Tatsuhiko & Ishimine, Yasuhiro. (2011). Explosive volcanic eruptions triggered by cosmic rays: Volcano as a bubble chamber. Gondwana Research. 19. 1054-1061. 10.1016/J.Gr.2010.11.004. )
Here:
https://www.researchgate.net/publication/234022172_Explosive_volcanic_eruptions_triggered_by_cosmic_rays_Volcano_as_a_bubble_chamber
2)
(Source: The Magmatic Architecture of Taney Seamount-A, NE Pacific Ocean,
Jason P. Coumans John Stix David A. Clague William G. Minarik
Journal of Petrology, Volume 56, Issue 6, June 2015, Pages 1037–1067, https://doi.org/10.1093/petrology/egv027 )
It’s been persistent El Nino conditions now for awhile. And it’s been about 7 years since the last significant La Nina conditions. It makes me think the next big La Nina is impending and the effects on global temperature will be noticeable.
I believe what you meant to say is that the HORRORS of my driving an ICE automobile to the grocery story spells impending DOOM. And that all that Natural Gas my 93% efficient forced air furnace burned to warm my home this winter has unleashed impending DOOM! Gotta stick to the … narrative.
The last La Nina ended almost exactly one year ago.
Please find you way to page 22 of this NOAA document. https://www.cpc.ncep.noaa.gov/products/analysis_monitoring/lanina/enso_evolution-status-fcsts-web.pdf
A very weak one.
So, I’m extremely confused. I’ve been watching a giant plume of cold surface water off Peru for months, and have been waiting for the La Nina to be declared…
(That’s displayed on the Weather Underground tropical weather page if you click on the thumbnail.)
So, what’s the story? Is the Weather Underground site getting bad data somehow? I see no sign of unusual warming in the Central Pacific either…
Terry
Thanks for the link to Weather Underground site link for Global SST anomaly map. The map do not look right. The SST anomaly shown for Eastern Pacific Ocean is in the range for -1 C to -3 C and The Central Pacific Ocean is also shown to have SST in the Negative zone, which is highly unlikely.
See for Nino1.2

and Nino3.4
All right, well that’ll teach me to verify with a second source every time. Thanks!
Try this one
https://weather.gc.ca/saisons/animation_e.html?id=year&bc=sea
You also always use the WUWT reference pages for pretty much any sort of data and maps you might like.
Here is the data used by NOAA. The ONI says we’ve been under the influence of El Nino since last October.
https://origin.cpc.ncep.noaa.gov/products/analysis_monitoring/ensostuff/ONI_v5.php
Still handing in there according to the Nino 3.4 area.
That would explain why the UAH didn’t drop as far as I thought it would. It also suggests that if you are right and we’re about to see a big La Nina event then we might see a substantial drop in global temperature for a few years.
El Niño–Southern Oscillation is at ALERT level
The Bureau’s ENSO Outlook remains at El Niño ALERT. This means the chance of El Niño developing in 2019 is approximately 70%; around triple the normal likelihood. While tropical Pacific Ocean temperatures have been at or near El Niño thresholds in recent weeks, there has not been a sustained El Niño-like response in the atmosphere. Most international climate models indicate that the tropical Pacific Ocean temperature will continue to be close to the El Niño threshold till mid-year. However, less than half of the surveyed models are forecasting El Niño-like warmth in spring.
(Yesterdays update)
http://www.bom.gov.au/climate/tropical-note/
The BoM’s longer term forecasts are known for being less than accurate that a toss of a coin, so this is make it almost a certainty that we will have a La Nina.
BoM sets a higher threshold for el Nino conditions than NOA. NOAA uses >0.5C above the long term mean for 5 overlapping seasons (consecutive rolling 3-month periods); BoM use >0.8C over the same period.
El Niño–Southern Oscillation is at ALERT level
The Bureau’s ENSO Outlook remains at El Niño ALERT. This means the chance of El Niño developing in 2019 is approximately 70%; around triple the normal likelihood. While tropical Pacific Ocean temperatures have been at or near El Niño thresholds in recent weeks, there has not been a sustained El Niño-like response in the atmosphere. Most international climate models indicate that the tropical Pacific Ocean temperature will continue to be close to the El Niño threshold till mid-year. However, less than half of the surveyed models are forecasting El Niño-like warmth in spring.
(Yesterdays update)
http://www.bom.gov.au/climate/tropical-note/
I think it’s most likely going to dissipate, per the pattern wrt the solar cycle, unless SC24 has already reached it’s minimum. The blue circles with the question marks are near to where we are headed if the prior patterning is generally upheld.
The last minimum was followed by a solar cycle onset ElNino in ’09/10 that was boosted by TSI as sunspot activity increased.
Central Pacific Outgoing Longwave Radiation this year through March is showing energy being absorbed in the ocean, as it did in late 2006/early 2007 ElNino before heading into LaNino-ish mode:
2018.042 25.15
2018.125 6.28
2018.208 15.22
2018.292 20.50
2018.375 14.53
2018.458 10.39
2018.542 5.29
2018.625 4.84
2018.708 6.29
2018.792 6.31
2018.875 2.72
2018.958 2.50
2019.042 -1.28
2019.125 -14.40
2019.208 -14.09
The hovmoller plot for Pacific eq ohc for the last year indicates the most recent heating occurring from the duration of climbing and higher TSI spikes. SORCE TSI plotted without scale there, somewhat comparable to the 2009/10 TSI changes.
It’s going to be interesting to see how long this lasts. New sunspot formation increases would increase TSI, which would fire this ENSO right up, and the prior ENSO pattern may be interrupted/extended. If that happens we might be looking at a similar analog to the great 1878/79 ENSO, which also followed the solar minimum.
Pacific subsurface warm pool showing signs of breaking up. Basin-wide OLR indicates extensive cooling just north of the equator.
I’d say the snow records this past winter resulted from lots of ElNino equatorial evaporated water vapor smacking right into solar minimum low TSI cooled air.
BOM Pacific subsurface warm pool currently being undercut by cooler water.
The equatorial Pacific is cooling very rapidly, right now!
RE: “In a typical El Niño, warmer than average SSTs off the coast of Peru lead to . . .”
Strong ElNo’s usually mean mild winters here in Southern Ontario. Last winter was anything but mild, I believe record breaking in a few stats. IE: coldest February, most snow somewhere, etc.. We had some snow, freezing rain just days ago. I’m still waiting for spring. I’m wondering if it depends on when/season the flip happens (and by how much)? Or does the major energy exchange happen during the same season(s) and it’s just a matter of degrees in change?
Joe Bastardi was basing his winter 2018-2019 forecasts on there being a Modoki El Niño since early last Autumn.
Which describes a water vapor pump mechanism sending massive volumes of very GHG active water vapor into the atmosphere.
Something else that Joe Bastardi has been remarking about.
Water vapor increases that allow cold dry regions to warm more than when they were much dryer.
Excellent post Steve Lang!
Meanwhile over the Atlantic, the accumulated cyclonic energy looks to be fairly low this year, but expect to see every low pressure area bearing a name, making for a record number of storms if they can help it. 😉
El Niño “Modoki”
Mixing Spanish with Japanese. That seems natural.
Sort of like how we say quadriplegic (mixing Latin with Greek) rather than tetraplegic which my spell-check doesn’t even recognize.
I think the only cure for this predicting is to burn all the statistics books, outlaw record keeping, outlaw the use of averages and models and go back to looking out the door to see what the weather is like. It was so much simpler and more accurate back then.
Seriously?
Who effing cares?
It’s hot it’s cold, the wind blows, it doesn’t, snow falls, sun shines, and what the hell is the difference, what has been the difference over my 60 years of life?
Parts of London and Australia were brought to a standstill by the useless, self serving, socially parasitic climate change SJW warriors, and did it make an iota of difference to the climate? Not an effing chance!
I really wanted to dispense some righteous judgement on those freaks in London who consider it their duty to halt the very system that allows them to sit in the middle of a road, scrawl graffiti, and leave piles of rubbish behind them. The very stuff they are supposed to be objecting to, scattered all over the street!
WTF are these people on?!!!
#sickoftheSJWcrap!
Blue moon rising!
http://www.bom.gov.au/archive/oceanography/ocean_anals/IDYOC007/IDYOC007.201904.gif
I’m sorry, but we are entering a Grand Solar Minimum, and this is par for the course. However, that will not be enough to change the planet from cooling, as during the 17th century during the Maunder Minimum.
There is no current evidence that we are entering a GSM, there is only a theory for it. Solar activity hasn’t even reached the level of the last low minimum from ’08/09. The Dalton minimum didn’t even qualify for a GSM.
What does qualify? As far as I know there is no generally accepted definition for a GSM.
The Maunder Minimum lasted from 1645-1715, with a Group Sunspot Number of 1.0, rounded to one sig digit, whereas the two Dalton Minimum solar cycles from 1798-1823 averaged 2.3, 130% higher than the Maunder. The last GSM was the Maunder Minimum.
What does qualify? (for a GSM)
Using the group number and v2 sunspot numbers from 1700 through 2015, the last year with a GN, I derived an equation, GN=0.0468*SN+0.6797. Since the MM GN average was 1.0, the equivalent v2 sunspot number equals 6.8.
A Grand Solar Minimum occurs at 6.8 to about 15 in v2 sunspot number with margin of error.
The Dalton Minimum averaged about 34 in v2, whereas solar cycle 24 averaged about 53.
The 2018 v2 sunspot number averaged 7 in yearly data, and 2019 so far is about the same.
Until we have whole solar cycles in the above defined very low range, we are safely outside of Grand Solar Minimum territory. The current popular GSM theory appears busted since cycle 25 looks to be likely similar to cycle 24, far above Dalton or Maunder minimum activity levels.
Bob Weber not true because the longest streak of spotless days in 2019 is 33 compared to 2008 (31) and 2009 (32).
I dunno about the GSM. First I want to see a cycle without sunspots before I talk about that. Maybe cycle 26.
Solar indices compared for the solar cycle 23 & 24 minima. See what I mean? PMOD TSI is too low there, and RMIB TSI is too high. SORCE hasn’t drifted as low as the last minimum, nor has there been as much time yet for it to do so compared to the SC23 minimum.
Thank you for that.
The oceanic SST anomalies in the equatorial Pacific Ocean support the emergence of a very weak El Nino event between about October 2018 and January 2019. However, as reported by the Australian Bureau of Meteorology (BOM), the atmosphere in the equatorial Pacific has not yet fully responded to the transition into a full-blown El Nino event. In addition, since late March, the upper-oceanic heat content and cloud cover in the eastern Pacific Ocean have been decreasing. Hence, the ocean is officially in a neutral ENSO state according to BOM.
I predict that a moderate to strong El Nino event will start sometime around July of this year, followed in late 2020 by a La Nina event.
Universally, all Historical EL Nino, La Nina referred is based on NOAA criteria.
Using NOAA Criteria, a full-fledged El Nino 2018-19 event has already begun at the end of March 2019 since five consecutive overlapping 3-monthly seasons have had ONI of greater than or equal to +0.5ºC. Last five ONI Index are SON 2018 +0.7ºC, OND 2018 +0.9ºC, NDJ 2019 +0.8ºC, DJF 2019 +0.8ºC and JFM 2019 +0.8ºC
A weak El Nino has exist but with a different flavor, and it is called El Nino Modoki, since Nino1.2 is not warm.
The atmospheric connection is missing. The SOI is just -1.94 (The Long Paddock).
Ashok Patel,
You might want to read the comments by Nathaniel Johnson (NOAA) over at:
https://www.climate.gov/news-features/blogs/enso/february-2019-enso-update-el-ni%C3%B1o-conditions-are-here
They are a bit dated [February 2019] but they do indicate the uncertainties associated with deciding when an El Nino event has started. Here are two quotes from the comments:
Submitted by Nathaniel. Johnson on Tue, 2019-02-19 10:36
“Hi Graig,
Just to make sure all readers are clear about this, the NOAA and BOM criteria for an El Nino are not identical (see the BOM criteria here). One of the differences is that BOM has a higher eastern tropical Pacific sea surface temperature threshold, so it is perfectly consistent for NOAA to declare borderline El Nino conditions while BOM does not.
Regarding the SOI, NOAA does not have an explicit criterion like BOM does, but NOAA forecasters certainly consider the SOI and other atmospheric indicators. As mentioned in this and previous blog posts, that was one of the main hold-ups for this event! So to answer your question, there is no specific SOI threshold used by NOAA ENSO forecasters, but forecasters examine the SOI (among other metrics, including central Pacific OLR, Equatorial SOI in different datasets, lower and upper-level winds), with a particular focus on how these metrics measure up with respect to their distribution for all previous El Nino events. (The same is true if we have a potential La Nina event.)
We make a final decision based on the preponderance of evidence.”
And
Submitted by Nathaniel. Johnson on Tue, 2019-02-19 17:17
“It is difficult to give a definitive answer to this question because El Nino types do not separate cleanly into canonical or Modoki types. As this post describes, the location of maximum sea surface temperature anomalies varies rather continuously from east to west, so there is no clear separation between the two types. With that said, and also consistent with this post, the weaker El Nino episodes tend to be centered more toward the central Pacific (Modoki-like), and this event is no exception. For researchers who study the differences between canonical and Modoki El Nino, I’m pretty confident nearly all will characterize the current event as a Modoki event. However, keep in mind that there are different methods for distinguishing ENSO “flavors,” so we cannot expect universal agreement for all cases.”
Maybe NOAA should scrap the whole theory of ENSO if they don’t want to use the Southern Oscillation Index, and call it something else. There is a reason why it is called ENSO, if the SOI is not coupled then we don’t have a fully fledged event, we have a hybrid event.
Here in Melbourne it feels like April 1982, leading into the 1982/83 El Niño. The grass everywhere is parched, when cool changes come they bring 2 or 3 mm of rain. I have no scientific knowledge, this is just my impression of what I see.
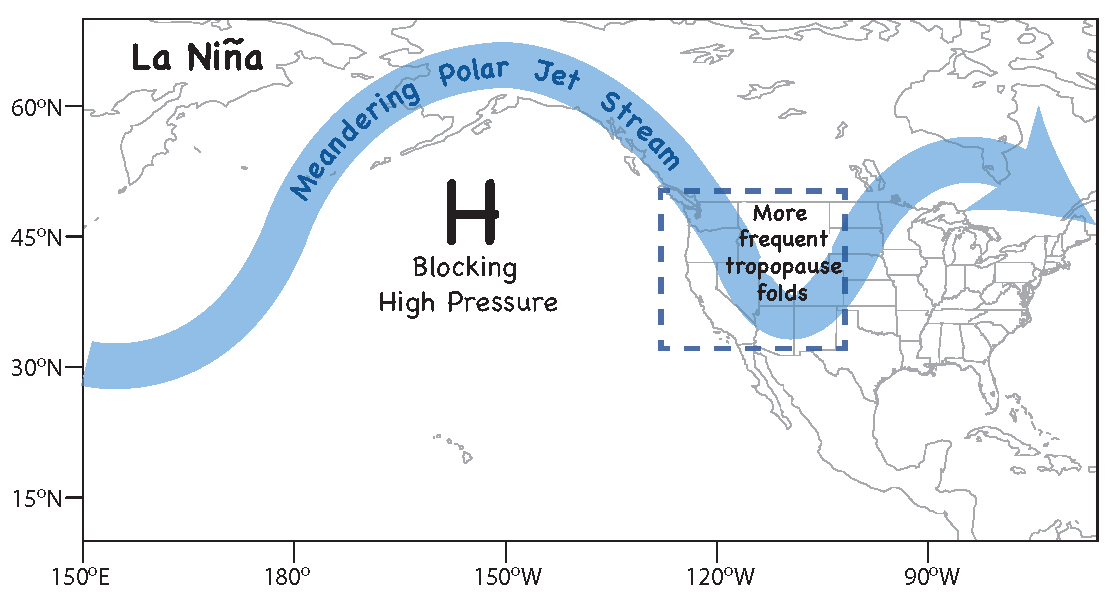
Circulation over North America.
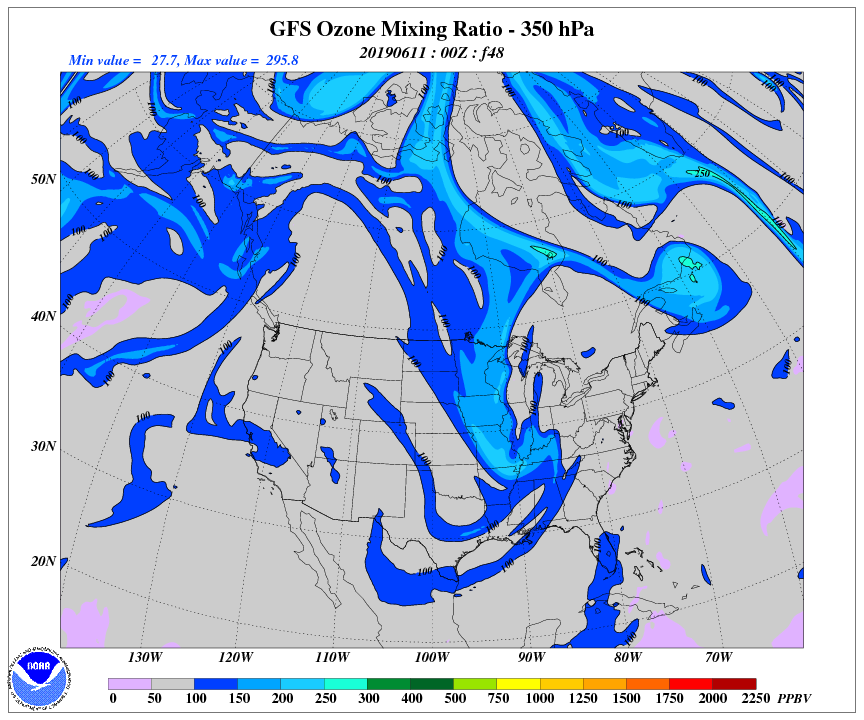
From tomorrow, heavy downpours in the Mississippi basin.
This is the circulation typical of La Nina.

And again Azores high and Iceland low have wandered from Iceland / Azores to near UK respectively Marokko.