BOB HOYE
In the 1990s, solar physicists, Penn and Livingston, called for a long decline in solar activity. This is the case and it is nice to see such work confirmed by events. Solar Cycles # 23 and 24 are the weakest since the early 1900s. The current run of consecutive Spotless Days is out to 33, or 75%, for the year.
The following table shows the record back to the minimum of Solar Cycle # 23 when the count was at 268 days, or 73%, for 2008.

So far this year, the count is out to 33 consecutive days, which is exceptional. So much so, that SILSO keeps a table of such long runs.

Solar Cycle # 24 is expected to reach its minimum by late in this year.
For hundreds of millions of years such changes in solar activity have been associated with changes from warming to cooling. And back again. The long run to the recent peak in activity was the strongest in thousands of years. Despite this, temperatures were not as warm for as long as set during the Medieval Warm Period. The end to that long trend and turn to cooling in the early 1300s was drastic, causing widespread crop failures and famine in Northern Europe and England. A book by William Rosen, “The Third Horseman” covers it thoroughly. The die-off from 1315 to 1320 is estimated at some 10 percent of the population. Deaths of cattle, sheep and horses were severe as well. All due to the turn to cold and unusually wet weather.
The change to what some are calling the Modern Minimum is significant. In geological perspective, it is now a built-in cooling force.
The next chart shows that the satellite record is again approaching the flat-lying trend, which is out to some 20 years. The El Ninos of 1998 and 2016 were distinctive weather- warming events.

NOAA’s Winter Forecast made on October 18th has been wrong on temperature and precipitation. North America has suffered a cold, snowy and lengthy winter, beyond what could be blamed upon the demon “Polar Vortex”.
Over time, diminishing solar activity has been likely to be accompanied by more cosmic rays and more cloud cover. Which would be associated with cooler and snowier winters. And possibly cooler summers, which the Danish Met Institute reported for 2018 and 2017.
 |
Hi I have made a graph of Spotless days, if you wish to use it please don’t hesitate to drop me an Email.
Regards.
David.
Nice to offer:
bobhoye@shaw.ca
As pointed out here frequently, TSI does not have the variability to explain a solar cycle effect on climate.
A more reliable metric to understand any claims of a Grand Minimum in solar magnetic activity may be the F10.7 record. The F10.7 flux record is a direct proxy of the UV/EUV flux from the magnetically super-heated corona. And if there is a solar cycle/Grand Minimum impact on climate, it must assuredly come from some component that does vary a lot between solar max and solar min, and that is UV/EUV.
The big limitation is the instrumental record of F10.7 only goes back to 1947. Direct UV/EUV power spectrum measurements were not possible until the satellite era got us to the point where quality, calibrated-instruments could be placed outside Earth’s UV/EUV shielding atmosphere.
Leif of course did a proxy reconstruction of F10.7 by to the 18th Century using the geomagnetic imprint that diurnal EUV heating leaves on the recorded geomagnetic field strength (at a given ground measurement location. He has posted on that subjected here at WUWT many times in recent years.
Leif has also written about “the microwave flux is controlled directly by the magnetic field without a complicated intermediate physical process.” here:
http://hmi.stanford.edu/hminuggets/?p=1510
For the SC23-24 minimum in 2008-2009, we basically saw an F10.7 flat-lined below 68 (60day moving average) for ~ 9 months from mid-June 2008 to mid-March 2009.
Currently we are at SC24-(awaiting)SC25 minimum, but nothing comparable yet as far as F10.7 minimum.
See here for the data plot:
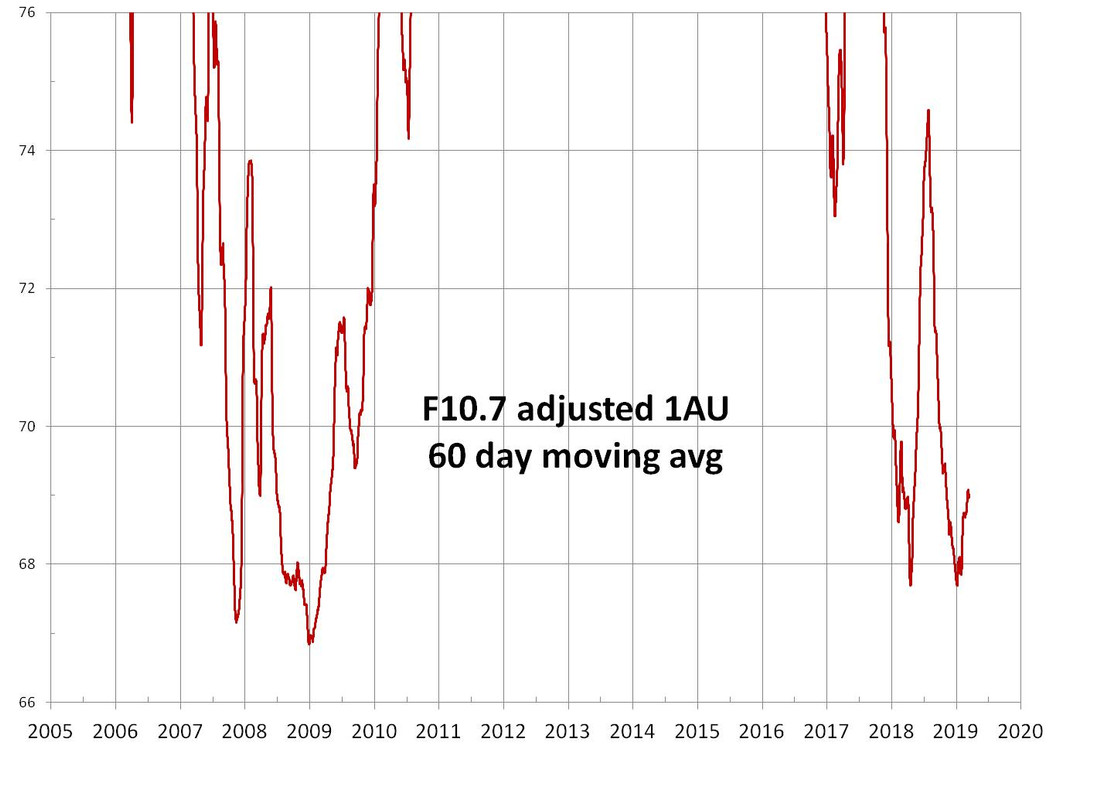
So if we are entering a Grand Minimum, I would expect to see at least a comparable sub-68 F10.7 60 day average starting soon running for 6-12 months. And lasting through the end of year 2019, maybe into 2020. But if SC25 gets going in the next few months though as some solar experts expect, no Grand Minimum.
Joel O’Bryan
For you too: the following graph contradicts your assumption that SSN would be less valuable than F10.7:
https://drive.google.com/file/d/1ShXgzae4Fr_fOs9kWJiSzD8yXkcewQZY/view
Please do yourself the comparison…
Sources
SSN: http://www.sidc.be/silso/DATA/SN_m_tot_V2.0.txt
F10.7: http://lasp.colorado.edu/lisird/data/noaa_radio_flux/
Your plots contradict nothing.
If there is any climate connection to the solar cycle it exists in the UV/EUV flux modulation by cycle magnetic activity. UV/EUV may be having outsize (non-linear) effects such as ozone creation rates or something else entirely. We simply do not have global stratospheric ozone records before Nimbus 4 satellite went up in 1970.
You manifestly overlooked the own comment:
“A more reliable metric to understand any claims of a Grand Minimum in solar magnetic activity may be the F10.7 record. The F10.7 flux record is a direct proxy of the UV/EUV flux from the magnetically super-heated corona.”
This was the reason for my reply, and nothing else.
F10.7 is a better single measure, a direct read of the sun’s magnetic state heating its corona. No question. It’s reads a state of the Sun’s entire magnetic state, pole to pole. No messiness of Wolf counts, international counts, different optical systems, or different eyes with a simple microwave flux reading.
Our sunspot counts only count spots on the visible face, the side facing Earth. And even then then there is difficulty with gauging size and number of individual spots near the limb rotating into or out of view from SDO’s L1 position. Stereo-A can see the “left-side” approaching Earth-view now, somewhat around to the back-side rotating toward Earth. But Stereo has lower res UV imagery than SDO and no magnetic instrument (like HMI on SDO), and it would not be compatible with historically how spots have always been counted. Plus Stereo-B’s failure means we don’t see about 1/3 of the sun surface at any given instant (the part of the sun that is just rotated out of view is currently not imaged).
Where is Stereo Now? From GSFC.
https://stereo-ssc.nascom.nasa.gov/where.shtml
https://stereo-ssc.nascom.nasa.gov/where.shtml
Thanks for the interesting information.
I want to give here a very, very important remark: The 10.7 data ARE NOT ADJUSTED FOR SOLAR FLARES. Meaning there are a lot of WRONG data in it!
You can find my explanation here:
https://www.researchgate.net/publication/331063430_A_Formula_for_the_Start_of_a_New_Sunspot_Cycle
with also the link to a Russian website with the right 10.7 data!
Mods?
Kristina Morris March 7, 2019 at 2:27 pm
I don’t agree to what Bob Hoye wants to explain us here.
The US country actually experiences cooling, that is undeniable. The 10 lowest yearly averages all are within the last 30 years :
1993 9.6
1996 9.9
1997 10.1
2008 10.2
2013 10.2
1989 10.2
2009 10.2
1995 10.3
2014 10.3
1994 10.4
…
2018 10.7
But in this yearly average ranking, we observe an increase, and 2018 appears at position 19, and not at position 2 or 3.
And above all, I have some difficulty to see any valuable correleation between CONUS’ absolute temperatures and SSN during the last 120 years:
https://drive.google.com/file/d/1uyENSKnuCTQi7WspH3XPBzbBQtxVKfDm/view
Ironically, the lack of correlation becomes even more evident to me when we restrict CONUS’ absolute temperatures to the Dec/Jan/Feb periods:
https://drive.google.com/file/d/1P3PUL9o-JTAN0vMwS8HleQjV6FwWaDbf/view
I am waiting for the polar field update…
According to my findings the UNFILTERED polar field strength should have gone up in February….
This is the reason there are no sunspots and that we will have A MUCH LARGER SUNSPOT CYCLE THEN EXPECTED.
Last mean strength was 66, meaning cycle 25 will be already 10 percent above the first part of cycle 24…
Explanation here:
https://www.researchgate.net/publication/328653713_The_Sun's_Adjusted_Polar_Fields_are_in_Phase_and_not_in_Anti-Phase
and here:
https://www.researchgate.net/publication/330441356_Research_Polar_Fields
Leif… I am waiting…
Your Polar field update:
http://wso.stanford.edu/gifs/Polar.gif
Solar Dipole and Multipole Components
http://wso.stanford.edu/gifs/Dipall.gif
Equatorial dipole has the greatest effect on geomagnetic activity.
Of the last 60 years, only 6 months have had a lower average sunspot number than this last February 2019, and 4 of them were in the previous minimum of 2008-2009.
Galactic radiation begins to grow again.

Will it rise to the level from 2009?
March will be cold in the west of the US.
In March, ice in the central Arctic looks very good.
http://masie_web.apps.nsidc.org/pub/DATASETS/NOAA/G02186/plots/4km/r11_Central_Arctic_ts_4km.png
Low over Utah it will develop into a dangerous snowstorm.

Why North America has severe winters during periods of very low solar activity?
Please read with my comments, ren.
https://co2islife.wordpress.com/2019/03/02/hockeystick-con-job-co2-cant-cause-temperature-dog-legs/?fbclid=IwAR3No5sxxT2yxsKiDFxTIUYTXMxvCrSq7-UGASh3Xt3k6TfLVpg1vAdYseQ
Considering the MSM have a lot to answer for in promoting the AGW scam it’s rather apposite the acronym for the Modern Solar Minimum.
Climate charlatans’ spurious narratives aside, despite atmospheric CO2 up 30.2% to 405 ppm from 1950, given post-Chixculub Cretaceous/Tertiary (K/T Boundary) eras’ mean 12 – 16 million-year duration, Earth’s astro-geophysical inflected cooling pattern should persist another 12 – 14 million years.
Per median 12,250-year interstadials such as the Holocene Interglacial Epoch beginning 14,400 YBP, plus periodic plate-tectonic Ice Ages over 3.6 million years, Earth’s latest glacial remission ended 12,250 + 3,500 – 14,400 = AD 1350 with a 500-year Little Ice Age (LIA) through AD 1850/1890, followed by a 140-year “amplitude compression” rebound through AD 2030 (amplitude extremes are inversely proportional to a time-series’ frequency and wavelength).
As this final 20-year chill phase shades to a 70-year Grand Solar Minimum through 2100+, similar to that of AD 1645 – 1715, reduced Total Solar Irradiance (TSI) renders generational warming physically impossible in face of cyclical 102-kiloyear Pleistocene glaciations beginning 669 years back.
Regarding Industrial Revolution “anthropogenic CO2 emissions” from c. 1725, Australian researcher Robert Holmes definitively showed in December 2017 that all planets in Earth’s solar system exhibit global atmospheric surface temperatures (GAST) = PM/Rp, setting Atmospheric Pressure P times Mean Molar Mass M over its Gas Constant R times Atmospheric Density p. Applying this relation from Mercury through Neptune, zero error-margins attest that there is no empirical or mathematical basis for any “forced” carbon-accumulation factor (CO2) affecting temperatures on Planet Earth.
Cyclical reality bites deep: First, Earth’s Holocene Interglacial Epoch ended the Medieval Warm in AD 1350, beginning a 500-year, carbon-neutral Little Ice Age through 1850/1890. Second, the current 140-year rebound from this LIA is ending with a fiercely chill “dead sun” absence of cyclic sunspots, due to persist 70 years to AD 2100+. Third, coinciding with an overdue Magnetic Pole Reversal stripping away Earth’s “plasma sheath” shielding cosmic rays, radical declines in total solar irradiance (TSI) presage recurrent 102-kiloyear Pleistocene ice sheets covering 70% of Earth’s habitable landmasses with ice sheets 2.5 miles thick.
As brutal chill grips Earth’s 3.7 billion naïvely lulled inhabitants, Luddite sociopaths sabotaging global energy economies will have mega-deaths to answer for.
An interesting article
The Impact of the Revised Sunspot Record on Solar Irradiance Reconstructions
G. Kopp, N. Krivova, C.J. Wu, J. Lean (2016)
https://arxiv.org/pdf/1601.05397.pdf
” We estimate the effects of the new SILSO record on two widely used TSI reconstructions, namely the NRLTSI2 and the SATIRE models.
We find that the SILSO record has little effect on either model after 1885 but leads to greater amplitude solar-cycle fluctuations in TSI reconstructions prior, suggesting many 18th and 19th century cycles could be similar in amplitude to those of the current Modern Maximum.
TSI records based on the revised sunspot data do not suggest a significant change in Maunder Minimum TSI values, and comparing that era to the present we find only very small potential differences in estimated solar contributions to climate with this new sunspot record. ”
This confirms Leif Svalgaard’s statement above concerning SILSO’s accuracy.
A detail: TSI forcing calculated by the reconstruction models since Maunder’s end accounts for about 10 % of the 0.8 °C increase estimated for that period.
Colorado is facing potentially historic avalanches, threatening to shut down major highways that pass through the Rocky Mountains and forcing some popular ski resorts to close their slopes.
“During Saturday night to Sunday morning, the storm will likely be at its strongest with windswept snow from the Dakotas and northern Nebraska to much of Minnesota, northern Wisconsin and part of northern Michigan,” Sosnowski said. “Strengthening winds will greatly lower the visibility and cause extensive blowing and drifting snow, especially at the tail end of the storm and even as the sky begins to clear.”
Wind gusts can exceed 50 mph, threatening to topple high-profile vehicles and leading to power outages and property damage. These winds will also limit the effectiveness of snow plowing, since new drifts can quickly obscure roadways.
The peak of solar magnetic activity in 2015 enabled the development of a very strong El Niño.
http://wso.stanford.edu/gifs/Dipall.gif
The high geomagnetic activity favors the latitudinal circulation.
The graphic shows how index 3.4 El Niño in 2015 rose.

The ice cover on the Great Lakes reached 80%.

Dear Moderators: this comment by Kristina Morris is spam.
I just completed an analysis for the February 2019 at Victoria British Columbia and found that February 2019 was the second coldest on record. This was quite a remarkable change from the previous months of this winter (El Nino or otherwise). Also, the maximum amount of snow as measured on the ground, over 46 cms. has never been exceeded in any other February since records at Victoria International began going back to 1941. So it may be concluded that February 2019 was a very significant winter for us on the normally mild west coast.