Solar Cycle 24 has had the lowest solar activity since the Dalton Minimum around 1810.
By Frank Bosse and Fritz Vahrenholt, No Tricks Zone
Our sun was also very sub-normally active in December last year. We are writing the 121st month since the beginning of cycle number 24, in December 2008, and since 2012 we could only reformulate the opening sentence once: In September 2017 when the sun was 13% more active than the long-term (since 1755) average.
All other months were below average. With the sunspot number (SSN) of 3.1 for the monthly average for December and a total of 24 days without any spot (throughout the second half of the month the sun was spotless) we are in the middle of the cycle minimum.

Fig. 1: Solar Cycle 24 – red – is almost over. Since October 2017 (cycle month 108) we have been at the minimum and the next cycle should start at the beginning of 2020. The blue curve is the respective monthly average over the 23 cycles completed so far. The black curve (for comparison) SC 5, which was recorded around 1815 and was as similarly weak as the current cycle.
The following chart compares all the cycles observed thus far:

Fig. 2: The sunspot activity of our sun since cycle 1 (1755). The numbers are calculated by adding the monthly differences with respect to the mean (blue in Fig.1) up to the current cycle month 121.
Clearly SC 24 is the lowest activity since the Dalton Minimum (SC 5,6,7) around 1810 when using the entire cycle and not only the maximum activity in short peaks (see Fig. 1).
Discover more from Watts Up With That?
Subscribe to get the latest posts sent to your email.
Just as I criticize the “global warming” crowd for jumping to conclusions, so I would caution the “global cooling has already started” crowd. Climate is very complex and I at least, do not claim to understand all its nuances. It does the skeptics no good if they jump to a conclusion that is soon falsified.
Instead, lets take a wait-and-see approach to gather data while this event unfolds. I for one would be surprised if any definitive measurable cooling started before about 2022 or so, because I agree with some commenters that there should be a lag – assuming there is a cooling event at all.
If we skeptics have survived for 30 years fighting the pseudo-science called global warming, we can survive another 4 or 5. Remember, even if it does continue to warm, its only the RATE that need alarm anyone. If the rate remains constant (or falls), then CO2 is NOT an issue. (If only there were some quality control on the data that anyone trusted – its just too easy for the global warming crowd to adjust the data)
Robert of Texas February 3, 2019 at 7:04 pm
Thanks, Robert, well stated.
w.
Upper atmosphere collapse 2010 could add some lag too.
https://science.nasa.gov/science-news/science-at-nasa/2010/15jul_thermosphere
that hot stuff up top got closer to the surface.
I worked out the spreadsheet of central England temperature record of 1750 up to 2018, calculated temp anomaly off the mean for each month, and graphed that to sunspot record also for same time period. Uh, I don’t see any trend of sun spots and temperature anomaly. Using anomaly off a mean erases the annual temperature seasonal cycling, and still shows nothing. Since sun spots go to zero count every 11 years, it is really a low maxima that is being pitched as related to global mean temperature because we don’t have Ice Ages every 11 years. That is on a 60 or so year cycle that is something else.
You are not going to find anything that way. It has been done thousands of times with identical result.
Let’s say that the sun changes the earth mode to warming or cooling when it crosses a certain threshold of activity. Let’s say it does it only during winter, and only when the atmosphere is in a certain state, as it is affected by the Quasibiennial Oscillation, and strong ENSO, and strong volcanoes. So it happens on certain years but not others. The effect is probabilistic, not deterministic. Let’s say the effect has a lag of 3-4 years to maximum effect in global temperature.
As the solar cycle evolves, on a normal to active cycle the sun will start warming the planet a little every year. By the time the effect is building up to maximum, after 5 years, solar activity declines and starts to detract from the effect. The effect over one solar cycle becomes very small. Half of the time it works in one direction and the other half in the opposite, and as the effect is lagged and probabilistic it gives a very small signal hidden in the noise. Superficial people stop looking and say it is not the sun.
But from cycle to cycle that small change can accumulate towards cooling or warming. If two strong cycles follow, at the end of the second the planet will have warmed with respect to the beginning of the first. If the sun has seven above average solar cycles one after the other, a Modern Maximum, you have an important contribution to global warming.
The relationship between long-term solar activity is not to temperature, but to temperature change, as it is obvious. If a cycle is less active than the previous but still more active than the average, you still get warming, not cooling. Superficial people will say that a decrease in activity produces an increase in temperature.
Now comes a cycle with very low activity. What happens is that during its maximum phase it adds little, so the warming of the planet stops. A big El Niño might distract, but there is cooling afterwards. A significant 3-year cooling that has not been seen in a long time. If a second low activity cycle comes afterwards, the effect will accumulate, the lag will make it stronger, and the temperature will decrease. Not drastically. The level of activity sets the direction of the temperature change, not the final result. It is silly to expect that one cycle with the level of activity of the Dalton Minimum after two centuries of warming should result in a temperature comparable to the Dalton Minimum. Some people do not really think about how things work.
The lowest solar cycle in 200 years has produced a change of direction in temperature change, from warming to no warming. That is a huge unexpected result. If we get another below average solar cycle, as it looks, we will see some cooling, indicating that the solar effect on climate is bigger than the CO2 effect.
Much irrelevant and inaccurate waffle Javier, December 2010 was the second coldest in CET, the cold of March 2013 was exceeded only twice in Maunder, not once in Dalton, and once in the Gleissberg minimum, despite 130 years of global warming.
UK temperature anomalies are largely driven by short term (~weekly) solar effects on the NAO/AO, and at the scale of sunspot cycles, they shift in and out phase with sunspot cycles:

As does the AMO, but the inverse of UK temperatures:
=www.woodfortrees.org/graph/esrl-amo/from:1870/mean:9/plot/sidc-ssn/from:1870/normalise
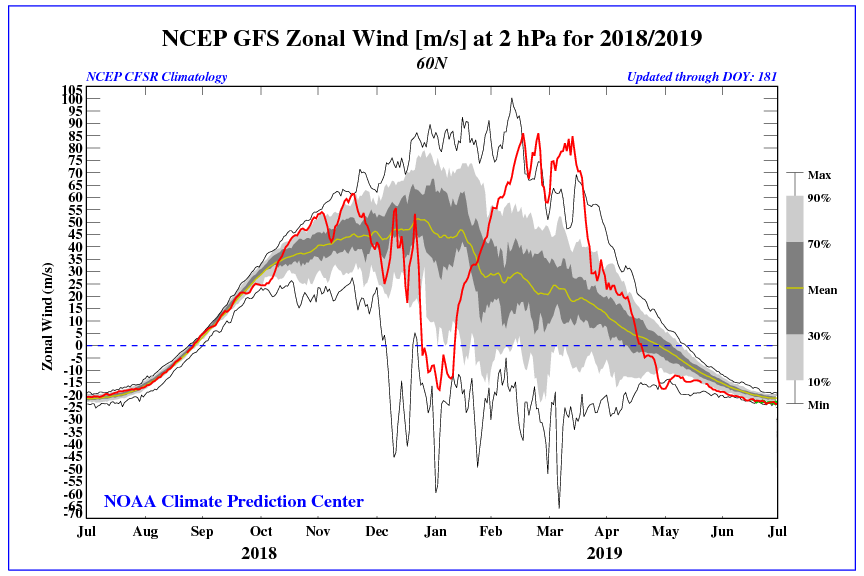
Geomagnetic activity increased. The polar vortex in the upper stratosphere strongly accelerates.
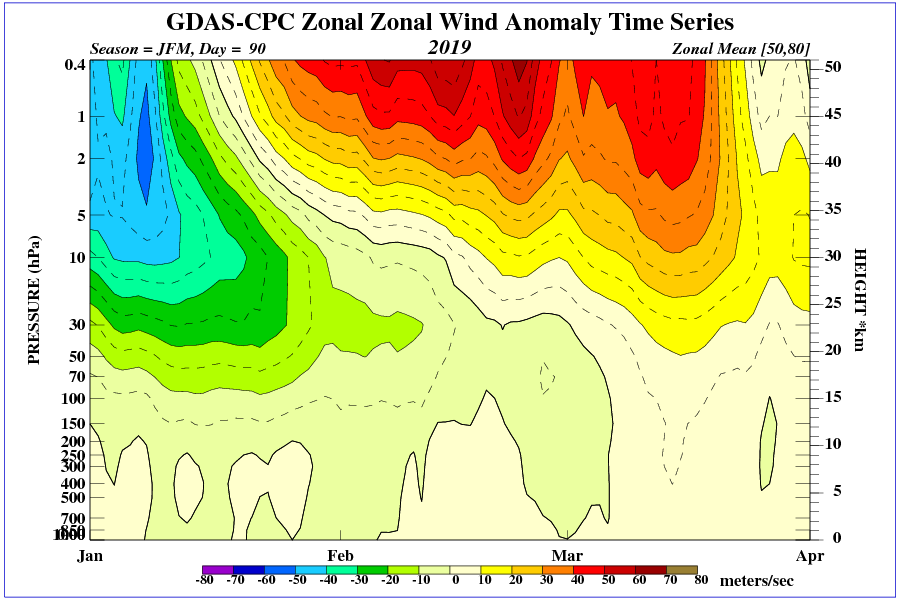
The velocity of the polar vortex has risen the most at the top of the stratosphere.
There are unhomogenized(raw) temperature data and there are homogenized, (“tweaked”?) data.
What are the results when solar activity is compared with these different datasets? Which dataset mirrors solar activity data better?
Sunspot numbers for January just updated.
It’s gonna be a long minimum between the cycles (24/25). I stick to my prediction – minimum centered earliest in the late 2020, maybe even later.
20-year trend (hadcrut4) flat around 2023-25, 30-trend around 2030.
And I am sticking to my projection that the solar minimum will be this month.
https://wattsupwiththat.com/2018/06/07/the-approaching-solar-cycle-24-minimum/
Obviously we won’t know until the summer is past.
That’s way too early Javier. There is no sign of significant sc 25 activity. Yes, there was maybe a spot or two with the right polarity and latitude, but it can (and usually does) take years for the new butterfly to start forming. Furthermore, weak cycles are usually long.
http://solarcyclescience.com/bin/bfly.jpg
http://solarcyclescience.com/bin/magbfly.png
That is not how the solar minimum is defined. January had the most sunspots since August. This ain’t going any lower. The sun appears to care not for what is usual.
This is a prediction (timing, I don’t really care about size) I agree with:
http://solarcyclescience.com/Predictions/Cycle25_Prediction.png
“…Cycle 25 will be similar in size to (or slightly smaller than) the current small cycle, Cycle 24. Small cycles, like Cycle 24, start late and leave behind long cycles with deep extended minima. Therefore, we expect a similar deep, extended minimum for the Cycle 24/25 minimum in 2020.”
Javier, maybe I wasn’t clear. I know how the minimum is defined, but before the minimum the next cycle needs to start its activity. After the minimum the old cycle slowly dies. There is always an overlap. The small peak in January was all sc24 spots. It is going lower and the minimum will be extended and deep. And there will be more small peaks during the minimum.

The El Nino that you predict for after the minimum (at the ramp up of the new cycle) will form around 2022/23. Before that, a big fat La Nina.
Edim,
SC24 and SC25 sunspots overlap over many years. IIRC the first SC25 sunspot was in 2016.
Everything appears to indicate SC24-SC25 minimum belongs to the intermediate-length group, and this group has the minimum 19-35 months after the last month with >30 monthly smoothed sunspots. That window corresponds to May 2018-September 2019.
Already 28 months after >30 monthly smoothed sunspots, the minimum will not wait as long as you think. I might be wrong for a few months (I hope not), but the drop in sunspots is too fast for this minimum to be a long one. It would be an outlier. Not impossible but unlikely.
In any case by late 2019 we will know who was right.
Javier, I agree that by late 2019 we will know more. Just one more comment, how I see it.
Whether a sunspot or an active region belongs to old or new cycle is somewhat arbitrary. The butterflies are fuzzy. Even if both polarity and latitude are correct, the sunspot may be too small, not visible, disappear too quickly, doesn’t get an official noaa AR number or just is located “clearly” outside/between the butterflies.
”During each solar cycle, about 3% of all active regions have a reversed polarity (and do not belong to the previous or next solar cycle). This percentage varies somewhat from one solar cycle to the next. With 2000 to 3000 sunspot groups per solar cycle, this means nonetheless that every solar cycle has a few dozens of this kind of bad boys.”
http://www.stce.be/news/436/welcome.html
“While smaller spots with the correct polarity alignment of cycle 25 regions have been observed at high latitude locations as early as 2016, this overview will only include spots large enough to have been visible at a 1K resolution.”
http://www.solen.info/solar/cycle25_spots.html
“While the number of regions is low so close to the solar minimum, SC25 sunspot regions will gradually become more numerous than the SC24 regions. The cycle minimum usually occurs within just a few months of this “break-even”.”
http://www.stce.be/news/422/welcome.html
My point is that this “break-even” od not near, simply because there is much more activity belonging to sc24 than 25. Sc25 is almost negligible so far. The January peak in activity is clearly all sc24 and that pushes the minimum even further.
Edim,
I understand what you say. However two things prevent me from paying much attention to the magnetic polarity of sunspots.
First, I don’t know of any place where I can get that data easily. I am not willing to check the daily sunspot data from NOAA to find out. I don’t care that much about sunspots.
Second, I don’t have past data on sunspots polarity to confirm that the solar minimum can be well defined by it.
When projecting it is important to stick to a method that has worked well in the past or works well in hindcast, until there is evidence that the method is unreliable.
SC23-24 had a very slow descent in sunspot number that presaged a long minimum. SC24-25 has had a much faster descent that presages a shorter minimum.
I wrote my projection in a WUWT article in June 2018, and in these eight months the evolution of sunspots has followed the guidelines outlined in the article. Feb 2019 is still my central date. If I get it within ±6 months I will think I have done well. If I get it within ±3 months I will think I have done very well. Getting the right month is just luck.
If you are correct and the minimum comes in the second half of 2020 or later, I’ll have 10 years to get a better method for the next one. My method would have shown no value.
When projecting it is important to stick to a method that has worked well in the past or works well in hindcast
Except that ‘your’ method has not been shown to work well in the past.
SC20 comes to mind.
With my correlations I get minimum by mid 2020 at the earliest, possibly as late as Spring 2021, and SC25 double peaking in 2025 and 2027.
I think all the January sunspots clearly belong to the ‘old’ cycle (low latitude).
Willis
If you make the same errors everytime,
i.e.
no equal amounts of stations nh/sh,
data sets not properly balanced to zero latitude nh /sh,
uah and rss re-calibrated /adjusted on the same eroneous terrestrial data sets,
etc.
you will always get the same results,
i.e. it is warming….
Truth is that I could not find any man made warming, global or otherwise… Everything is following natural curves. There are periods of cooling and warming on earth.
We should be happy with a period of warming as cooling has proved to be quite disastrous in the past, e.g. think of the little ice age, never mind the last ice age.
Ice has been melting for the past 20000 years and we should celebrate it, not be afraid of it.
Anyway, by my own measurements, it is not really warming anymore, more especially it is in fact not warming at all here in South Africa where I live. I find it is just as warm now here as it was 40 years ago.
So much for your ‘global’ warming.
As to why the devil wants all the lies to continue? I have my suspicions. For anyone interested, I suggest to please read everything I reported on this?
http://breadonthewater.co.za/henrys-climate/
Looks to me like ENSO might be contributing to some of the recent warming.
Woke up to a bit of sun this morning after rain all night long. It is cold out though. Clouds then cam overhead and it started to snow at 10 this morning. Temps are supposed to drop close to 20 F tonight, and tomorrow. Then at least a week of below freezing temps lay ahead for the area. Winter is coming full force again to the Pacific Northwest.
Now it is full out snowing ans sticking at 1 pm.
Major decadadal changes in regional temperature are casud by the major natural variability events as AMO, PDO, ENSO etc, and effect might vary from one region to next depending on proximity, atmospheric and oceanic circulation etc.
If there is a long term (centenary scale) solar variability than it should be globaly uniform.
Looking at last 3-4 cycles it may not show the effect which may be a bit greater than 0C as expected by Dr Svalgaard, but much smaller than the last century global temperature data implies.
Let’s take Svalgaard’s rise of 0.1C/cycle, and assume that a smal bit about 1/5 th of it or about 0.02C is retained by oceans’ absorption.
There are about 30 solar cycles since 1700 (maters not much, rising, falling or all cycles are equal, as long as there are cycles there) this would meant that the temperature rise due to solar activity since 1700 should be about 0.6C .
Surprise, surprise, that is exactly what happened with the CET since 1690.
http://www.vukcevic.co.uk/CET1690-1960.htm
Sun has an effect but it is small, and since 1900 may be in total no more than about 0.2C.
These tiny rises may accumulate until another Maunder type minimum when most of it if not more, will be lost.
Since I assumed a loss (during 3-4 years between two cycles when they are near minimum) of about 0.08C, this would meant loss of up to 1.2C or even more during a 50 year Maunder strength minimum.
Ergo: don’t concern yourself with 1C future rise but be prepared for 1C fall (+ any unknown effect on AMO, PDO or elNino) during the next Maunder minimum whenever it comes.
(Apologies for any typos, typed on a hand held, editing is no go)
P.s. it is doubtful that any spectral analysis might detect 0.02C/cycle in either global or any regional temperature data.
Leif,
Slightly off topic but, you referenced the 10.7 flux earlier. Am I correct that this is a better proxy for the level of solar activity than the sunspot number? Particularly when the number of sun spots is a function of the observer.
Keep up the good work, I find these playground arguments to be entertaining and informative.
Am I correct that this is a better proxy for the level of solar activity than the sunspot number?
The various solar indices do not all refer to the exact same physical situations so are expected to be slightly different. On the other hand they all depend on the magnetic flux in the sun’s atmosphere so are strongly correlated. The F10.7 flux is a good index for the magnetic field in the lower corona, while the sunspot number is a good index for the magnetic field in the photosphere [or just below] which we have measured back into the 1960s. We can scale the sunspot number to F10.7 [and vice versa]. F10.7 only goes back to 1947, although a proxy for F10.7 [the diurnal variation of the geomagnetic field] goes back to the 1740s. The sunspot number goes back to 1609, and the cosmic ray proxies [Beryllium 10 and Carbon 14] go back at least 9,000 years. Ongoing research aims to reconcile all those varies indices and the end may not be in sight yet, although great strides have been made in the last 15 years.
Paul
In one of my replies to Javier somewhere upthread, there is a comparison of two time series
– the Sun Spot Number
– the Solar Flux evaluation based on the 10.7 cm frequency.
Sources:
– SSN: http://www.sidc.be/silso/DATA/SN_m_tot_V2.0.txt
– F10.7: http://lasp.colorado.edu/lisird/latis/noaa_radio_flux.txt?&time%3E=1947-02-14T00:00:00.000Z&time%3C=2019-02-04T18:54:00.000Z
Both were restricted to the period 1948-2017 (in which Colorado’s F10.7 series gives complete data).
Since their value ranges differ, the two series were converted to percentiles.
Here is their comparison:
https://drive.google.com/file/d/1ShXgzae4Fr_fOs9kWJiSzD8yXkcewQZY/view
Both data and their 3rd order polynomials give a pretty good fit.
The Zeller-Nikolov climate discovery: Carbon dioxide has no measurable effect on planetary temperature
https://www.sott.net/article/404389-The-Zeller-Nikolov-climate-discovery-Carbon-dioxide-has-no-measurable-effect-on-planetary-temperature
I’ll try again.
The Zeller-Nikolov climate discovery: Carbon dioxide has no measurable effect on planetary temperature
https://www.sott.net/article/404389-The-Zeller-Nikolov-climate-discovery-Carbon-dioxide-has-no-measurable-effect-on-planetary-temperature
And why it’s bollocks ….
https://wattsupwiththat.com/2018/12/31/giving-credit-to-willis-eschenbach-for-setting-the-nikolov-zeller-silliness-straight/
Must say:
there is no man made global warming.
I could not find it.
Click on my name to see my method.
When I see TSI thrown about, it worries me.
My question is, where can I find models that take into account a reality that energy is significantly stored by a number of means in the ocean lets say, then released at times by a number of means, so how could any correct model try to just correlate storage and release based on any single input mechanism?
Isn’t TSI just mashing all elements together and obscuring the effects specific variances in certain elements would have on say cloud formation or energy penetration depth in water etc?
If certain elements overall caused more insulative or more reflective cloud cover for periods of time, wouldn’t that alter the effectiveness of systems like El Nino/La Nina in storing/releasing oceanic energy in a world where people only seem to try to measure and report on surface temperatures?
This type of energy storage and release would not easily correlate to obvious cycles like solar cycles instead they would need to appear maybe like an increase in potential difference stored to later increase warming from the release of energy cycles.
These are just some thoughts from reading here, maybe someone can rephrase what I am saying to make it more understandable.
res
TSI did not work for me trying to correlate it to anything.
I later realized what the problem was/
The energy that we get from the sun has a chi-square distribution. The problem is that although the y is pretty constant the x can change depending on the specific solar cycles that we are in (do you know all of them? click on my name to figure it out), moving the whole distribution to the left or to the right. Essentially this leaves the area under the distribution the same, i.e. TSI does not change much either way. However, the amount of the most energetic particles that can escape from the sun due to the specific solar magnetic field strength can vary significantly.
Our atmosphere was designed to prevent us from harm by the most damaging particles coming from the sun. Hence, my advice not to go and live on Mars before you have created an earth-like atmosphere.
What happens is that the most energetic particles coming into our atmosphere are caught up by the oxygen, nitrogen and OH radicals forming ozone, N-oxides and peroxides, respectively. In its turn, more of these substances in the upper atmosphere, in the case of very low solar magnetic field strengths, such as now, will prevent certain UV radiation reaching the oceans. In the water, due to its specific properties, all UV is eventually changed into heat.
It follows that if less UV reaches the oceans,
,,,this is what causes global cooling, mostly….
e.g try correlating the solar polar magnetic field strengths with ozone? Do you see the correlation?
but yes, there may be more factors, especially the greening of the waters & earth…it does trap heat.
….I suppose my contribution here is just Global Cooling 101, i.e. the main reason for global cooling
res & henryp have interesting yet so far poorly explored thoughts. Someday, perhaps, we’ll know. First, though, we’ll have to get honest about our state of climate ignorance.
============================================================
kim
there aren’t really too many issues in climate science that I have not yet explored/
for example,
in Las Vegas, where they have changed a desert into an oasis over the past 40 years, I find minimum T sharply rising.
OTOH
in Tandil, Argentinia, where they chopped all the trees in the past 40 years for wood, & paper & stuff, I find minimum T sharply declining.
In effect we could say that the greening of earth – that everyone wants and that is happening due to mankind wanting lawns, trees and crops…-actually causes warming….
Something similar might also be happening inside the oceans. Due to the delay by some of us predicting real global cooling, as per the relevant SC, I am beginning to suspect that the waste that we are putting into the oceans might indeed cause more algae / bug growths that retain\ a lot of heat.
I used to work in a plant where I battled with bug growths inside the cooling towers. Had I realized what I know now I would have had a simple solution to the problem. However, to apply same solution inside the oceans is another matter….
Must say to res:
I forgot to mention that when UV hits onto the top molecular layers of the water, it converts a lot to H20 (g) immediately because that radiation is so much energetic. So, less UV coming into earth also means less clouds, meaning less rain…apart from other reasons also causing less clouds available to spread to the higher latitudes. Hence, the droughts that will be hitting the nh at the higher lats – just about starting this year or next year
irrespective of how much greening and subsequent warming of earth there has been…
Click on my name to read my reports.
Thanks @HenryP your responses and website are very interesting and informative.
The more I know is the more I know I don’t know. What of this cycle some have mentioned with 650 years of cooling followed by 350 or so of warming? Is there anything to that?
res
I am not sure about that cyle that you mention but it seems you could be referring to the 1000 years Eddy cycle?
We are indeed sure it was warmer in Greenland a thousand year ago then it is now.
e.g. https://wattsupwiththat.com/2019/02/07/study-shows-that-vikings-enjoyed-a-warmer-greenland/
As to the mechanism of the Eddy cycle I strongly suspect it has to do with what I call the magnetic stirrer effect.
It is simply that earth’s inner core – which consists of hot molten iron – re-aligns with the magnetic field of the sun. This apparently also means a slight shift in energy from earth itself, affecting Tmin, more from the south to north. This is also a reasonable explanation for my own results – which show a decrease in Tmin in the SH whilst in the NH Tmin was still rising [the last time I looked].
Or perhaps, if Javier has another explanation for the Eddy cycle?
Interestingly, one of my forefathers, Willem Barentz, went looking for a passage to the east via the north. He must have read this somewhere from ancient Norse writings. Sadly, he and crew died trying to find the passage. Hence, we still have the Barentz Sea, there in the Arctic/. So, there is strong anecdotal evidence that a thousand years ago, the arctic was largely icefree, or almost icefree, or just like it is now. Willem would not have risked his own life and that of his crew unless he was sure about that passage.
Funny, how the world changes in 500 years….meaning we now don’t want that passage to the east via the north….how dumb is that?
So, anyway, not to worry when you see less ice in the arctic.
We have been there, done all that.
BW
Henry
Hi Leif
I am getting funny messages about ‘internet safety issues” just going to leif.org
are you aware of this?
Is there perhaps an update to the graph above? That would be great.
@ur momisugly res
you can draw a bi-nomials from the top to the bottom and from the bottom to the top representing the average solar polar magnetic field strengths
use https://leif.org/research