Sheldon Walker – (agree-to-disagree.com)
The slowdown/pause/hiatus, would probably be only a dim memory, if Alarmists didn’t keep digging up the imaginary corpse, in order to show that it really is dead.
The website called “The Conversation”, recently featured an article called “Global warming ‘hiatus’ is the climate change myth that refuses to die”, by Stephan Lewandowsky and Kevin Cowtan.
It was dated “December 20, 2018”, and the web address is:
https://theconversation.com/global-warming-hiatus-is-the-climate-change-myth-that-refuses-to-die-108524
Both of the authors have also recently co-authored 2 scientific papers, with a large number of other well-known Alarmists (they now write scientific papers in “gangs”, to show how tough they are). The 2 scientific papers claim to “demonstrate convincingly that the slowdown/pause/hiatus wasn’t a real phenomenon”.
It is rare to find a “scientific” article, which features so much “woolly-headed” thinking. And so much misdirection.
It starts badly. Just reading the first 2 paragraphs made me annoyed. They used the word “denier” in the first sentence, and the phrase “science-denying” in the second paragraph.
When did the word “denier”, become a scientific term? What do these arrogant Alarmist jerks, think they are doing. I took a deep breath, and continued reading the article.
The third paragraph really made me sit up, and take notice.
They repeated a common Alarmist lie, about the slowdown, which I talked about in a recent article.
They said, “But, more importantly, these claims use the same kind of misdirection as was used a few years ago about a supposed “pause” in warming lasting from roughly 1998 to 2013.”
They talk about “deniers using misdirection”, and then THEY misdirect people to a false weak slowdown (1998 to 2013). This is part of an Alarmist myth, which claims that the recent slowdown only exists because of the 1998 super El Nino.
In my article, I said:
– The strongest slowdown (the one with the lowest warming rate), went from 2002 to 2012. It had a warming rate of +0.14 degrees Celsius per century. Because it went from 2002 to 2012, it had nothing to do with the 1998 super El Nino.
– The average warming rate from 1970 to 2018, is about +1.8 degrees Celsius per century. So the slowdown from 2002 to 2012, had a warming rate that was less than 8% of the average warming rate.
– If the average warming rate was a car travelling at 100 km/h, then the slowdown was a car that was travelling at less the 8 km/h. Doesn’t that sound like a slowdown?
– The strongest slowdown WHICH INCLUDED THE YEAR 1998 (the one with the lowest warming rate), went from 1998 to 2013. It had a warming rate of +0.96 degrees Celsius per century.
[this is the slowdown interval that Lewandowsky and Cowtan used]
– So the false Alarmist slowdown (1998 to 2013), had a warming rate which was 6.9 times greater than the warming rate of the real slowdown (2002 to 2012).
-If the real slowdown (2002 to 2012) was a car that was traveling at 100 km/h, then the false Alarmist slowdown (1998 to 2013), would be a car that was traveling at 690 km/h.
Perhaps this is one of the reasons why Alarmists don’t believe that there was a slowdown. They are not even looking at the real slowdown.
====================
Lewandowsky and Cowtan seem to be under the impression that, because “the past two years were two of the three hottest on record”, that there could NOT have been a slowdown. Have they never noticed, that when a person takes their foot off the accelerator in a car, the car keeps moving forward (but at a slower rate, i.e. a slowdown)? So the car is still setting records, becoming further from where it started, even though it has slowed down.
This “everyday” observation (about a person taking their foot off the accelerator of a car), appears to be too complicated for them to grasp. Perhaps they are chauffeur driven, everywhere.
====================
Lewandowsky and Cowtan say, “In a nutshell, if you select data based on them being unusual in the first place, then any statistical tests that seemingly confirm their unusual nature give the wrong answer.”
There is a well-known saying, “If it looks like a duck, and walks like a duck, and quacks like a duck, then it probably IS a duck”.
We could rephrase that as, “If it looks like a slowdown, and the warming rate is lower than normal, and the statistical test says that it COULD be a slowdown, then it probably IS a slowdown”.
But Lewandowsky and Cowtan want you to believe that, “If it looks like a slowdown, and the warming rate is lower than normal, and the statistical test says that it COULD be a slowdown, then it DEFINITELY IS NOT A SLOWDOWN”.
Lewandowsky and Cowtan don’t want skeptics to look for slowdowns in places that look like slowdowns. They want skeptics to only look for slowdowns in places that DON’T look like slowdowns.
I would like to suggest that skeptics start looking for slowdowns, on the moon. There isn’t much chance of finding one, but if you do find one, it is almost certainly real.
====================
I am amazed at how Lewandowsky and Cowtan don’t seem to be able to understand simple logic. They give an example, “If someone claims the world hasn’t warmed since 1998 or 2016, ask them why those specific years – why not 1997 or 2014?”
If somebody got run over by a truck in 1998, would you ask them, “Why 1998, why didn’t you get run over by a truck in 1997 or 1999”? If something happens in a particular year, or over a particular interval, then that is a fact. There is little point in questioning why it didn’t happen at a different time.
The reason that Lewandowsky and Cowtan ask, “Why those specific years – why not 1997 or 2014?”, is because they CAN’T PROVE that there wasn’t a slowdown since 1998, and they want to misdirect people, with a stupid question.
====================
Lewandowsky and Cowtan are concerned that skeptics will cherry-pick intervals which “look like” a slowdown, but are not really a slowdown.
I developed a method to analyse date ranges, for slowdowns and speedups, which does NOT cherry-pick date ranges. It does this, by giving equal weight to EVERY possible date range. So when I analyse 1970 to 2018, I calculate about 150,000 linear regressions (one for every possible date range). Then I look at which date ranges have a low warming rate. To make it easier, I colour code all of the results from the 150,000 linear regressions, and plot them on a single graph. I call this graph, a “Global Warming Contour Map”.
If I find that 2002 to 2012 has a low warming rate, then that means that it had a low warming rate, compared to the thousands and thousands of other date ranges that I checked. Every date range has an equal chance of being a slowdown or a speedup, based on its warming rate. The warming rate is an objective measurement, based on a temperature series.
But wait. I don’t stop there. I check every temperature series that I can find. This includes GISTEMP, NOAA, UAH, RSS, BEST, CLIMDIV, RATPAC (weather ballon data), etc.
But wait. I don’t stop there. I check every type of measurement that I can find. Land and Ocean. Land only. Ocean only. Lower troposphere. Upper troposphere, Stratosphere.
But wait. I don’t stop there. I check every region that I can find. Northern hemisphere. Southern hemisphere. Tropical. Extratropical. Polar.
But wait. I don’t stop there. I check every latitude that I can find. 90N to 48N. 48N to 30N. 30N to 14N. 14N to Equator. Equator to 14S. 14S to 30S. 30S to 48S. 48S to 90S
When I say that there was a slowdown, that means that I have found evidence of a slowdown, in most of the major temperature series, types of measurements, regions, and latitudes.
I have made literally hundreds of global warming contour maps, for nearly every type of global warming data, that you can imagine. Each one, based on about 150,000 linear regressions.
I have probably done more linear regressions, than any other person in the world. I may have even done more linear regressions, than everybody in the world, put together.
And all of those linear regressions, tell me that there was a slowdown, sometime after the year 2001. It was strongest from 2002 to 2012. You can measure it in different ways, and get slightly different results. But there is overwhelming evidence for the slowdown.
I didn’t cherry-pick 2002 to 2012. This interval leapt out of my computer screen, slapped me on the face, and yelled, “I am a slowdown, stop ignoring me !!!”
Alarmists, are the real “Deniers”. They ignore the evidence that they can’t explain away. They insult the people who try to show the truth. They lie, when other methods don’t work.
It is time for Alarmists to admit the truth. There was a slowdown. It was not enormously long. It was temporary. It is now over. The fact that it existed, didn’t prove that global warming isn’t happening.
My personal belief, is that the slowdown was caused by ocean cycles, like the PDO and AMO. There are climate scientists, who believe the same thing. We need to acknowledge the slowdown, so that we can learn more about climate. Lying about the slowdown, won’t solve global warming. Understanding the slowdown, might help us to understand global warming.
If anybody would like to learn more about my method, and “Global Warming Contour Maps”, then there are lots of them, on my website. I wrote a special article, called “Robot-Train contour maps”, which explains how contour maps work, using simple “train trips”, as an analogy for global warming.
Here is a small selection of articles about slowdowns, and “global warming contour maps”.
– No, I am not obsessed with slowdowns.
– I didn’t choose slowdowns, they chose me.
– Being the “proud father” of “global warming contour maps”, I am always happy to answer questions, and show you pictures, of my clever baby.
[ this article shows how “global warming contour maps” work ]
https://agree-to-disagree.com/robot-train-contour-maps
[ this article shows why Alarmist thinking on slowdowns, in one-dimensional ]
https://agree-to-disagree.com/alarmist-thinking-on-the-slowdown
[ this article investigates the Alarmist myth, that the slowdown was caused by the 1998 super El Nino ]
https://agree-to-disagree.com/was-the-slowdown-caused-by-1998
[ this article shows why the slowdown is so special (No, no, no, no, no! It only LOOKS special. It isn’t really special.) ]
https://agree-to-disagree.com/how-special-was-the-recent-slowdown
[ A guide to the CORRECT way to look for slowdowns. Please try to stay quiet. Slowdowns scare easily, and then they run away and hide. ]
https://agree-to-disagree.com/how-to-look-for-slowdowns
[ this article investigates warming in the USA, using NOAA’s new ClimDiv temperature series ]
https://agree-to-disagree.com/usa-warming
[ this article investigates regional warming, by dividing the earth into 8 equal sized areas, by latitude]
https://agree-to-disagree.com/new-regional-warming
[ this weather balloon article has global warming contour maps with very nice colours ]
https://agree-to-disagree.com/weather-balloon-data-ratpac
[ this article uses global warming contour maps to compare GISTEMP and UAH ]
https://agree-to-disagree.com/gistemp-and-uah
“My personal belief, is that the slowdown was caused by ocean cycles, like the PDO and AMO.”
That is correct Sheldon.
There was a slowdown.
It was caused primarily by the cool Pacific (vastly more influence on GSMTs than the Atlantic).
However you have to look at the whole climate system.
Here you find that the Oceans (93% of system heat) continued to warm unabated through the slowdown.
https://159.226.119.60/cheng/
Anthony Banton,
You are right about the oceans. They are the driving force of the warming. I suspect you are not aware they have been warming for over 400 years. Here’s one example.
https://www.nature.com/articles/s41467-018-02846-4/figures/2
They explain the recovery from the LIA plus the recent warming.
PS. It is always a hoot to see someone mention “the cool Pacific” without any thought that possibly a warm Pacific could also have an effect. We’ve only had a negative PDO from 2007-2013. Otherwise, it has been positive since 1977.
Richard,
you said, “You are right about the oceans. They are the driving force of the warming. I suspect you are not aware they have been warming for over 400 years.”
Except were they put Argo floats.
Either:
– scientists have been very unlucky, and have accidentally put Argo floats only into the bits of the ocean that are not warming
– or global warming is hiding the warming, in parts of the ocean where the Argo floats don’t go.
There are 2 other options:
– the oceans are not warming much
– or there is a huge conspiracy, hiding the fact that the oceans are warming.
Maybe it’s simplistic, but given that the WMO and others define a period of ‘climatology’ as being of 30-years duration, I would be inclined to look at the running 30 year trends. Using running centred 30-year trends with the last one ending 2017 in whole years, there are 16 that incorporate all or part of Sheldon’s observed 2002-2012 slowdown. The first of these 30-year periods is 1973-2002 and the last is 1988-2017. The question is, how has the 2002-12 slowdown affected the running 30-year trends over this period?
I used the WMO metric which is the average of HadCRUT, GISS and NOAA base-lined to 1961-90 (though the base doesn’t matter for the trends). I found that over the course of those 16 running 30-year periods, the 30-year trend ‘did’ decline overall. The slowest point is centred at 2003 (1.64 C/cent), which covers the 30-year period 1979-2008; so the first 7 years of the slowdown period. The 1997 centre point is also low (1.65C/cent) and this covers the 30-years 1983-2012, which includes the entire period of the slowdown. Lately the 30-year trends have picked up again, with 1988-2017 at 1.81 C/cent.
So I would say that the period 2002 to 2012 actually did have an observable dampening impact on the running 30-year trends, which is only to be expected I suppose. However, whether this is a ‘significant’ impact is another question. The range of 30-year trends for those 16 periods that incorporate all or part of the 2002-2012 slowdown is from 1.64 to 1.93 C/cent, with an average of 1.74 and the 2 sigma error is 0.17. In order for the slowdown period to have had a significant dampening impact on any of the encroaching 30-year trends, rates would have had to have fallen below 1.57 C/dec, which didn’t happen.
In summary I would say that Sheldon is right, the slowdown between 2002 and 2012 (especially the first 7 years of this period) is real and did have a dampening effect on the 30-year trends that incorporate the period. The Lewandowsky paper should have made this clear. However, the observed dampening effect was not statistically significant over any of the effected 30-year periods of climatology.
DWR54, the 30 year period was devised before any one understood the existence of the 60 year AMO cycle. It is of no use to anyone who really wants to understand climate.
We probably need around 120 years of data for a good understanding of climate but even then there are longer term cycles that need to be factored in.
“DWR54, the 30 year period was devised before any one understood the existence of the 60 year AMO cycle. It is of no use to anyone who really wants to understand climate.”
The AMO has but a small modulation on GMSTs superimposed on the GW signal ….
http://oi56.tinypic.com/25tdg60.jpg
The systems are so complex and the observations so scarce that we can have it any way we like:
https://twitter.com/ardo_i/status/1042590559616028672
Does the state of the art justify a central place for CO2 in the planet’s trillion $ policy space, at the expense of what has worked so well in the recent past, such as evading rising sea levels, agroscience, energy, education etc?
From the article: “They talk about “deniers using misdirection”, and then THEY misdirect people to a false weak slowdown (1998 to 2013). This is part of an Alarmist myth, which claims that the recent slowdown only exists because of the 1998 super El Nino.”
You can’t find a “1998 super El Nino” on any Hockey Stick chart.
Bogus, Bastardized Hockey Stick chart:
As you can see the Keepers of the Data have disappeared the warmth of the 1998 super El Nino and turned it into an “also-ran” year. This allowed CAGW zealots to claim it was getting hotter and hotter, year after year. Note, we haven’t heard that “hottest year evah!” meme in the last couple of years. That’s because the temperatures have been cooling since Feb. 2016. It’s not getting hotter and hotter. We are now about 0.6C cooler than it was in Feb. 2016, and that makes us about 1C cooler than 1934. We are not experiencing unprecedented warmth today. It was as warm or warmer in the 1930’s/40’s.
Here’s the UAH satellite chart. As you can see 1998 shows to be the second warmest year in the satellite record, with 2016 being just slightly warmer. You can’t use the “hotter and hotter” meme using the UAH satellite chart. That’s why the Climate Charlatans invented the fake Hockey Stick chart to give themselves some talking points.
1934 was not an especially hot year in global temperature, but US temperature. Pre-1970s global temperature peaked at or shortly after 1940.
“1934 was not an especially hot year in global temperature”
And how are you determining that, Donald?
Lewandowsky & Cowtan chose 1998 instead of 2002 as the start year of what they claim is lack of a slowdown/pause because most who talked up the slowdown/pause, especially most who did so in WUWT, claimed it did start in 1998 – or even earlier, for example Christoper Monckton in his monthly articles in WUWT about the pause before his determination of it ended.
Donald,
it is important to realise, that there is a WEAK slowdown starting from about 1998 (or even earlier). This weak slowdown, had a warming rate of about 55% of the average long-term warming rate.
But there is a STRONG slowdown starting from about 2001. This strong slowdown, had a warming rate of about 8% of the average long-term warming rate.
You can see why there is so much confusion. People have interpreted the data, to suit whatever they want to believe. To show the truth, I wrote an article called “Was the Slowdown caused by 1998?”.
https://agree-to-disagree.com/was-the-slowdown-caused-by-1998
“it is important to realise, that there is a WEAK slowdown starting from about 1998”
Christopher Monckton wasn’t interested in showing a slowdown, weak or otherwise, he was saying a pause, defined as a sub-zero trend. In order to do that he only used the slowest warming satellite data at the time, RSS. Moreover, he wanted to cherry-pick the longest possible length of time, so it was inevitable that this would start just before the big 1998 spike.
No matter what interval you use, the alarmist first reaction is to say you cherry picked it. It is not the same interval they cherry picked.
KT66,
I created “Global Warming Contour Maps” to avoid being accused of cherry-picking.
I don’t just look at the date ranges that I think might be a slowdown, I look at EVERY date range.
However, this didn’t stop alarmists from accusing me of cherry-picking. They now say, that I look at EVERY date range, so that I can cherry-pick the best date range for slowdowns.
In other words, they don’t want me to even attempt to look for slowdowns. People should realise that this applies to other things, and not just slowdowns. If you go looking for your lost wallet, you must NOT look in the places where you think that you might have lost it. There is too much risk that you would actually find it. You should search for your lost wallet, in places where it is NOT likely to be.
But I have found a solution, to avoid this criticism. I now search for slowdowns, with a paper bag over my head. That way, I can’t be accused of letting my bias affect the results.
Like the MWP and the LIA they need to get rid of the pause. Therefore they continue as if Bates blowing the whistle on Karl never happened.
A continue to be amazed at the ability of denizens to be unable conceive of natural variability conferred upon GMTs by the Pacific ocean, when it comes to cooling …. but are full of it when it comes to warming.
No, I’m being sarcastic – it’s entirely obvious why.
Here we have a fine example of it, as though CO2 is that “magical” it can erase that and force a monotonous rise in global temps.
“………….. that makes us about 1C cooler than 1934”

My goodness me, an amazingly bizarre statement, that is completely at odds with the data.
Vis:
Berekley Earth…..
http://berkeleyearth.org/wp-content/uploads/2018/01/TimeSeries2017.png
NASA/GISS….
Hadrcut4….
JMA (japan) ….
Eyeballing those series the Earth is 0.8C warmer than 1934.
“We are now about 0.6C cooler than it was in Feb. 2016
If you are referring to UAH – the MSU/AMSU radiance sensors are sensitive to atmospheric H2O.
An EN warms the trop AND injects more H2O.
““………….. that makes us about 1C cooler than 1934”
My goodness me, an amazingly bizarre statement, that is completely at odds with the data.”
Consider the source of the data: The imaginations of CAGW zealots. Climategate, Anthony. Think Climategate. You are putting your faith in a bunch of lies. It’s not hard to confirm the global warmth of the 1930’s. It happened less than 100 years ago. There are plenty of records of the time. Yet you ignore all that and accept a lie as reality.
Unmodified surface temperature charts from around the world resemble the trend of the US surface temperature chart, i.e., the 1930’s was as warm or warmer than subsequent years. You can’t refute this. This is the true surface temperature profile. The bogus Hockey Stick charts were dreamed up to sell humanity a Big Lie, which I guess you buy into..
“Consider the source of the data: The imaginations of CAGW zealots. Climategate, Anthony. Think Climategate. You are putting your faith in a bunch of lies.”
I nearly said in my post.
Que the “it’s a fraud” comments.
Well done, for not disappointing me.
Ad you “are putting your faith”, in a bizarre, down-the-rabbit-hole conspiracy theory.
Why it’s impossible to “talk” with your type.
Yes, yes, of course it is and we didn’t land on the Moon, or if we did we found Elvis there.
You wonder why there is a noun used that begins with “D” for you.
“Unmodified surface temperature charts from around the world resemble the trend of the US surface temperature chart, i.e., the 1930’s was as warm or warmer than subsequent years. You can’t refute this. ”
I can and I do.
But, hypothetically, OK – that being the case show me said global data (sorry the US is NOT the world).
You cant of course – but then that’ll be a scam too …. because no evidence is evidence for a conspiracy.
“But, hypothetically, OK – that being the case show me said global data (sorry the US is NOT the world). You cant of course”
Oh, but I can. I can show you unmodified surface temperature charts from all over the world that resemble the US surface temperature chart, i.e., the 1930’s were as warm or warmer than subsequent years.
Now, you are going to claim this does not represent the “global” trend because the data is coming from lots of separate sources. But where do you think the Climategate charlatans got their data? They got it from the very same local surface temperature charts from around the world, then the manipulated the figures to favor a CAGW forecast and called it a “global” temperature chart. The Hockey Stick “global” temperature is just a conglomeration of local surface temperature charts before the satellite era.
I have the advantage over the alarmists and their claims of legitimacy for the bogus, bastardized global Hockey Stick charts. History backs up my claim that the 1930’s was as warm or warmer than subsequent years as all the unmodified charts show this. OTOH, there are NO unmodified surface temperature charts which show the Hockey Stick configuration. The Hockey Stick is an invention of Alarmists to promote the CAGW lie.
MISDIRECTION & DIVERSION from a ?significant break? in
TOO MUCH brain power continues to be wasted foolishly disputing the fact temperature rose more slowly over a 10-15 year period starting around 1998 or 2002 than it did from 1970 to whichever starting year one prefers.
ENOUGH brain power has been used proving climate “models” grossly overestimated the temperature gain from the mid 1990s to the present. Model flaws causing the overestimation have been pointed out, and corrections suggested.
THUS, I respectfully suggest more attention be directed to the significance of the following. Global temperatures did NOT begin trending downwards after 2000 or 2010, or so. One might reasonably expect a downward trend since 2000 or 2010. Why? One routine temperature cycle spans 60-80 years. The warming phase of the current version of this cycle began 1970-1975. The cooling phase should have begun around 2000-2010. Instead, temperature has drifted sideways. Insights into this break from routine from this website’s brain trust are respectfully requested.
RSS has ended continuation of the v3.3 vs v4.0 temperature difference (v4.0 reports warmer) as discussed at https://wattsupwiththat.com/2018/10/16/the-new-rss-tlt-data-is-unbelievable-or-would-that-be-better-said-not-believable-a-quick-introduction/
They simply stopped reporting updates to v3.3.
The warming hiatus is only one of dozens of observations that disprove AGW.
Some other AGW disproving observations.
1) The 1940 to 1970’s cooling (See News week and National Geographic articles warning of global cooling.)
2) The 1930 to 1940 warming
The solution to 1 and 2 was for NASA, “James Hansen’s staff”, to change the data.
https://realclimatescience.com/wp-content/uploads/2017/02/Olympia-Washington-February-7-2017-3.pdf
“NASA Used To Show 1940 To 1970’s Cooling But Have Recently Removed It”
3) Medieval Warm period
Solution. Team up with CAGW friends to make it go away.
http://www.uoguelph.ca/~rmckitri/research/McKitrick-hockeystick.pdf
What is the ‘Hockey Stick’ Debate About?
… At the political level the emerging debate is about whether the enormous international trust that has been placed in the IPCC was betrayed. The hockey stick story reveals that the IPCC allowed a deeply flawed study to dominate the Third Assessment Report, which suggests the possibility of bias in the Report-writing…
…The result is in the bottom panel of Figure 6 (“Censored”). It shows what happens when Mann’s PC algorithm is applied to the NOAMER data after removing 20 bristlecone pine series. Without these hockey stick shapes to mine for, the Mann method generates a result just like that from a conventional PC algorithm, and shows the dominant pattern is not hockey stick-shaped at all. Without the bristlecone pines the overall MBH98 results would not have a hockey stick shape, instead it would have a pronounced peak in the 15th century.
Of crucial importance here: the data for the bottom panel of Figure 6 is from a folder called CENSORED on Mann’s FTP site. He did this very experiment himself and discovered that the PCs lose their hockey stick shape when the Graybill-Idso series are removed. In so doing he discovered that the hockey stick is not a global pattern, it is driven by a flawed group of US proxies that experts do not consider valid as climate indicators. But he did not disclose this fatal weakness of his results, and it only came to light because of Stephen McIntyre’s laborious efforts.
….In other words, MBH98 and MBH99 present results that are no more informative about the millennial climate history than random numbers. …”
“It is time for Alarmists to admit the truth. There was a slowdown. “
They can’t/won’t because the science on CO2 in control is “settled” according to climate scripture. Period. End of discussion stuff.
It would be like the Vatican admitting a miracle attributed to JC in the Gospel was merely a natural spontaneous healing event. They can’t do it, the laity’s faith in foundational dogma would be threatened.
The planet is cooling. We are heading into a Maunder Minimum type event.
When a significant number of scientist predicted this, against massive contrary opinion, they were attacked then ignored.
But it’s happening. And a million graphs and a billion words won’t stop it.
UAH shows a complte pause from 1995 to 2013.
http://woodfortrees.org/graph/uah6/from:1995/to:2013/plot/uah6/from:1995/to:2013/trend
“…then THEY misdirect people to a false weak slowdown (1998 to 2013). ”
Yes, Christopher Monckton’s “Great Pause” was false.
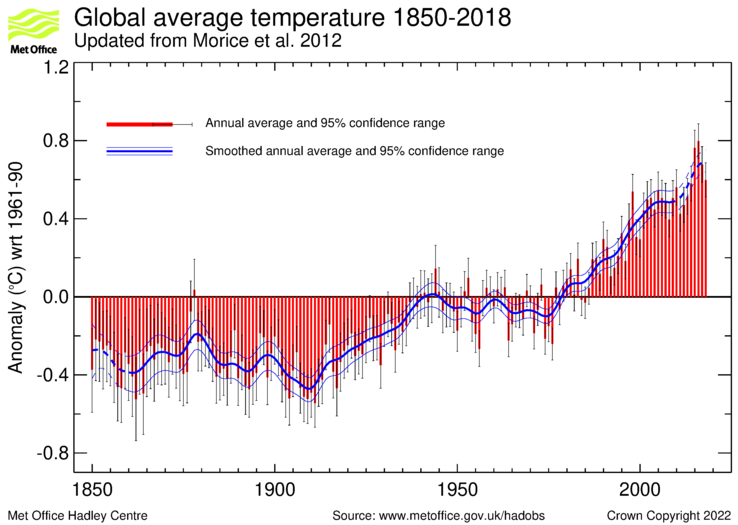
“The strongest slowdown (the one with the lowest warming rate), went from 2002 to 2012. It had a warming rate of +0.14 degrees Celsius per century.”
That’s just 10 years and not significantly different to the underlying warming rate.
“Have they never noticed, that when a person takes their foot off the accelerator in a car, the car keeps moving forward (but at a slower rate, i.e. a slowdown)? So the car is still setting records, becoming further from where it started, even though it has slowed down.”
Except it hasn’t slowed down. If we allow a ten year period as evidence of a warming rate the last ten years have warmed at the rate of 3.6°C / century. Either you accept that a short period is not relevant or you wonder why the rate of warming has doubled in the last 10 years. (Note also that the last ten years includes almost a 3rd or your slowdown.)
““If it looks like a slowdown, and the warming rate is lower than normal, and the statistical test says that it COULD be a slowdown, then it DEFINITELY IS NOT A SLOWDOWN”.”
The article doesn’t say anything of the sort. It says that there’s no compelling evidence that anything unusual happened.
“If I find that 2002 to 2012 has a low warming rate, then that means that it had a low warming rate, compared to the thousands and thousands of other date ranges that I checked.”
Which is your problem, and pretty much the definition of cherry-picking. If you look at thousands of pieces of random data you will find data that has a low probability of occurring.
Bellman,
Christopher Monckton’s “Great Pause” was WEAK, NOT false.
it is important to realise, that there is a WEAK slowdown starting from about 1998 (or even earlier). This weak slowdown, had a warming rate of about 55% of the average long-term warming rate.
But there is a STRONG slowdown starting from about 2001. This strong slowdown, had a warming rate of about 8% of the average long-term warming rate.
You can see why there is so much confusion. People have interpreted the data, to suit whatever they wanted to believe. To show the truth, I wrote an article called “Was the Slowdown caused by 1998?”.
https://agree-to-disagree.com/was-the-slowdown-caused-by-1998
====================
You said, “That’s just 10 years and not significantly different to the underlying warming rate.”
I will reduce your income to 8% of your present income, for 10 years, and then you can tell me if you think that is not significant.
8% is significantly less than 100%
====================
You said, “If we allow a ten year period as evidence of a warming rate the last ten years have warmed at the rate of 3.6°C / century.”
Yes, I do accept that the last ten years have warmed at the rate of +3.65 degrees Celsius per century.
I am not biased against speedups. I accept that both happen. It is a feature of our climate. There is no point in denying it. Accept it, and learn from it.
====================
Alarmists don’t seem to understand about “random” events. They claim that the recent slowdown was not significant, because it was probably just caused by “random” factors. They say that I should accept that there is a certain amount of natural variation in the temperature. It is to be expected, and that I should not make a big thing of it.
I don’t care whether it was “random”, or not. If you get chilled by a temperature of -20 degrees Celsius, it doesn’t really matter if that -20 degrees Celsius was caused by “random” factors, or “non-random” factors. The most important fact, is that the temperature is -20 degrees Celsius, not what caused it.
What caused the -20 degrees Celsius might be important for “solving” the cold temperatures. But the cold temperatures don’t “cease to be a problem”, just because they were caused by random factors.
Random events, are still REAL events.
“Christopher Monckton’s “Great Pause” was WEAK, NOT false.”
You used the word “false”. I’ve explained above why you cannot compare your slowdown with Monckton’s Great Pause, and why his required starting before 1998.
“You can see why there is so much confusion. People have interpreted the data, to suit whatever they wanted to believe.”
I agree completely. It’s been my contention for many years that people insisting the pause was a real thing, need to define exactly what they mean by the word.
“I will reduce your income to 8% of your present income, for 10 years, and then you can tell me if you think that is not significant.
8% is significantly less than 100%”
I should have said statistically significant. But we are not talking about income, we are talking about the rate of change and the rate of change of a quantity that varies from year to year.
“I am not biased against speedups. I accept that both happen. It is a feature of our climate. There is no point in denying it. Accept it, and learn from it.”
But what do you want to learn?
You seem to attach some importance to these varying rates of change whereas I say there is no reason to suppose these are any different to what you would expect over short periods of time given the variable nature of the data. Most people will point out that the only reason the last ten years have warmed at such a fast rate is because of the El Niño of 2016. In a few years time it’s likely there will be a ten year period of flat or cooling temperatures simply because the El Niño will have moved to the start.
“Alarmists don’t seem to understand about “random” events. They claim that the recent slowdown was not significant, because it was probably just caused by “random” factors.”
Any competent statistician should tell you that. The statistical approach is necessary to avoid alarmism. The statistical approach is to avoid drawing conclusions from data until there is significant evidence to support it.
“Random events, are still REAL events.”
True, but random events cannot be used to determine future events. If you roll a 1 on a die it doesn’t mean you are not going to roll a 6 next time.
Bellman,
I believe that Christopher Monckton looked back in time, as far as he could go, to the point where global warming just became statistically significant. He used the “confidence interval”, to determine how long we haven’t had warming for (i.e. for how long we haven’t had statistically significant warming, looking back).
I don’t necessarily agree with what he did, but it is nice to see a Skeptic using the methods that Alarmists use, when they try to “prove” that global warming is happening.
====================
You said, “It’s been my contention for many years that people insisting the pause was a real thing, need to define exactly what they mean by the word.”
I disagree. Alarmists and Skeptics together, must come up with a definition for the terms “pause” and “slowdown”. It must be acceptable to BOTH parties.
Since Alarmists and Skeptics refuse to talk to each other (apart from verbal abuse), an agreement on the definitions of terms, is unlikely to happen.
When I show evidence for the slowdown, Alarmists attack me, and my definition of what a slowdown is. But they don’t offer their definition of a slowdown, because they are scared that I might be able to “use it against them”.
Alarmists know, that by leaving the term “slowdown” undefined, they can always weasel their way out of admitting that there was a slowdown.
====================
You said, “I should have said statistically significant.”
I keep pointing out, that temperature data is very noisy, and that you can NOT rely on statistical significance.
You often can’t get definite proof that there WAS a slowdown.
But you also can’t get definite proof that there WASN’T a slowdown.
So how do we decide whether there was a slowdown or not?
In the absence of statistical proof, for or against a slowdown, you must be guided by the calculated warming rate (calculated from a linear regression).
If the calculated warming rate is considerably less than the average warming rate, then there was a slowdown. Statistically significant proof, is for data that is not too noisy.
Variables calculated using linear regressions are BLUE. They are the Best Linear Unbiased Estimates. EVEN IN THE PRESENCE OF AUTOCORRELATION.
So the calculated warming rate, is the best estimate of the real warming rate, that we can get. In other words, trust the results of a linear regression, because you can’t get a better estimate.
Alarmists want to ignore the results of linear regressions, when they don’t like the result. That is cheating. But of course, Alarmists are experts at cheating. They do it all of the time.
====================
We wouldn’t have this problem, if Alarmists weren’t so pig-headed.
A simple admission that there was a small, temporary slowdown, that doesn’t have any significant long-term implications for global warming, would end the debate.
But no. Alarmists will never admit that they were wrong. If they could be wrong about the recent slowdown, then they could be wrong about global warming.
Alarmists have shot themselves in both feet. Calling everybody who disagrees with them, a “Denier”, has created such ill-will, that many people will never support Alarmists.
I don’t mind. I am enjoying writing lots of articles about the recent slowdown, pointing out how stupid Alarmists are.
Please don’t spoil my fun, by admitting that there was a small, temporary slowdown, that doesn’t have any significant long-term implications for global warming.
I’ve replied to this below. Internet problems resulted in it being sent to the wrong place.
https://wattsupwiththat.com/2019/01/04/how-to-not-find-a-slowdown/#comment-2579042
Sheldon your graphics are interesting. Can you make one for HadSST3 please?
It’s hard to conduct science in a nutshell, because you are a nut.
Sheldon Walker,
“The average warming rate from 1970 to 2018, is about +1.8 degrees Celsius per century. So the slowdown from 2002 to 2012, had a warming rate that was less than 8% of the average warming rate.”
Taking 1970 as the starting point, the rate of warming up to 2002, the start of your slowdown, was 1.68°C / century.
The warming rate from 1970 to 2012, the end of your slowdown the rate of warming was effectively the same at 1.71°C / century.
How do you explain the paradox of 10 years of almost no warming having no effect on the underlying warming rate?
Bellman,
you said, “How do you explain the paradox of 10 years of almost no warming having no effect on the underlying warming rate?”
You have asked a very good question. Thank you.
I will look at this issue more closely, using linear regressions, graphs, LOESS curves, and global warming contour maps. I will post the answer here, and on my website, when I can give you a complete answer.
My suspicion, is that global warming is so pathetically weak, that even a slowdown to 8% is not “big”, in absolute terms.
I am sorry if this answer offends you. You asked the question.
Bellman,
I just thought of another reason why the 10 year recent slowdown, might not affect the underlying warming rate by much.
It is the way that you calculated it.
From 1970 to 2002 (the start of the recent slowdown), is 32 years, with a warming rate of about 1.68°C / century.
From 1970 to 2012 (the end of the recent slowdown), is 42 years, with a warming rate of about 1.71°C / century. This is almost the same warming rate as 1970 to 2002.
But the period of 42 years, is made up of 32 years with a “normal” warming rate, and only 10 years of a lower warming rate. i.e. it is still heavily weighted towards the “normal” warming rate, by a factor of nearly 3:1.
The way that linear regressions work, may also be an issue. They are affected by the end-points, more than the points in the middle.
Did you calculate your warming rates with monthly temperature data, or yearly temperature data. That might make a difference.
Again, I think that this issue is interesting enough, to investigate further. I am going to do some experiments with EXCEL, setting up a period of normal warming, followed by a period of slowdown, and see how the underlying warming rate is affected.
Thanks again, for asking the question. I welcome the chance to learn something new.
Sheldon,
There are 10-year variations within the 1970-2002 range too. For instance, according to GISS (which I think you are using?), between Jan 1987 – Dec 1996 global temperatures actually *cooled* at a rate of -0.28C/cent. So the period you refer to as having “a “normal” warming rate” actually contains a 10-year period of temperatures that were cooler than your 2002-2012 selection.
Sheldon Walker,
All nice theories, but I suspect the real reason is that you’re ignoring the position of the trends. If you draw your 10 year strong slowdown on a graph alongside the long term warming you will probably see that the slowdown trend starts somewhat warmer than the end of the previous period.
In other words the trend from 2002 to 2012 was slow, but it was already warmer at the start than would be expected, and at the end isn’t much cooler than would be expected. It’s a consequence of starting a trend at a warm point.
Americans “they are chauffeur driven,”
while we use clutch, throttle [pedal], brake and shift levers.
different worlds.
No intercommunication.
There is no ”slow down” in warming at the moment. There is a STOP to warming. (not that I care either way). That it’s WARMER now than in 1997 does not mean it’s warming now. We don’t know if it’s a pause or not so we should not use that word. Same with ”hiatus”.
This guest blogger may be a statistical wizard, but really needs to study the over-use of commas.
This chart shows GISS global surface temperatures from Jan 1987 to Dec 1996; 10 full years:-
http://www.woodfortrees.org/graph/gistemp/from:1987/to:1997/plot/gistemp/from:1987/to:1997/trend
How come no one ever mentions the great 1987-96 ‘pause’?
“I believe that Christopher Monckton looked back in time, as far as he could go, to the point where global warming just became statistically significant. ”
I think you’re wrong in that believe. Monckton never mentioned significance, he simple looked for the earliest date that would give him a non-positive trend.
“I don’t necessarily agree with what he did, but it is nice to see a Skeptic using the methods that Alarmists use, when they try to “prove” that global warming is happening.”
I’m puzzled why you use a term like Skeptic to refer to Monckton, yet attack anyone who is skeptical about the pause. Significance testing is all about skepticism. It says you cannot claim something is real until you have demonstrated that it is highly unlikely to have happened by chance.
And Monckton was not using the methods used to confirm global warming is happening. Warming over the last 40 years or so is statistically significant, and more detailed analysis can point to a change starting in the mid 70s.
“I disagree. Alarmists and Skeptics together, must come up with a definition for the terms “pause” and “slowdown”. It must be acceptable to BOTH parties.”
If you are making a claim the onus is on you to define what that claim is and show how it could be falsified. My complain about the lack of a clear definition is that pause advocates can never be shown to be wrong as the claim keeps changing.
“Since Alarmists and Skeptics refuse to talk to each other (apart from verbal abuse), an agreement on the definitions of terms, is unlikely to happen.”
Aside from complaining about abuse whilst using words like “alarmist”, I thought we were talking. People have been talking about a pause for at least 12 years now. And every year it seems to be a different pause. First it was global warming stopped in 1998, then there had been global cooling since 2002, then there had been no warming for 17 years, then the real pause was the lack of significant warming, then it was that the warming was less than predicted, and here it’s a slowdown of 10 years.
“When I show evidence for the slowdown, Alarmists attack me, and my definition of what a slowdown is. But they don’t offer their definition of a slowdown, because they are scared that I might be able to “use it against them”.”
I’m not the one claiming there has been a slowdown, but if you want my definition of a slowdown it would be a period of time where warming was statistically less than the underlying rate, but also a period that resulted in a significant reduction in the underlying rate of warming.
“I keep pointing out, that temperature data is very noisy, and that you can NOT rely on statistical significance.”
That makes no sense. It’s the very fact that the data is noisy that explains why you cannot use a 10 year period to demonstrate a slowdown or a speedup. If temperatures are rising at a consistent rate the noise means you will always be seeing changes in short term trends. They do not necessarily represent an actual change in the rate of warming.
“You often can’t get definite proof that there WAS a slowdown.
But you also can’t get definite proof that there WASN’T a slowdown.
So how do we decide whether there was a slowdown or not?”
Welcome to the world of skepticism. If you want to convince someone that something exists you need to provide good evidence for it (not “definite proof”).
“So the calculated warming rate, is the best estimate of the real warming rate, that we can get. In other words, trust the results of a linear regression, because you can’t get a better estimate.”
Yes, they are the best estimate, but with noisy data and a short time scale it is very probably that these estimates are wrong. How do you decide how good the estimate is? By using statistics. If the best estimate is zero but the confidence interval is plus or minus 2.5°C / century then you cannot tell very much from that best estimate.
“We wouldn’t have this problem, if Alarmists weren’t so pig-headed.”
Do you notice any irony here?
“But no. Alarmists will never admit that they were wrong. If they could be wrong about the recent slowdown, then they could be wrong about global warming.”
I don’t get it – you say the slowdown was not significant, how could it imply global warming is wrong. Moreover many of the people who have argued that it is worth looking at a possible slowdown are people you would probably classify as “Alarmists”.
“Please don’t spoil my fun, by admitting that there was a small, temporary slowdown, that doesn’t have any significant long-term implications for global warming.”
If you could show convincing evidence that there had been a slowdown, I’d happily admit it. I don’t deny the possibility of a slowdown, and if such a thing happens it will be important to investigate it and understand why it was happening. Even if there isn’t convincing evidence it might be worth investigating. It’s very likely there will be slowdowns and accelerations in global warming, and it’s important we understand as much as possible about what might cause them.
But just looking at ten year periods, and noticing differences cause by spikes and troughs doesn’t seem that useful.
Why is Lewandowsky coauthoring “climate” papers anyway?
from Karl 2015. I’m guessing that they neglected to mention that there was a pause that needed to be corrected out of history.