Reposted from Dr. Roy Spencer’s Blog
+0.25 deg. C
January 2nd, 2019 by Roy W. Spencer, Ph. D.
2018 was 6th Warmest Year Globally of Last 40 Years
The Version 6.0 global average lower tropospheric temperature (LT) anomaly for December, 2018 was +0.25 deg. C, down a little from +0.28 deg. C in November:

Global area-averaged lower tropospheric temperature anomalies (departures from 30-year calendar monthly means, 1981-2010). The 13-month centered average is meant to give an indication of the lower frequency variations in the data; the choice of 13 months is somewhat arbitrary… an odd number of months allows centered plotting on months with no time lag between the two plotted time series. The inclusion of two of the same calendar months on the ends of the 13 month averaging period causes no issues with interpretation because the seasonal temperature cycle has been removed, and so has the distinction between calendar months.
Various regional LT departures from the 30-year (1981-2010) average for the last 24 months are:
YEAR MO GLOBE NHEM. SHEM. TROPIC USA48 ARCTIC AUST

2017 01 +0.33 +0.32 +0.35 +0.11 +0.28 +0.95 +1.22

2017 02 +0.39 +0.58 +0.20 +0.08 +2.16 +1.33 +0.22

2017 03 +0.23 +0.37 +0.10 +0.06 +1.22 +1.24 +0.98

2017 04 +0.28 +0.29 +0.27 +0.22 +0.90 +0.23 +0.40

2017 05 +0.45 +0.40 +0.50 +0.42 +0.11 +0.21 +0.06

2017 06 +0.22 +0.34 +0.10 +0.40 +0.51 +0.10 +0.34

2017 07 +0.29 +0.31 +0.28 +0.51 +0.61 -0.27 +1.03

2017 08 +0.41 +0.41 +0.42 +0.47 -0.54 +0.49 +0.78

2017 09 +0.55 +0.52 +0.58 +0.54 +0.30 +1.06 +0.60

2017 10 +0.64 +0.67 +0.60 +0.48 +1.22 +0.83 +0.86

2017 11 +0.36 +0.34 +0.39 +0.27 +1.36 +0.68 -0.12

2017 12 +0.42 +0.50 +0.33 +0.26 +0.45 +1.37 +0.36

2018 01 +0.26 +0.46 +0.06 -0.11 +0.59 +1.36 +0.43

2018 02 +0.20 +0.25 +0.16 +0.04 +0.92 +1.19 +0.18

2018 03 +0.25 +0.40 +0.10 +0.07 -0.32 -0.33 +0.60

2018 04 +0.21 +0.32 +0.11 -0.12 -0.00 +1.02 +0.69

2018 05 +0.18 +0.41 -0.05 +0.03 +1.93 +0.18 -0.39

2018 06 +0.21 +0.38 +0.04 +0.12 +1.20 +0.83 -0.55

2018 07 +0.32 +0.43 +0.22 +0.29 +0.51 +0.29 +1.37

2018 08 +0.19 +0.22 +0.17 +0.13 +0.07 +0.09 +0.26

2018 09 +0.15 +0.15 +0.14 +0.24 +0.88 +0.21 +0.19

2018 10 +0.22 +0.31 +0.13 +0.34 +0.25 +1.11 +0.39

2018 11 +0.28 +0.27 +0.30 +0.50 -1.13 +0.69 +0.53

2018 12 +0.25 +0.32 +0.19 +0.32 +0.20 +0.65 +1.19
The 2018 globally averaged temperature anomaly, adjusted for the number of days in each month, is +0.23 deg. C, making 2018 the 6th warmest year in the now-40 year satellite record of global lower tropospheric temperature variations.
The linear temperature trend of the global average lower tropospheric temperature anomalies from January 1979 through December 2018 remains at +0.13 C/decade.
The UAH LT global anomaly image for December, 2018 should be available in the next few days here.
The new Version 6 files should also be updated at that time, and are located here:
Lower Troposphere: http://vortex.nsstc.uah.edu/data/msu/v6.0/tlt/uahncdc_lt_6.0.txt
Mid-Troposphere: http://vortex.nsstc.uah.edu/data/msu/v6.0/tmt/uahncdc_mt_6.0.txt
Tropopause: http://vortex.nsstc.uah.edu/data/msu/v6.0/ttp/uahncdc_tp_6.0.txt
Lower Stratosphere: http://vortex.nsstc.uah.edu/data/msu/v6.0/tls/uahncdc_ls_6.0.txt
As I understand it, there’s a view that the late 1970’s to late 1990’s warming trend petered out in about 2001.
Looking at UAH v6, the totals of all monthly global “anomalies” (apologies to those who don’t like the term) for 2001 was 1.39, whereas for 2018 it was 2.72.
The difference is 1.33. Divide by 12, and you get the actual difference in measured annualised anomaly.
0.1108333 (recurring).
Divide by 17 and multiply by 100 and you get a trend of less than 0.66 degrees warming per century.
And 2001 started with the tail end of a la nina whereas 2018 has been on el nino watch, so if anything that trend exaggerates the warming.
Macro scary!
“And 2001 started with the tail end of a la nina whereas 2018 has been on el nino watch, so if anything that trend exaggerates the warming.”
2001 was an El Niño year, at the time it was the second warmest in the UAH data set.
Bellman, 2002 was an El Nino year. Maybe you need new glasses.
http://origin.cpc.ncep.noaa.gov/products/analysis_monitoring/ensostuff/ONI_v5.php
Sorry, my mistake. Which make the fact that 2001 was the 2nd warmest year on record all the more remarkable.
Not really remarkable at all. Most of the satellite data set prior to 2001 is during the -AMO.
Go back to ~1930 and see how many years prior to that were warmer that the years after that date.
Most of that is due to the AMO induced warming of the Arctic. You can minimize this effect by only using Spring/Summer months (April-Sept.). I think if you redid your numbers you’d see even less warming.
I think people are over-thinking this a bit. Point # 1…There is zero trend since 2002
Point #2 For all intents and purposes the temp today is the same as it was in 1988. That’s 30 years = One climate data point = no global warming = co2 is not doing much.
Remember too that after 88 nothing happened apart from some COOLING.
Can we really let the ’89 and ’16/17 peaks distort our judgement of what’s actually happening?
That should be 1998 not ’89 of course…
It’s past time for another “theory” that is consistent with the unpredictable behavior of weather and climate. The models of a “greenhouse effect” forced by CO2, have failed to realize a viable concurrence with observation.
“Point # 1…There is zero trend since 2002”
The trend since the start of 2002 is 1.2°C / century according to UAH.
“Point #2 For all intents and purposes the temp today is the same as it was in 19[9]8.
That’s 30 years = One climate data point = no global warming = co2 is not doing much.”
1998 was an extremely hot year. Over 0.4°C warmer than any year seen up to that point. If you’re using that as a yardstick for change, you should also say that there had been about 0.7°C of warming between 1979 and 1998, warming at the rate of around 3.5°C / century.
“Remember too that after [9]8 nothing happened apart from some COOLING.”
After 1998 there were 2 years that were nearly identical to the two years before it, followed by 7 years that were warmer than any year prior to 1998. Of the past 8 years all but three have been warmer than any year prior to 1998.
Bellman,
When your alarm clock goes off and you wake up, you may just realize that you are prattling on about weather – NOT climate.
Give me a call when they start growing pineapples in Labrador City.
I’m replying to Mike’s comment above. He used 1998 as a benchmark for future warming. I agree that isn’t about climate – I was just responding to his points in kind.
Bellman, how long are you going to deny that ocean cycles can affect the global temperature?
I don’t think he is
But you said it – they are “cyclic” and as such come out a zero-sum.
They lie over and above the AGW signal.
Let me correct that for you “They lie over and above the rebound from the LIA.”
There sorted.
Very scintific A C.
It’s all a acam.
The every-ready nayayers get-out.
And why “talking” to them is useless.
And they never landed on the Moon, or, if they did, they found Elvis there.
What you mean you don’t believe in the LIA?
Richard M
” how long are you going to deny that ocean cycles can affect the global temperature?”
I made no mention of ocean cycles. I’m simply trying to explain why I think the data suggests there has been global warming and gives no indication of that stopping. There could be many causes for that, though one leaps to mind.
I’m sure ocean cycles can affect global temperature, but it’s difficult to see how they can can cause long term warming, being cyclical in nature. If a 60 year cycle was the only thing affecting temperature we would expect current temperatures to be comparable to those in the late 50s.
”The trend since the start of 2002 is 1.2°C / century according to UAH”.
Rubbish
”1998 was an extremely hot year. Over 0.4°C warmer than any year seen up to that point. If you’re using that as a yardstick for change, you should also say that there had been about 0.7°C of warming between 1979 and 1998, warming at the rate of around 3.5°C / century”.
I don’t care about 1979 to 1998
”Of the past 8 years all but three have been warmer than any year prior to 1998.”
Who cares?
“”The trend since the start of 2002 is 1.2°C / century according to UAH”.
Rubbish”
So how are you defining “trend”? I was using an ordinary least square regression, and it gave the .2°C / century figure. If you think this is rubbish explain why.
“I don’t care about 1979 to 1998”
Why not?
“”Of the past 8 years all but three have been warmer than any year prior to 1998.”
Who cares?”
You should if you want to maintain your claim that “Remember too that after 98 nothing happened apart from some COOLING.”. In my view the fact that despite all this COOLING temperatures are still warmer than before 1998 is at the very least an important piece of context.
The satellite era started at the end of the biggest cooling scare of the 20th century and you are still only talking about an increase of 0.7C over a 40 year period.
As Dr Spencer notes on his Forum the Satellite data is dominateded by the Northern Hemisphere, according to Hansen et al from 1880 to 1940 the Northern Hemisphere temperature increased by 0.8C, it then cooled by 0.5C in the next 30 years.
Nothing new at all.
Of course the Current temperature data no longer shows the same rise and fall as it has been homogenised out.
All reporting agencies agree there has been little or no change in average global temperature since 2002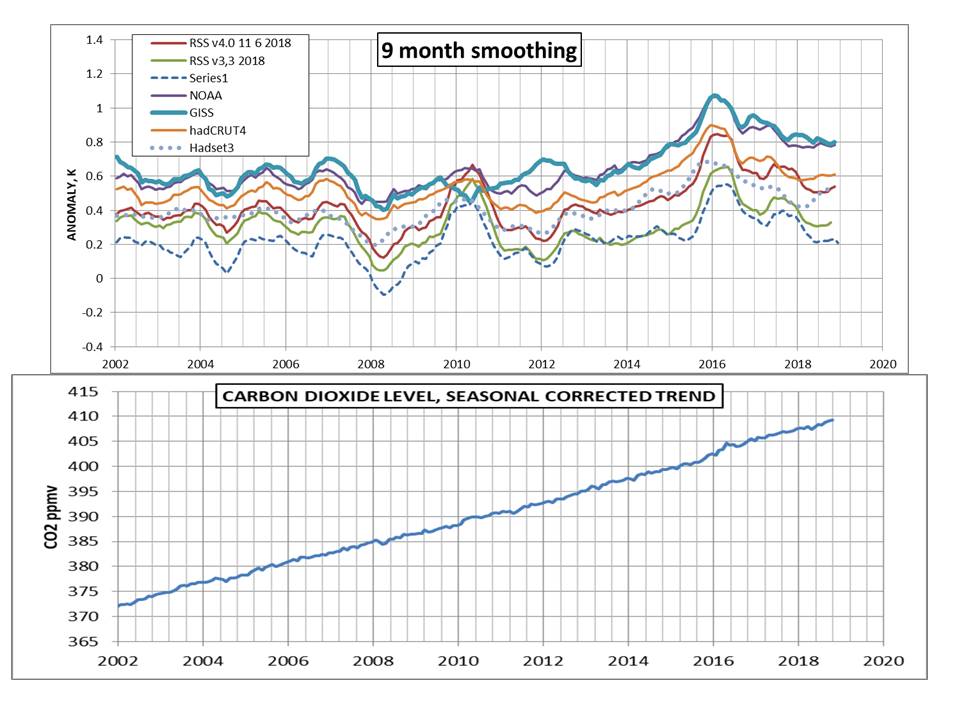
CO2 has increased since 2002 by 40% of the increase 1800 to 2002
Apparently CO2 has little if any effect on average global temperature
Discounting the aberration of the last el Nino, it appears water vapor trend has settled at about 7% more than it was in 1960.
The GHG effect was characterized in isolation, then extrapolated, modeled with global, yet low resolution, proportions. It forms the foundation of a theory that is not viable in the wild.
Also very illuminating.
It will be a bitter winter in the USA.
https://www.tropicaltidbits.com/sat/satlooper.php?region=us&product=wv-mid
December was very warm in the north.
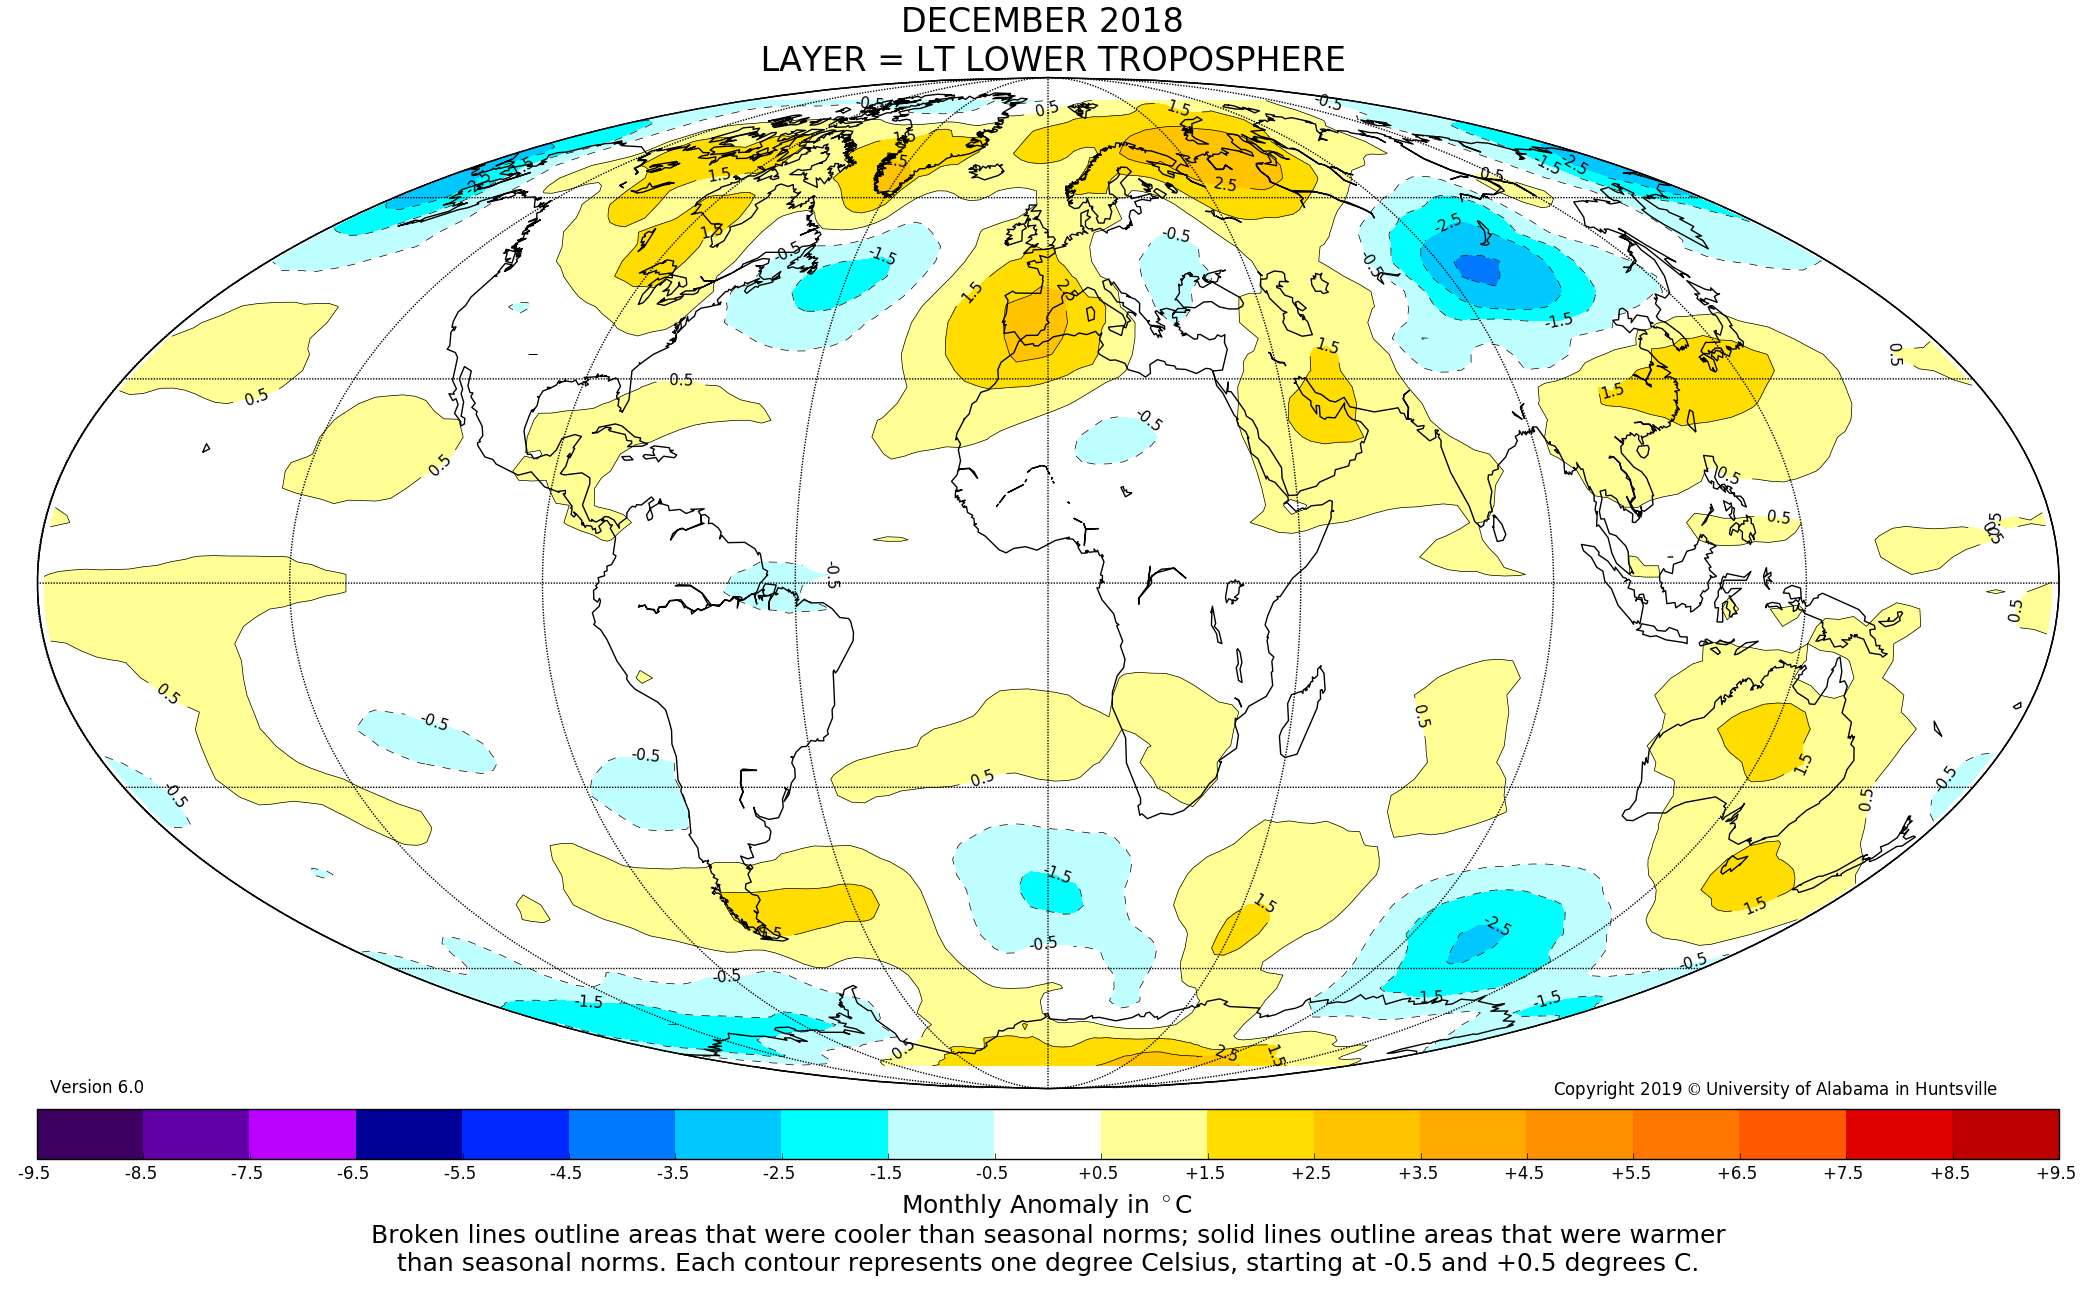
I just love that depiction, it shows the Atmosphere over North America was 1.5C warmer than normal, try telling that to all those with record breaking low temps and feet of snow. I can’t really see the old USSR areas, but they also had record cold temps as well.
It also doesn’t show the record breaking low temps in Brazil either.
It just shows the heat leaving the Atmosphere.
The surface was not so warm.

The only real question of worth is: Will there be enough ice in the Norton Sound for the Iditarod Sled Dog Race to go over? I’ll bet yes.
“I just love that depiction, it shows the Atmosphere over North America was 1.5C warmer than normal, try telling that to all those with record breaking low temps and feet of snow.”
And further above …
“One thing that you all have to remember about the Satellite data is that it is NOT measuring the temperature at the surface, it is measuring the brightness of the Atmosphere at the height where the Atmosphere averages -9.0C.
It is NOT what we experience at all and it is NOT the surface temperature.”
Compare and contrast.
Yes exactly.
AC : You sqid it yourself.
The answer.
Sat trop temps dont “measure” the surface.
Your “record cold’ could easily have occurred under that atmosphere. It is actually near average over most parts but Canada and the NE States.
Ever heard of a surface inversion?
Over a snow surface?
Oh, and snow is not a proxy for cold.
Ever heard of the CC relation and,the mysterious fact that warmer air can hold more moisture?
Hi Anthony,
what is your stance, precisely, regarding human contribution to climate?
what role does CO2 play?
what do you think is the most appropriate method to address your estimation of the current state and potential future of climate?
As a retired yachtsperson I love Valentia, the remote SW Ireland weather station with its very long data set. Without tampering it seems about 0.43C warming a century. Can live with that but not when ‘homogeneous ‘ with Paris.
Ype, don’t even go there with Berkeley’s final product, complete and utter nonsense for any island or coastal area when they smear the temperature the way that they do.
If it is the 6th warmest year, it means that there have been 5 hotter years in the last 40. This would suggest that it is getting cooler now.
See what the stratospheric polar vortex currently looks like at a pressure level of 10 hPa.
https://earth.nullschool.net/?fbclid=IwAR3AxTqHo_WT6BViWvaXVQTq4WlHIoMqewC_00P4mUw6xohoLICfPMG95JQ#2019/01/03/1500Z/wind/isobaric/10hPa/orthographic=-31.29,77.63,407
The new year starts with a significant pattern change and a strong Arctic cold airmass outbreak across the eastern half of Europe, including east-central Europe, Balkan peninsula, parts of Mediterranean and black Sea / Turkey region. After Jan 3rd, a few very cold days are expected over these areas with temperatures locally more than 10 °C below normal.
The current temperature (C) in California.

The temperature increases in the lower stratosphere.
http://ds.data.jma.go.jp/tcc/tcc/products/clisys/STRAT/gif/pole30_nh.gif?fbclid=IwAR1loya_Iauv8Gg0VdAJP2fwLoCwF_ZIkTnw5Ug2bO_mQQ1pxgdWcAHW2I4
You have to ask the question is that an Instrument malfunction?
It usually takes about 5-months for El Niño warming spikes to manifest in lower troposphere temps.
Since the current weak El Niño peaked in October 2018, UAH global temp anomalies will likely peak in a few months, and then fall steadily until the next La Niña cycle starts in 2020.
The next La Niña cycle should be a strong one since the last strong one was in 2010/11, and they usually occur every 10 years or so. If it is a strong one, UAH could hit -0.20C ~ -0.3C. At the same time, the PDO/AMO/NAO should all be in their respective 30-year ocean cool cycles, and the 50-year Grand Solar Minimum will start.
CAGW advocates will soon find it impossible to explain the huge and growing disparity between model projections vs reality..
I think so too. Everything seems to point to coming cool in the next few years.
I don’t like too much cool, I prefer heat, but I would gladly see it if it kills the co2 hypothesis once and for all.