(Apologies to Winston Churchill the brave Battle of Britain people.)
Guest opinion: Dr. Tim Ball
The Intergovernmental Panel on Climate Change (IPCC) and the people who formulated the structure that directed their research, constantly manipulated the data and the methods to predetermine the results. It began with the definition of climate change given to them as Article 1 of the United Nations Framework Convention on Climate Change (UNFCCC). This involved overstating and misrepresenting the amount of atmospheric CO2 currently, and in the past. It also included misrepresentation of its movement through the so-called carbon cycle.
You can pick any segment of the Carbon Cycle they show in Figure 1 (Their Figure 6-1, Fifth Assessment Report) and none of it is based on actual measures, that is real data; everything is an estimate and can’t qualify even as an educated guess.

Figure 1
As they explain,
Numbers represent reservoir mass, also called ‘carbon stocks’ in PgC (1 PgC = 1015 gC) and annual carbon exchange fluxes (in PgC yr–1)
What they should say is that every single number is a very crude estimate biased to support their claims of an unproven hypothesis that human CO2 is causing global warming (AGW). They must provide a bold disclaimer that they have no actual measurements of anything, there is no real data. They provide a vague disclaimer as Box 2.1 “Uncertainty in Observational Records” in Chapter 2 of the Physical Science Basis Report but this is misleading and deflects from the real issue.
The vast majority of historical (and modern) weather observations were not made for climate monitoring purposes.
So, even the weather data is inadequate or inappropriate. They must also say that virtually none of the other data even exists.
The black numbers represent the estimated reservoir mass and exchange fluxes for the time prior to the Industrial era (1750). That in itself is ridiculous. Even today, we have no idea of fossil fuel reserves. Saudi Arabia has consistently refused to disclose the level of its reserves. You would think people who evolved from the Limits to Growth crowd, would know with their failed “peak oil” contention not to rely on any global resource statistic. A standard project in my geopolitics class was for students to determine the amount of fossil fuel reserves in Canada and the world. They were stunned by the range of numbers they get. When you consider that the two supposedly most accurate estimates of world population (the US Census and the UN) differ by almost 6 million people (2011), you get a measure of the problem. We don’t have even close to accurate estimates today, let alone 268 years ago. But then, these are the people that tell you, with a frightening and utterly unjustified degree of certainty, that they know what the global temperature was in 1750.
I will only look at one segment of the diagram labelled Vegetation and Soils. I challenge anybody to give me within even 20 percent an estimate of the extent of world forests in 1750. However, the IPCC do just that.
The terrestrial biosphere reservoir contains carbon in organic compounds in vegetation living biomass (450 to 650 PgC; Prentice et al., 2001) and in dead organic matter in litter and soils (1500 to 2400 PgC; Batjes, 1996).
Remember, this was close to the nadir of the Little Ice Age (LIA). My research for central Canada, based on accurate maps, showed that the tree-line at the northern edge of the Boreal forest moved some 200 km between 1772 and 1972. This is a movement of 1 km per year in one of the harshest growing environments in the world. It also represents a massive addition to the biomass in just this vegetative type
One of the great natural paradoxes is that the tropical rainforest exists on the most impoverished soils in the world. Understanding why this occurs underscores why the IPCC claims are so wrong. Most people know there are two basic tree classifications, coniferous evergreen, and deciduous – leaves, no leaves. The tropical rainforest is both. It is never without leaves, but leaves are falling all the time and constantly being replaced. Without this condition, the forest could not exist. The climate has an annual precipitation of 2000 mm or more and year-round temperatures averaging between 20 and 30°C.
These conditions literally leach the soil of most minerals leaving only iron and some aluminum. This is the red laterite soils of tropical regions (Figure 2). Soils that if exposed by removal of vegetation, either erode rapidly in the heavy rain or bake iron hard in the tropical sun.

Figure 2: Laterite
Basically, the rainforest exists because it perpetuates itself. The leaves are continually falling and rot quickly to become nutrients for the tree. The two largest natural sources of CO2 are the oceans and the decomposing vegetation, the IPCC’s “dead organic matter.” There is a disturbing analogy to the IPCC process in this sequence. It produces the rotten data on which it perpetuates itself.
People of the tropical rainforests practice a unique agriculture that describes the process, “slash and burn.” They clear a small area and burn the material to provide enough minerals for a couple of years of cropping. They then abandon the area to allow regeneration on the small amount of organic material left behind. In the 20th century, three attempts to create large-scale agriculture in the tropical rainforests failed primarily because of ignoring the inexorable infertility of the soils.
The first was Henry Ford’s project to grow rubber trees in plantations in Brazil. It centered on a community called Fordlandia. The second failure was known as the Groundnut Scheme and involved a British government plan to ensure a supply of the most important agricultural product in the world, vegetable oil. Groundnut is the British name for peanut. Begun in 1950 in Tanganyika (Tanzania today), it lasted 10 short years, again primarily because of the soil situation. The third failure was the brainchild of American billionaire Daniel Ludwig. He believed the cold climate forests would not be able to meet the demand for paper from pulp, so he established a plantation of a rapid growing tree around a town called Jari, again in the Amazon basin.
Here is a quote from an article published in 2017 that breathlessly announces,
A study conducted by Brazilian and British researchers, published by Nature, showed that swamped areas in the Amazon rainforest produce between 15 and 20 million tons of methane every year – the equivalent of emissions by all oceans combined.
Did the IPCC extrapolate that data back to the 1750 level? Of course not! It, like the amount of CO2 from rotting vegetation under the Amazon rainforest, is just another vast unknown. The numbers used by the IPCC for CO2 from the oceans and rotting vegetation have an error factor that each alone exceeds the total human production. Despite that they claim that the annual increase in CO2 is, to use their terminology, very likely (90-100%) to account for the annual increase in atmospheric CO2 since 1950. This fits the Mauna Loa trend very nicely, but the measurements and instrumentation used there are patented and controlled by the Keeling family, first the father and now the son. These readings are the source of atmospheric CO levels used by the IPCC. The father was a fervid believer in human CO2 causing of warming, and the son is a member of the IPCC. Further, in a perverted twist to ensure false data quality control, the IPCC generate their own estimates of the annual production of human CO2.
If the oceans are the major source and sink of atmospheric CO2, then why doesn’t the warming El Nino events show up in the Mauna Loa record. A 2015 story about El Nino states,
El Niño has its fingers in a lot of pies this year: Not only is it helping to boost 2015 toward the warmest year on record but it is also a major factor in blockbuster hurricane activity in the Pacific and is contributing to a major worldwide coral die-off.
None of this proved correct.
Reportedly, a strong El Nino occurred in 1998 that pushed global temperatures to a high within the instrumental record. Why doesn’t it show on the Mauna Loa record when the seasonal variation of the vegetative cover appears quite strongly? (Figure 3)

Notice the source of this figure is the Scripps Institute of Oceanography. It is also the place of employment of Mauna Loa patent owner Ralph Keeling and the promoter of AGW alarmism Naomi Oreske (Figure 4). Where is the reflection of CO2 increase due to the dramatic ocean warming and temperature increase caused by El Nino?

Figure 4: Keeling, Oreske, and Talley Photographed at Scripps after notification of Nobel Prize.
The entire AGW hypothesis is the biggest deception in history. It is no surprise that it is built on the biggest deception about actual data. The open and blatant representation of all the data in the IPCC Reports as real data is beyond shameful.
It is appropriate that the IPCC Fifth Assessment Report includes an obituary to Stephen Schneider. He began and attempted to justify the idea that dishonesty was necessary to promote the false story about AGW in a 1989 quote.
On the one hand, as scientists we are ethically bound to the scientific method, in effect promising to tell the truth, the whole truth, and nothing but — which means that we must include all the doubts, the caveats, the ifs, ands, and buts. On the other hand, we are not just scientists but human beings as well. And like most people we’d like to see the world a better place, which in this context translates into our working to reduce the risk of potentially disastrous climatic change. To do that we need to get some broad-based support, to capture the public’s imagination. That, of course, entails getting loads of media coverage. So, we have to offer up scary scenarios, make simplified, dramatic statements, and make little mention of any doubts we might have. This ‘double ethical bind’ we frequently find ourselves in cannot be solved by any formula. Each of us has to decide what the right balance is between being effective and being honest. I hope that means being both.
The second last sentence is false, like the data used by the IPCC. What he really means is, if you study climate science you have to decide whether to be honest or dishonest. We know, from the unreal ‘data’ they present as real data, which one they chose.
Also this
https://chaamjamal.wordpress.com/2018/05/31/the-carbon-cycle-measurement-problem/
good job.
In a round about way.
Jamal,
The uncertainty of the natural CO2 flows is of zero interest if you look at the mass balance:
Increase in the atmosphere = human emissions + natural emissions – natural sinks.
4.5 GtC/yr = 9 GtC/yr + X – Y
X = Y – 4.5 GtC/yr
If:
X = 10 GtC/yr, Y = 14.5 GtC/yr
X = 100 GtC/yr, Y = 104.5 GtC/yr
X = 1000 GtC/yr, Y = 1004.5 GtC/yr
Thus even without knowing any individual CO2 flux in or out, all natural inputs together are smaller than all natural outputs together, every year in the past 60 years. Thus nature can’t be the cause of the CO2 increase, whatever the change in any or all natural CO2 fluxes…
You state:
“My research for central Canada, based on accurate maps, showed that the tree-line at the northern edge of the Boreal forest moved some 200 km between 1772 and 1972. This is a movement of 1 km per year in one of the harshest growing environments in the world.”
It begs the question of how much further north has this moved since 1972?
That would provide a useful comparison of the rate of any actual “climate change” compared to IPCC claims etc.
Please excuse my pedantry, but you mean “raises” the question, not “begs” it.
Begging the question is the name of a logical fallacy, which basically means assuming that which you intend to prove.
” but the measurements and instrumentation used there are patented and controlled by the Keeling family, first the father and now the son.”
Patents expire after a few years (In USA it is currently 20 years after date of filing)
Jim
I’ll try this again as my earlier comment seems to have disappeared into the lost comments black hole. Forgive me if it pop’s back up again.
My understanding is patents can be renewed indefinitely.
HotScot
US patents are valid for 17-20 years, depending on filing date and issue date. So the patent on the IR sensor for CO2 determination has presumably expired. If I remember rightly, Keeling began his work in ~1958.
The patent part is irrelevant, it is the control that matters.
Here is a lot of information on how the measurements are made: https://www.esrl.noaa.gov/gmd/ccgg/about/co2_measurements.html
That is correct, for those who file for patents once.
Companies, businesses, individuals, etc., whose finances depend upon controlling use of their intellectual property have reasons to ply every trick necessary to keep their patents primary and controlled.
While, officially, patents are term limited, in practice, patent owners learn to manipulate the Patent Office and Patent Law.
At the root of this is the Patent Office bureaucracy where patents are processed by patent clerks. Patent clerks that are not experts in the technology area, but are experts in patent fields and patent process.
A bureaucracy that issues new patents for the same technology based on patent applications alleging new materials, new process changes, changes in design, even changes in usage.
This allows entities to maintain patent control for mechanical, drugs, plants, technical areas, etc. long after original patents expired. These same entities, often pursue aggressively alleged patent infringements
If you modify the original product, you can get a patent on the modification. Even that strategy isn’t guaranteed to work. Still, drug companies find ways to abuse the process. link
The spirit and intent of the law is that patents expire.
There are circumstances under which a patent can be extended – where it took time to bring the product to market. I know of one such case for interlocking pavers (bricks). Those zig-zag ones. They obtained an additional 3 years (total 23) on the basis they were unable to commercialise it for the first three. It was worth millions to have that protection because it was widely licensed.
Patents may not be renewed. Where did you get the idea that is possible.
USPTO says: “First, whoever invents or discovers an eligible invention may obtain only ONE patent therefor.”
Walter Sobchak
Patents may not be renewed. Where did you get the idea that is possible.
USPTO says: “First, whoever invents or discovers an eligible invention may obtain obtain only ONE patent therefor.”
—————-
But in some special cases it could be possible, for some inventions to still be fully controlled even after the time of patent or outside the means of the patent protection.
For example when the invention technically is a novelty but a process that can be described mathematically, and being the main only way to make the invention productive is not legally protected by the patent itself, but later on can be protected by a copyright in a software that it could belong, and for as long that there is proper new software versions, new copyright can be invoked….so the control maintain and extended.
Not very sure but this may be the case here, I think…..like with the M. Windows OS.
cheers
As far as I know, Keeling didn’t have a patent on the NDIR method itself, as that was already on the market (*). What he did invent was the frequent automatic calibration technique to avoid the necessary sample fow conditioning for a simple, robust apparatus which could work for months without much maintenance.
In the first decades Scripps/Keeling was the only supplier of extremely accurate calibration mixtures for the above. Since 1995 it is the WMO. Keeling/Scripps is not involved anymore, but still has its own standards and sampling. Monitoring at Mauna Loa and several other stations is under supervision of NOAA, not Scripps/Keeling.
(*) From his autobiography (very interesting read!):
http://scrippsco2.ucsd.edu/assets/publications/keeling_autobiography.pdf
I had briefly investigated some commercially available instruments that could measure atmospheric CO2 continuously.
“The Intergovernmental Panel on Climate Change (IPCC) and the people who formulated the structure that directed their research, constantly manipulated the data and the methods to predetermine the results.”
Unsupported arm-waving bollocks. And downhill from there.
Can you back up your assertion with data ?
If not, is that what they refer to as “pot kettle black” ?
You might want to remember a little situation called “ClimateGate” by the way …
You can start with the deletion of the pre 1979 Arctic ice to show that it has been declining when the earlier IPCC report showed less ice in 1974.oin the discussion…
Indeed. This is from IPCC First Assessment Report, pp.224-225 (I added the red circles); data starts in 1973 (Nimbus 5):
http://sealevel.info/ipcc_far_pp224-225_sea_ice2_1979circled.png
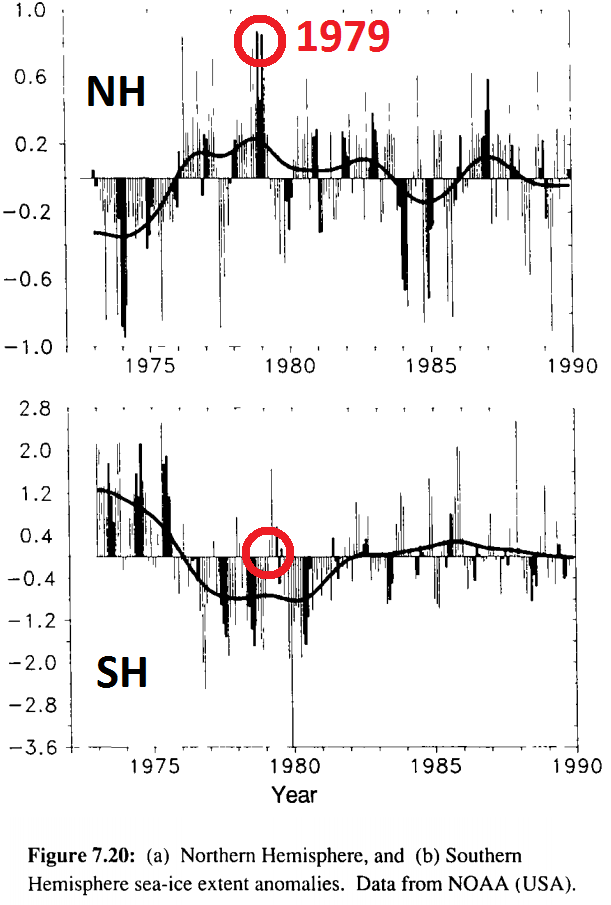
Starting with the Third Assessment Report, the IPCC’s Reports start their sea ice graphs with 1979 (Nimbus 7). Problem solved.
Now, as it happens, the Nimbus 7 multi-channel passive microwave radiometer was superior to the Nimbus 5 single-channel instrument, so I assume if you asked the IPCC authors why they ceased showing pre-1979 data that’s what they would tell you. But it is awfully convenient for supporting the CAGW narrative.
zazove
Usual refuge of the alarmist scoundrel.
No science, but plenty of bluster.
JBNL1972, impossible to refute arm-waving, nothing of substance to refute…that’s what makes it bollocks.
“No science, but plenty of bluster.”
Ball’s post? Oh, I know.
We’ll take that as a “no”, then.
Wonderful thing about trolls — always demanding links, evidence, proof. Totally incapable of anything other than abuse when asked to justify their own “unsupported arm-waving bollocks”.
” always demanding links, evidence, proof” and when it turns out none exists they are branded a troll. The nerve of these demanding trolls.
Its Ball publicly spouting fabulous claims not me. I’m just calling bollocks when they are dangled in my face.
Ball is clear — there is no evidence to support the 250+ years ago data they are claiming.
If you are so sure there is then provide your evidence. You can’t simply argue that claiming a lack of evidence for something is bollocks and not refute the claim with evidence of your own unless you want to be branded a troll.
Simple as that.
Nope. Ball made the accusation. It’s incumbent on him to back it up with evidence.
Wait… How does one ‘back up’ a lack of evidence with evidence?
If you think it’s ‘bollocks’ all you would need to do is show some evidence.
There is a minor little thing called “burden of proof”. and who it lies on. Try contemplating Popper.
Translation: I can’t refute it, so I”ll just pretend I don’t have to.
Pathetic little narcissist. Talk about the pot calling the kettle black.
You are correct, it is impossible to refute arm-waving …. which nicely explains the longevity of the IPCC =)
Thank you for confirming this!
That’s the problem with science.. you can disprove something right there in front of someone’s face – falsify it utterly, but unless they comprehend the philosophy of science it means nothing and they revert to some other logic system that suits them
It can only get worse when the subject uses inductive logic mixed with science .. The IPCC claims to be scientific, just as economists claim to be scientific , and they mixed grains of science with heavy doses of politics and while the scientist may argue the facts, the opponent argues the politics.
The truth of it can be seen clearly by the person applying the philosophy of scientist, but the political animal uses their quite different logic system to justify their stance too. I picture a checkered board – two players, one with chess pieces, the other with checkers.. Both shouting at the other, both trying to convince – but the scientist is at a distinct disadvantage as the opponent is not bound by strict rules and can change them on the hop to suit themselves.
We’ll never get it through their heads, they’ll grab bits of ‘science’ and dash about like a terrier with a sock, yapping and growling and completely misunderstanding the point of it all is knowledge and NOT “winning”.
This can’t be resolved with science, all we can do is tackle each idiot action with as much evidence and energy as we can afford and hope to stave off some disaster as the mob dashes toward the cliff edge shouting ‘exciting!’ ‘fun!’ but ultimately they choose the course, we as the minority are just along for the ride.
People learn best from seeing ‘say it and I’ll hear it, show me and I’ll understand it’ – and science won’t do it for them. They’ll only get it when somewhere like South Australia to my East has it’s economy crash and burn or the grid collapses and thousands of former-first wolders die for no good bloody reason. Of course The Masses will need to see this happen a few times (good lord, look a the whole socialist experiment – Pol, Ad0lph, Uncle Joe, Meow.. yeah it’s always ‘they’re so cool’ at the getgo, ‘aw they were bad apples’ at the end) but eventually they’ll get it.
zazove: There are numerous posts from Dr. Ball concerning IPCC data and methods. https://wattsupwiththat.com/2017/01/ipcc-objectives-and-methods-mandated-elimination-reduction-manipulation-of-inadequate-real-data-and-creation-of-false-data/ with links to others therein.
You are referring to Ball’s opinions and theories about the cause of recent global warming? They’re unsubstaniated, unmitigated bollocks. Now I know why they call him Ball.
^^ And here we see the AGW fascist propaganda tactics. Nothing to bite on, just personal attacks.
Not a single post outlining exactly where he thinks Ball is incorrect and providing evidence as to WHY he might be so. Just attack the person and hope nobody notices his blatant violation of normal rules of debate and science.
He’d have gotten a ‘fail’ in every debate I was ever in at high school.
That the data has been manipulated is admitted to by those who did it.
They claim it’s justified, but for the most part they refuse to show how and why they did it.
On the other hand, the fact that you are either unaware of this basic fact or chose to pretend you aren’t, is just more evidence that you will say whatever it takes to protect your religion.
“they refuse to show how and why they did it.”
More unsubstaniated, unmitigated bollocks. Google it if you don’t know something.
>>Where is the reflection of CO2 increase due to the dramatic ocean
>>warming and temperature increase caused by El Nino?
Tim,
A good point. However, other CO2 records also show no modulation during el-nino events. This graph is from Australia, but CO2 ends up mixing worldwide after a year or so.
http://cdiac.ess-dive.lbl.gov/trends/co2/csiro/CSIROCO2CAPEFERGUSON.JPG
.
So lets us assume for a minute that the Mauna Loa data is roughly reliable, how can the variable sea temperature NOT result in a variation on CO2 concentrations? The oceans are the major
resevoir for CO2, so a change in sea temperature should result in a change in CO2 concentrations.
Are the seas not absorbing and relasing as much CO2 as calculated? Are the seas respiring the other atmospheric gasses at the same rate as CO2 ? (instead of selectively absorbing CO2).
More importantly, how does the IPCC explain there being no atmospheric CO2 changes, during major sea temperature variations?
Ralph
Ralf
Isn’t Mauna Loa an active volcano?
*[Mauna Loa] “is one of five volcanoes that form the Island of Hawaii in the U.S. state of Hawai’i in the Pacific Ocean. The largest subaerial volcano in both mass and volume, Mauna Loa has historically been considered the largest volcano on Earth, dwarfed only by Tamu Massif. It is an active shield volcano………”
Strange place to site a CO2 monitoring station.
*Reference from Wikipedia. I don’t usually rely on anything from there, but for a thumbnail sketch it’s sometimes useful.
Yes, Mauna Loa has volcanoes, but they reputedly only take measurements during anticyclonic weather systems, when the air mass is descending. Thus they should be monitoring the upper air-mass CO2 concentrations, and not the lower air mass concentrations.
R
“So lets us assume for a minute that the Mauna Loa data is roughly reliable, how can the variable sea temperature NOT result in a variation on CO2 concentrations? The oceans are the major resevoir for CO2, so a change in sea temperature should result in a change in CO2 concentrations. ”
Not that simple. An equatorial water already hot enough to be practically devoid of CO2 and absorb close to nil, won’t show any difference if it gets hotter because El Nino.
“Not that simple. An equatorial water already hot enough to be practically devoid of CO2 and absorb close to nil, won’t show any difference if it gets hotter because El Nino.”
Interesting. How warm does the ocean have to be to be devoid of CO2?
When there is an El Nino, what we see is warmer SST (in the El Nino region), but that does not necessarily mean that the ocean is warm, in absolute terms (as opposed to being simply anomalously warmer than usual), and more significantly what volume of ocean is impacted.
Are we only talking about the top cm, 10 cm, 50 cm, 1 m, 2 m etc of the ocean being warmer than usual. The volume could be relatively small if only the top cms are affected, and hence it could be that there would not be that much more out gassing in El Nino conditions.
If the volume were small, it wouldn’t have the heat content to impact the whole world temperature as it does.
“How warm does the ocean have to be to be devoid of CO2?”
It will never be devoid of CO2; boiling water still has some CO2. However, to be practically devoid of CO2 as far as outgassing is concerned, 25° is enough. At this point, it already has outgassed ~90% of what it would outgas if heated to 35°. See ref below
paqyfelyc
It is not correct to hold that warm ocean water is devoid of CO2. The rising water that feeds the El Nino is from below the surface (carrying a lot of upwelling fish food), and there it has a higher CO2 load than water near the surface. The temperature of the ocean at the surface does not ‘change’ during an El Nino save to cool down. It rises up warm – having been pulled from the Western Pacific. I recommend Tim Ball’s excellent graphics on these large scale flows around the Pacific.
When it rises it fizzes into the atmosphere, just as elsewhere. It stops fizzing when it reaches equilibrium with the air via well known mechanisms.
There is so much CO2 in the deep oceans that in places is it pooled into a liquid and has been photographed on the ocean floor.
You miss my point.
deep cold CO2-saturated water will lose ~half of its CO2 content when warming from 4° to 25°C at the surface. From this point on, its loss of CO2 because of lower solubility will be less and less noticeable. 5% of the original content for a warming from 25 to 30, and smaller and smaller decrease in CO2 content will happen as water warms more, until still 15% of original content are in the water when it starts boiling.
There is a big difference between cold water and “hot” water. There is no sensible difference between the CO2 content of the various flavour of “hot” water, whether it is 25° or 35° doesn’t really matter.
http://sites.chem.colostate.edu/diverdi/all_courses/CRC%20reference%20data/solubility%20of%20carbon%20dioxide%20in%20water.pdf
The relationship between temperature and CO2 outgassing is not that simple.
Why is the Cape Ferguson CO2 data a chaotic graph when the Mauna Loa graph is a non chaotic graph. Both show a clear trend upward but the Mauna Loa data look contrived.
So what. Atmospheric CO₂ measurements are confirmed at several places all over the world by different organizations, and you have produced no evidence that they are incorrect.
Javier
I don’t think the inference is that the readings are wrong, I think Tim is suggesting there is a collusive relationship between the Keelings, people like Oreske, and the IPCC.
HotScot, the “but” in the first phrase indicates an objection to the atmospheric data based on who does the measurements, their supposed beliefs and their affiliation. That is not science, it is the type of thing alarmists engage on.
There are no serious scientific objections to atmospheric CO₂ measurements. It is one of the few things in climatology of which we can be quite certain, and it is thanks to Charles David Keeling. He did everything right to establish a measuring system so early that we can trust. He was a great scientist and very open-minded. His last works were on the effect of tides on climate change.
This type of smearing tactics of attacking the scientist instead of the hypotheses and the evidence is one of the things I hate most from the warmist movement, so I don’t like seeing the same tactics from Dr. Tim Ball.
I full agree with you on that, Javier. The measurements and trends have been verified by too many people for them to be blatantly wrong regardless of the “exact” values provided by Scripps and Mauna Loa. I don’t think it’s in anyone’s interest to start casting aspersions about a conspiracy on the general trend and progression of the atmospheric CO2 value. That path is certainly NOT the path of science and serves only to undermine our position against those who cook the books for a living.
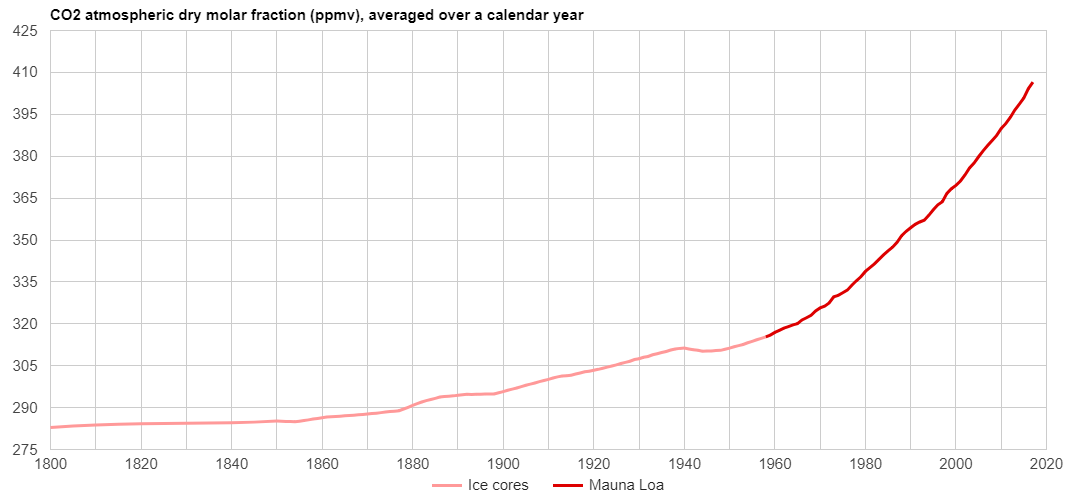
I have an objection to CO2 measurements, not how it is measured on Mauna Loa or elsewhere but for the fact that CO2 has only been measured since 1953. That data is then compared to proxy data of the past as if somehow it has the same accuracy as the CO2 measured by instruments over the past 65 years. When the AGW crowd take their data comparisons back hundreds of years it becomes shear fantasy.
1. A nit: the Mauna Loa CO2 measurements began in March, 1958, not 1953.
2. The “proxy data” for CO2 are not garbage data like Mann’s silly tree ring proxies for temperature. They are actual CO2 measurements, made with modern methods, of air samples taken from air bubbles trapped in ice cores.
The main problem with them is that the process through which snow is compressed into ice on the ice sheets “smears” the air samples from multiple years. So, even though you might be able to date an ice layer to an exact year, you can’t say the same thing about the air bubbles trapped in it.
I’ve also seen concerns that biological activity from cold-tolerant microbes could affect CO2 levels in the air bubbles.
But, despite those limitations, general opinion, which I have no reason to doubt, is that the pre-1959 CO2 level data from ice cores is probably pretty good. It’s not as good as the 1958 & later Mauna Loa direct CO2 measurements, but it is certainly wrong to call it “shear fantasy.”
In my graphs I use a lighter color to distinguish the ice core data from Mauna Loa measurements:
https://sealevel.info/co2.html ⇦ interactive version, w/ references & data links
HotScot,
If the CO2 measurements are correct, then the complaint about “a collusive relationship” is a non sequitur. That is, whatever the ideological position of Keeling et al., it is not affecting the measurements reported.
(fwiw, keeling was a republican)…
Nice attempt to divert the discussion from a post aimed at the IPCC to something else. I’ll give you a two thumbs parallel for it, but not up or down, just parallel. A good idea, just didn’t work out.
“…CO2 measurements at other sites, with no possibility of contamination, corroborated that the rate of rise seen in the Mauna Loa record was global”
~ Charles Keeling
Thank you Dr Ball. I always read carefully all your articles. You are my go-to source for learning about 1)the science of climate and 2)the politics of the climate-change-scam.
This is all rather exaggerated. Tim’s main point appears to be that, since we do not know things precisely, we do not know anything at all. Few things in life are known with great precision and accuracy, particularly those things that matter.
Humans are pretty good at dealing with imperfect information. We would have long gone extinct if we were not.
Climate policy is just another case of decision making under uncertainty. We know how to do that.
“decision making under uncertainty. We know how to do that.”
Yup, toss a coin, preferably a double headed one with Heads I win and Tails you loose thrown in for absolute certainty of outcome.
Track record of humanity decision making isn’t that good. It is rather awful, actually, and only severe Darwinian pressure put humanity in a more sensible path, but this takes decades to centuries.
People that have “Skin in the Game”, i.e. some personal risk associated with the decisions, get immediate feedback when they are wrong. A financial trader risking their own money will find out quickly if they make a bad investment. A plumber that can’t fix a leak looses customers and goes out of business. However, an academic or a researcher that gets paid regardless of results doesn’t receive feedback that their ideas are bovine excrement, so they don’t learn. Dr. Nassim Taleb’s book “Skin in the Game” goes into this in some depth, with examples from financial markets, foreign policy, medicine, etc., etc..
Clearly, humans make mistakes individually and collectively. However, that fact that we are still around would suggest that we either make fewer fatal mistakes than correct decisions, or that we have a tendency to make conservative decisions that have more survival value than the alternative. That is, a concern about rustling in the grass being a predator, might well lead to death if it is dismissed as being the wind when it actually is a predator. On the other hand, assuming that it is a predator, and taking appropriate actions, will probably result in one living another day, regardless of whether it was the wind or a predator.
Humans are pretty good at dealing with imperfect information – computers however are not especially when humans have programmed the computers to carry out vast recursive processes that iterate their way into the far future. Just ordering a calculation the incorrect way will end in wildly incorrect figures, moving from floats to fixed point similarly (as Lorentz showed) gives wildly differing results, inputting finger in the air guesses potentially orders of magnitude wrong into iterative climate models, is either foolish by someone not knowing what they are doing or deliberate in order to deceive.
I think Tim is saying that a major part of the shell game is to construct a roughly correct model of the current climate system, with various ingredients, then insinuate without proof that this model can predict with great precision what will happen when a few of the ingredients change.
Humans are terrible at dealing with things they don’t know precisely especially in science. Just walk back thru the literature and junk published about QM and GR until LIGO and the LHC slammed doors on some of the stupidity.
1 – Societies rise and fall. People and countries make grave mistakes all the time and suffer accordingly.
2 – Experts are not to be trusted unless they are doing things that can be practiced and perfected. You can trust brain surgeons and engineers. Folks who purport to predict the outcome of chaotic systems are no more accurate than dart-throwing monkeys. Don’t believe that experts, especially economists, should be given the levers of power.
3 – Did you know that most published research findings are wrong? A large part of the time, the original researchers can’t even reproduce their own experimental results.
4 – Climate science is not just another case of decision making under uncertainty. Its apocalyptic predictions have consistently been wrong. It is a standout example of how research has been perverted. link It is corrupt.
Exaggerated?
Exactly which component did Dr. Ball exaggerate and by how much, exactly?
“Climate policy is just another case of decision making under uncertainty. We know how to do that”
That’s utter BS!
Yes, the world’s leadership is rife with leaders who make momentous decisions based upon ten seconds of information.
The world is also rife with examples where those decisions harm citizens, finances, employment, relations, etc. etc.
A major problem with leaders who decide issues based on ten seconds worth of information is that they, unfailingly, refuse to apologize and never reconsider their past erroneous decisions.
With very few exceptions, most situations require detailed accurate information along with clear understandings of a decision’s impact to all people and process!
Climate alarmism is proof of bad decisions that are based upon inadequate or just plain bad data.
No, you are so wrong. That implies that the people involved think they are doing the right thing.
They don’t even care* if it’s the right thing. It makes them richer and more powerful.
That is all they care about.
Anthony: please fix this silly small italic bold font issue!
When you decide to get married, have a child, accept a job offer, withdraw from the Iran deal, reduce the tax rate, or force the power grid to buy coal, you do not know (with any precision or accuracy) what the consequences of that decision will be. Yet, we make those decisions.
The notion that you need to know with a certain level of precision before you can make up your mind is just nonsense.
Similarly, we do not know with any precision or accuracy what the consequences will be of our choices about energy use. Yet, we can and must make a decision. A decision to leave things as they are is a decision too.
No, we don’t need to make a decision. Small individual choices are not the same as broad collective decision making. Central Planners are notoriously full of hubris. Let individuals make their own choices, thereby distributing the risk and maximizing the ability to adapt.
It has been said “To not make a decision is to make a decision.” That is, the default of not making a decision is the status quo.
1/. Making a decisions is not ‘making up your mind’
2/. The art of making decisions in states of deep ignorance is only taught in one place that I know – the military.
– make a plan
– define desired outcome
– reconnoiter the enemy
– revise the plan accordingly
– make a preliminary start
– if info wrong, retreat in good order, regroup and revise the plan.
NONE of this is what the climate alarmists are doing.
They are either incompetent or the desired outcome is in fact something other than the stated one.
Or both.
Dr. Tol, there is uncertainty, and then there is blind guessing. The IPCC is indulging in the later, and economists who think they can use IPCC “data” to guesstimate the supposed economic harm that will result from increased CO2 levels and increased temperatures are indulging in fantasy writing.
Dr. Tim. You forget that the Pre-colombian Amazon Indians farmed the Amazon very extensively and successfully.
Agreed, Grey.
Unfortunately, that understates the situation where the Pre-Columbian Amazon basin was host to a large human population.
Alleged virgin Amazon Jungle is not truly virgin, but regrown jungle after disease wiped out substantial portions of Amazon populations.
This does not change the Amazon’s nutrient poor soils situation, but it does change the gross assumptions and beliefs that once the Amazon jungle is cut, jungle regrowth is impossible.
A claim that ignores ruin after ruin discovered under massive jungle regrowth.
Mass modern era commercial farming ventures that failed in the Amazon represent bad decisions based on bad data and faulty understanding.
Didn’t you read it? He told you about slash-and-burn.
For a very good discussion about actual worldwide CO2 data from the OCO-2 satellite, I might suggest Euan Mearns 2015 discussion and CO2 maps.
http://euanmearns.com/co2-the-view-from-space-update
Scroll down to “Task 2” and look at the four world maps, giving the seasonal cycle of CO2 for 2014. These are interesting, for they back up some of what Tim is saying, and undermine the IPCC position (that man is a major source of CO2). Which may be why NASA refused to make these maps public, and they had to be produced privately.
Red is more CO2. Blue is less CO2.
The four world maps show:
1. NH autumn shows blue and green all over the planet, so CO2 is low in a NH autumn (just as the Mauna Loa data suggests). Note that there are no real red hotspots, matching the world’s industrial centers. There is a small smudge over China, and that is about it (but this is no bigger than the smudge over Iceland).
2. NH winter is beginning to show some red CO2 outgassing. But these red areas are coincident with NH forests, as much as urban centers. Look at the large red swathe over Africa, where there is no industry, and no power stations, and no gas and oil heaters keeping the people warm in the NH winter. This does appear to be biological CO2, rather than industrial. Note also that the southern seas are drawing in CO2. This is the opposite of what ‘should’ happen, as this is the southern summer, and the warmer seas there should be outgassing CO2 (according to the marine solubility argument). But they are not, the warm Southern seas appear to be absorbing CO2, possibly due to biological activity (algal growth, and other photosynthesisers).
3. The NH spring show a riot of CO2 outgassing, that matches the position of the boreal forests. This must be the warmer soils promoting bacterial decay in the soil, and outgassing CO2, while the trees and crops are not yet growing enough to counter this. Clearly this is organic CO2 production, and nothing to do with man. NH fuel consumption for heat, light and energy, peaks in the winter, not in the spring. Note that the southern seas are still drawing in CO2, instead of outgassing it, as the ‘should’.
4. The high NH summer. Now this is interesting. We have a massive draw-down of CO2 in the NH, as vegetation grows and absorbs CO2 (with CO2 being a primary plant food, and the most essential gas on the planet). However, note that the rapidly warming Arctic Sea is not really outgassing – at least not enough to overcome the huge NH biological CO2 sink. Note also that the major manufacturing centers of the world are still not producing any real CO2 hotspots. Perhaps a small blemish over California, with all their airconditioners going, and a smudge over China. … More importantly, note that the Southern seas are now outgassing CO2. This is the southern winter, when ice sheets are extending out from Antarctica, and doubling its size. And yet instead of the cold seas absorbing CO2, they are outgassing it.
.
The standard ocean-CO2 cycle appears to be somewhat in error (the Wiki version that is – I have not looked at any peer-review papers on this).
The ocean-atmosphere CO2 balance (the marine CO2 pump) is comprised of three elements: Solubility, Carbonate, and Biological. At a guess, it would appear that the biological pump is larger than the solubility pump, and that very cold waters are reducing biological activity and allowng decay and a release of CO2. I don’t know enough about the Antarctic biological cycle to know if that is even possible. Perhaps someone else might be able to give a more considered opinion.
Nevertheless, this does seem to suggest that the marine CO2 solubility pump is not as strong as advertised. Is this why the el-nino does not produce a significant effect on Mauna Loa CO2 concentrations? Is one of the major modolators of atmospheric CO2 rather ineffectual?
The OCO-2 data for the last 2016 el-nino would demonstrate what happened to CO2 concentrations above the Pacific during this great oceanic warming episode. But I cannot find any data or maps for these years.
Ralph
Excellent post, Ralph. Thank you.
I would like to see more discussion on this topic.
I don’t buy the solubility argument either, because obviously marine life mess a lot with CO2. The solubility-temperature relation only controls the absolute level of CO2, but not the flux. So, while a temperature increase will reduce the quantity of CO2, it could also drive or just coincide with an increased photosynthesis so that an intake of CO2 actually occurs, instead of the outgassing predicted by chemical balance argument.
Complicated matter here.
This is true, in a simple system where only the solvation reaction happens; such as: O2 (gas) -> O2 (aq). In a buffered system, this isn’t strictly true, as you state. In a buffered system, you have to consider the kinetics of all of the relevant chemical reactions that are occurring alongside solvation. In other words, the pure solvation Henry’s law relation must be modified; and the Henry’s law relation itself depends on the solvent and the soluent.
Ralph, you commented, “Perhaps a small blemish over California, with all their airconditioners going.” Keep in mind that most of California is essentially a Mediterranean Climate, with really only two seasons.
Ralph,
Indeed, vegetation is the dominant factor in the seasonal exchanges, not the oceans.
Estimates of the exchanges in the IPCC graph are not based on wild guesses, but on measurements of O2 and δ13C over the seasons. O2 changes with the oceans are relative small from its solubity by temperature changes only, but large by plant growth (ocean + land) and decay. That, together with the δ13C changes (opposite for plants and oceans) allowed to calculate the overall seasonal exchanges: about 50 GtC/season between atmosphere and oceans and about 60 GtC/season between atmosphere and vegetation in opposite direction of the ocean exchanges. Net result: about 10 GtC (5 ppmv) global change over the seasons. NH vegetation dominant, SH in opposite direction.
See: http://science.sciencemag.org/content/287/5462/2467
Besides the seasonal fluxes, one has a continuous CO2 exchange between upwelling zones at the equator and sink zones near the poles: that is estimated at about 40 GtC/yr, based on the “thinning” of the human low δ13C “fingerprint” and the rapid decline of the 14C levels after the nuclear tests of the 1950’s.
Bollocks I am afraid. AGW is going to cause huge economic losses and this last chance saloon to reduce CO2 ppm and reduce global temperatures. Believe anything different and you should be a participant in the Mad Hatters Tea Party.
“BELIEF IN AGW is already causing huge economic losses”. There, fixed!
Last chance! , oddly there has been a great number of those so perhaps a new name is required ? Perhaps ‘the end is nigh ‘ , but never saying why ‘nigh’ will be , a classic of the sandwich board religions types but no less scientifically accurate than most of climate ‘science ‘ and its ‘heads I win , tails you lose ‘ approach.
As impossible as it is to prove that we are causing warming, it’s beyond idiotic to claim that against thousands of years of evidence, warming is harmful. Not only is it patently false from a biological perspective, but historically, warming led to abundance of life, successful agriculture, civilization and increases in human population. Cooling, on the other hand, led to famines, diseases, wars, barbarism and population declines. In case after case, without exception. Any reason why things are different now, Mad Hatter?
Just how many of these mythical “tipping points” and “last chances” do we have to slog through again? I think we’ve long passed the Prince Charles “100 months” decree haven’t we?
“to reduce CO2 ppm and reduce global temperatures”
You do realize when CO2 levels went from 300 to 400…temps should have increased by much more than 1 degree
And even at ~410 ppm, CO2, measured to the nearest one-tenth of one percent of the atmosphere, is zero.
Indeed, a trace gas.
And not a manifold threat – not a clear and present danger, if you will – to civilization and human life.
In contrast to the green-cased Reds, who seek to eliminate most of the present population – leaving no more than 750 million [present population 7,628,440,363 per http://www.worldometers.info/world-population/#top20 a few moments ago].
And most of the rest are to be peons or concubines.
A dimmish outlook for non-watermelons!
Auto
Can you provide some evidence to support your belief that AGW is going to cause massive hardship?
The only evidence I have ever found is that more CO2 is an unmixed blessing.
Warmer temperatures means more crops can be grown.
More CO2 means that plants grow bigger and stronger and use less water.
What’s not to love.
BTW, Why didn’t the world die back when CO2 levels were above 5000ppm?
The internet has greatly expanded the number of dotards figuratively holding “The end is nigh” signs.
ivankinsman,
Thank you for your opinion. Now, do you have anything to present to back up your opinion, or was it from divining tea leaves?
One of the inconvenient truths revealed by the Orbiting Carbon Observatory-2 is the high CO2 concentration in the Amazon Basin. https://www.earthmagazine.org/article/new-satellite-maps-carbon-dioxide-sources-and-sinks-high-definition
I suspect that methane is even worse.
Be careful when you interpret the false color scheme used to depict CO2 concentrations in these OCO2 renderings. In these plots CO2 varies mostly by a few percent from 400ppm, maximum plus or minus 3.75%, but on average less than 1%. (See legend at bottom of each plot to interpret to colors in terms of ppm).
Compare CO2 to H20 vapor concentrations, which average around 5000ppm, but can vary from zero to 50000ppm, depending on altitude, temperature and the weather/climate.
So I would say CO2 is indeed ‘well-mixed’, compared to H2O (which has a bigger effect on climate than CO2, of course).
I think the vivid contrast of these CO2 plots are designed to accentuate small changes, creating an ‘unmixed’ illusion
Why inconvenient? CO2 is pretty well mixed, but not perfectly, hence the source regions will have a bit more concentration than the sinks, especially in regions with light winds.
The quote is from 1975 `Endangered Atmosphere’ Conference: Where the Global Warming Hoax Was Born
Margaret Mead president of the AAAS :
“What we need from scientists are estimates, presented with sufficient conservatism and plausibility but at the same time as free as possible from internal disagreements that can be exploited by political interests, that will allow us to start building a system of artificial but effective warnings, warnings which will parallel the instincts of animals who flee before the hurricane, pile up a larger store of nuts before a severe winter, or of caterpillars who respond to impending climatic changes by growing thicker coats.”
Schneider, Holdren,Woodwell were all there. Lovelock too, later pro-nuclear.
The high performance computing available today only accelerated the hockey-stick – their dream toolbox. High frequency trading, the City’s dream machine, is at the same time about to blow their financial system – another hockey stick already patched together in 2008.
Instead of the AGW theatrics – watch that financial implosion . It is really dangerous. It is no surprise the Italian Goverernment has Glass-Steagall bank seperation on its agenda and will very likely discuss it at the invitation from Trump to Conte soon at the WH.
To paraphrase Max Planck’s, there are fake problems and real ones – to distinguish them takes scientific creativity.
Bang on target, Dr. Ball!
Stated with far more accuracy than the vast majority of desk bound tissue paper estimates promulgated by climate charlatans!
Apologies for not having the time to comment on the whole article, but please allow me to point out some of the errors in the first paragraph alone.
1. “The Intergovernmental Panel on Climate Change (IPCC) and the people who formulated the structure that directed their research, … ”
The IPCC does not conduct research. It is an assessment body whose role is to assess knowledge relevant to understanding climate change. To be clear: We do do not carry out our own original research; we assess scientific research published by others relevant to climate change.
2. “It began with the definition of climate change given to them as Article 1 of the United Nations Framework Convention on Climate Change (UNFCCC). ”
The UNFCCC was established in 1992 when it was adopted at the Rio Earth Summit that year. The IPCC was created 30 years ago in 1988 – four years earlier. So it would not have been possible for the IPCC to be given a definition or target by the UNFCCC.
The report of the first session of the IPCC held in November 1988 noted that the objectives included:
“(i) Assessing the scientific information that is related to the various components of the climate change issue, such as emissions of major greenhouse gases and modifications of the Earth’s radiation balance resulting therefrom (…)”
and states that the tasks of the IPCC include:
“(i) Assessment of available scientific information on climate change; (…)”
No definition of climate change is provided.
The current Principles Governing IPCC Work, approved in 1998 and amended several times since then, state:
“(2). The role of the IPCC is to assess on a comprehensive, objective, open and transparent basis the scientific, technical and socio-economic information relevant to understanding the scientific basis of risk of huma-induced climate change, its potential impacts and options for adaptation and mitigation. (…)”
Analysis of human-induced climate change requires, logically, consideration of both anthropogenic and non-anthropogenic factors in order to assess their relative contributions to climate change. This is what the IPCC does, for instance most recently in Figure SPM.3 (Contributions to observed surface temperature change over the period 1951-2010) in the Summary for Policymakers of the Synthesis Report in Climate Change 2014 (the Fifth Assessment Report), which sets observed warming against greenhouse gases and other anthropogenic forcings, natural forcings and natural internal variability.
Very interesting to hear an opinion come from the horses mouth. Thank you for your input into the discussion, Jonathan. Very interesting to see someone such as yourself inhabit these parts of the internet. I’m assuming you’re the Jonathan Lynn media spokesperson for the IPCC? Enjoy the ride 🙂
Ha, good calls! It seems that this Ball fellow is continuing with his usual nonsense, as noted recently:
“… the article is poorly written and does not advance credible arguments in favour of Dr. Ball’s theory about the corruption of climate science. Simply put, a reasonably thoughtful and informed person who reads the article is unlikely to place any stock in Dr. Ball’s views…”.
B.C. Supreme Court Justice Ron Skolrood
He could have been talking about this article, the last one here, or the next one! Why does WUWT provide this man with so many opportunities to make this site look foolish?
“Simply put…” the dear old Justice spoke out of his six o’clock orifice. There. We can all play.
“Foolish”?
Ball, despite being a nutter, raises it up.
This site has been getting more and more pathetic trolls lately.
I put stock in Dr. Ball’s views. I don’t put much stock in the views of a Canadian judge.
If you want to rebut Dr. Ball, then try to do so. The opinion of a Canadian judge, of unknown bias, is not a sufficient rebuttal.
Pretty typical. All that’s needed is for some spokesman to claim, you’re wrong, and all the usual trolls pop and start declaring refutation.
Completely and utterly false is the chart showing contributions to observed surface temperature change over the period 1951-2010.
I would say natural forcings and to a lesser extent natural internal variability account for 100% of the warming from 1951- 2010.
As I said AGW or I should say the slight global warming is ending this year.
This is the transitional year and I think the very low solar activity within the sub -solar activity we have had in general post 2005 will be sufficient enough to exert a climatic influence.
I maintain very low solar equates to lower global temperatures due to lower overall sea surface temperatures and a slight higher albedo, due to an increase in major explosive volcanic activity and an increase in global cloud/snow coverage.
Love the way you put up a chart that claims knowledge we don’t have……..
But, it’s in a chart, and the organization uses lots of letters in it’s acronym. How could it not be true?
There’s a huge difference between “directing research” as the article mentions, and “doing research” as Jonathon mentions.
In other words, Jonathon is refuting a claim that was never made. Classic strawman, and something a paid professional should be able to avoid, unless he’s being paid to not avoid it.
Very cute how they claim that without humans there would be essentially no temperature change at all. That would be the first time in about 4.5 billion years, but hey, don’t think about it too hard.
Yes, the IPCC assesses scientific papers, makes comments. Then those comments are ignored as a controlling group of less than 100, maybe 25, writes a Summary for Policy Makers. The we get a statement such as human influence is “very likely”, but with NO measurements to back it up.
It has been noted by Steve McIntyre that when he asked for more information from the authors of a paper he was reviewing, he was told by Susan Solomon not to ask again or he would be kicked off the review team. A great organization.
“The IPCC does not conduct research. It is an assessment body whose role is to assess knowledge relevant to understanding climate change. To be clear: We do do not carry out our own original research; we assess scientific research published by others relevant to climate change.”
In other words, it is a political body, not a scientific one.
“The role of the IPCC is to assess on a comprehensive, objective, open and transparent basis the scientific, technical and socio-economic information relevant to understanding the scientific basis of risk of huma-induced climate change, its potential impacts and options for adaptation and mitigation.”
In other words, the assumption of human caused climate change is cooked into the objectives.
The trouble with thinkong that you win by pointing out how the poor the facts supporting the other side are, is that your on the wrong battle field . The author is right that in this area ‘better than nothing ‘ is the reality . But they are missed placed to think pointing this out will be effective .
Great takedown of the massive wag used by climate ‘science’. They throw man hole covers around like nickels.
Specifically, wooden nickels.
Moly Nola – why is carbonoxide measured and recorded there?
It is in the middle of a humongous ocean.
2 problems with that:
1. Why doesn’t all that water suck up the emissions, supposedly coming from exhausts, stacks, flues and fires many many 1000’s of miles away. How does all that CO2 get there when its supposed to be turning the water into a boiling vat of acid?
2. and the other side of the coin from (1) above. Is not warming water supposed to release carbonoxide. Maybe the notion is true, Maybe Henry was right with his law so is the rising CO2 level not a direct record of ocean heating?
OK, go with that. But where is the signal from silly old El Nono. There goes a huge belch of hot water now and again – so where is the resulting belch of carbonoxide? And the contrary when Old Nana belches?
We all know the answer to such awkwardness. Peta is just soooooooooo dense, thick and stupid that the only response is to tell Peta exactly as much and give Peta a thump IOW: Shut up and pay your taxes.
Peers, consensii and Magical Thinking are great aren’t they? School Playground Politics.
Why not hear about carbonoxide over the land area?
Peta will tell you why.
Because, at this time of year (summer) they will record over 620ppm CO2 in the hour before sunrise and less than 380ppm in the hour before sunset.
Where there is greenery growing. Different again where there is not.
Different when it is cloudy or sunny. All different again during winter time.
Lets hear it, The CO2 level (and water vupaur) will be very high on cloudy summer days yet the temperature will be low. So where is your GHGE?
Remember, clouds, water vpouar and CO2 all ‘trap heat’ or ‘reflect radiation’
So which is it? Two ENTIRELY different mechanisms. Cannot have both.
oops. Sorry. My bad.
In Climate Science you CAN have both
Ma Nature will totally trash their tedious little reckonings that go down to 3 or even 4 decimal places. (So the Metric System does have uses after all!!!!! ha ha)
But wait. We know from that appalling bit of graffiti above the door of Wyoming University that Ma Nature does NOT know best. Ma Nature must be controlled.
(MOTHER Nature – the female or womanly form. Geddit now boys – why so few babies and why you’re being divorced so often nowadays?)
Maybe Smith, Moan, Tubworth et al will have to do some Real Science, in the Real World and have an actual original thought in their heads.
Not inside their chauvinistic super computers. For those with a deficiency in a particular department, only a ‘super’ anything will suffice. The Human Animal cannot pass off untruth, It always gives itself away.
Just for once please. Original work and an original thought.
Is that really too much to ask
Peta,
1. Why doesn’t all that water suck up the emissions
The speed of uptake is fast for the upper ocean only (the “mixed layer”): within a few years in equilibrium with the atmosphere. Due to chemistry, only 10% of the change in the atmosphere shows up in the ocean surface layer. Exchanges with the deep oceans are much slower and for more permanent storage in forests even far more slower. That needs time (about 35 years half life time), therefore not all human emissions are absorbed in the same year as emitted.
2. Maybe Henry was right with his law so is the rising CO2 level not a direct record of ocean heating?
Henry gives a change of about 16 ppmv/K in the equilibrium between ocean surface and atmosphere. Even with 1 K warming ocean wide since the LIA, the increase in the atmosphere would be not more than 16 ppmv. The rest of the 110 ppmv increase is from human emissions…
“If the oceans are the major source and sink of atmospheric CO2, then why doesn’t the warming El Nino events show up in the Mauna Loa record.”
They do. Looking at annual changes the two biggest increases in CO2 were in 2016 and 1998. You can see spikes in CO2 increase corresponding to a number of strong El Niños.
Is WUWT getting DDOS’ed this morning? The site is responding very slowly.
Ditto.
It’s slow this morning for me, too.
Speed is OK for me, but the page never completely loads in firefox. It keeps churning away at something, but functionality does not seem impared.
Once again, Thanks Dr. Tim Ball for your experienced and common sense explanations of FACTS. Something your contemporaries in the Climate Science (sic) should consider before blathering on any longer.
Dr. Ball exaggerates when he writes, “Their Figure 6-1, Fifth Assessment Report… none of it is based on actual measures, that is real data; everything is an estimate and can’t qualify even as an educated guess.”
In fact, we do have pretty good “real data” for production (and ∴ consumption) of various types of fossil fuels, and thus for the consequent emissions of CO2.
That’s how we know that negative feedbacks are lowering CO2 levels at about half the rate at which fossil fuel use etc. is increasing CO2 levels: because 1 ppmv CO2 has mass 8.053 Gt, and we’re producing about five times that much CO2 each year, i.e., enough CO2 to raise CO2 levels about twice as fast as they are actually rising.
That was the largest (though not the most obvious) of the blunders in Hansen et al 1988: failure to anticipate that negative feedbacks like greening would drastically decrease the effect of CO2 emissions, by reducing the increase in CO2 levels.
That was the largest (though not the most obvious) of the blunders in Hansen et al 1988: failure to anticipate that negative feedbacks like greening would drastically decrease the effect of CO2 emissions, by reducing the increase in CO2 levels.
And yet his prediction of the CO2 levels continue to be extremely accurate!
His prediction for 2018 CO2 levels was:
Scenario A 410ppm, Scenario B 404ppm, Scenario C 368ppm
Clearly he anticipated extremely well!
2017-2018 Max 411ppm Min 403ppm
Good commentary, Dr Ball.
CO2 is measured at many sites, at many altitudes, in addition to being measured from spacecraft. See the map for the Global Greenhouse Gas Reference Network. Tim Ball’s articles are getting wackier and wackier with insane conspiracies, fictional histories…
J10 Jun: TimesOfIndia: Climate change? Freak snow in May, June dashes hopes of mountaineers in Garhwal
by TNN; with inputs by Gaurav Talwar
Uttarkashi: For those planning a trek or climb in the Garhwal Himalayas, a not-so-good news. Snowfall in the months of May and June — a possible fallout of changing climate patterns in the higher reaches of Garhwal — has restricted many mountaineering expeditions from successful summiting of peaks this year. As a result, organisers of mountaineering expeditions say, the current climbing season which began from April 15 has so far been ‘a dismal one.’ “Seven expeditions have gone to the Gangotri region to climb peaks in the area, but only two succeeded and five had to return because of adverse weather conditions,” said Jayendra Rana, president of Uttarkashi Trekking and Mountaineering Association. He added that usually, the area receives snowfall till March-end, after which the weather becomes conducive to climbing. But not this year…
Mountaineer Vishnu Semwal, a Mt Everest summiteer, said he found the weather pattern ‘puzzling.’ “Usually till May-June, fresh snow in the area tends to melt and only hard ice remains on the peaks, which is helpful to fix ropes and harnesses. However, during this season, most mountaineers are witnessing heavy snowfall in the peaks…
Manish Kumar, another mountaineer who was part of a recent expedition to Kedardom, added, “In the past five years, I haven’t witnessed snowfall in the month of May in this region. Our team had made preparations hoping for a moderate climate but had to face heavy snowfall due to which we had to retreat. It is an indicator that weather patterns are changing in the Himalayas.”…
***According to Dinesh Chandra Goswami, professor of Geography in Rishikesh PG College, the unusual snowfall during these months could be linked to climate change. “Earlier, our months were defined by the particular weather conditions that exist in that particular period of time. For example, snowfall in January-February, summers in May-June and rain in July-August. However this climatic cycle has changed in past few years due to factors like global warming, deforestation, excess human intervention etc. Besides this, many global and local factors have also shifted the climatic cycle, which may be causing snowfall in May-June.”
However, meteorologists hold another view…READ ON
https://timesofindia.indiatimes.com/city/dehradun/climate-change-freak-snow-in-may-june-dashes-hopes-of-mountaineers-in-garhwal/articleshow/64533579.cms
Okay so major El Ninos have no impact on the reported aCO2 because…
Yeah, I won’t hold my breath
Robert,
Dr. Ball didn’t look at the details: if you look at the rate of change of the CO2 increase, there is a measurable impact of an El Niño and of volcanic eruptions like the Pinatubo. In El Niño years the CO2 levels increase with an extra 3 GtC/yr, while after the Pinatubo the increase was 3 GtC/yr less than in average years…
The carbon balance is unknown and unknowable. Dr. Gold was right.
Hydrocarbons are created deep in the earth and they rise all around
the earth, but they are not evenly distributed. They tend to rise along
fault lines which is the reason that the Arabian states’ fields are refilling
and the Saudis will not publish a number.
Grey Lensman @ur momisugly 2:34 am gives the example that caused me to form
my hypothesis. “Upland topsoil, soil not in a flood plain, in the presence
of adequate moisture, owes it richness to the amount of natural gas
upwelling through it.”
Tera Preta, as the rich jungle soil is known, is soil over plumes of natural
gas. As the gas nears the surface, aerobic microbes consume the gas,
using the hydrogen for energy and excreting the carbon. The CO2 then
rises.
British television did a program on the soil patches and featured scientists
who leapt to the wrong conclusion. Dr. William (Bill) Woods was shown
near the end of the program watching locals mining the top 10″ inches
of the soil, and saying that in 20yrs, the 10″ inches would grow back.
The amount of carbon in the soil and the fact that human artifacts were
found throughout caused the geographers and paleontologists to conclude
that humans created the soil using biochar.
I knew that nothing that the inhabitants had done hundreds of years ago
could cause top soil to grow today. Too much energy is required.
I remembered that the black smokers discovered deep in the oceans were found
to be powered by natural gas. Then the small plume of natural gas stops,
the culture around it dies.
I devised a simple test for my hypothesis and tested soil on my
property in East Tennessee, soil in Middle Tennessee, and soil in
Northeast Kansas. The amount of hydrocarbons present in the sub
soil was proportional to the richness and thickness of the soil.
In ~500 ft. on my property, the topsoil varies from ~1″ to more
than 12″ and the hydrocarbon readings varied accordingly. The Kansas
sample required digging through more than 3′ of topsoil.
In the Ukraine, topsoil is reported to be more than 2 meters thick in spots,
and very rich.
Rice paddies give us a window into some of the problems estimating CO2
and natural gas volumes. When the paddies are not flooded, they produce
no natural gas. The hydrocarbons and the local microbial culture are in
balance. When flooded, the culture is disturbed, and the gas rises faster than
it can be consumed. This natural gas emission is said to be human production.
In past USEPA carbon balance accounting, upland topsoil in the US has been
said to be a 20-30TG sink for methane. It is not. The hydrocarbons found
in topsoil upwell from deep in the earth. When methane hits the
atmosphere, it rises.
The number and volume of volcanoes, of both hydrocarbon and CO2 production,
from surface and subsea locations is only guessed at. The amount of CO2
and hydrocarbons which never reach the surface is unknown.
Just the fact that the USEPA has claimed that topsoil is a net sink of CO2
means that the US balance is off considerably.
I hope that the Scott Pruitt EPA will correct this error.
Noop. Oil is generated from highly organic rock that becomes vitrinite and kerogen. This has been unequivocally proven, we literally produce it from the source rocks themselves. Minor amounts of methane and other light hydrocarbons are produced inorganically.
I understand that you believe that hydrocarbons are mostly fossils.
Do you think that hydrocarbons on Titan, Saturn, Jupiter, and all the
exo planets which have had their atmosphere analyzed show hydrocarbons
are signs of biologic life?
Shale hydrocarbons are an example of the way hydrocarbons which do
not reach the surface are captured. They rise until they hit a strata which
does not allow them to continue their rise. Small and simple molecules
require very tight rock layers to capture them.
Arabian light crude is an example of rising hydrocarbons captured by
very tight rock layers. You can filter out the sand and run a diesel with
it. The tar sands in Canada and Venezuela had no cap so all the light
molecules evaporated. Think of the earth as a massive petroleum distilling
vessel, with lighter fluid drawn off at the top and tar remaining at the
bottom. A combination of the pressure, metals, and straining layers,
mostly shale, but can be carbonatious, dictate the hydrocarbons retained.
The Russians have produced natural gas from a 40,000 ft deep well.
This was through (under) basement rock.
Methane hydrates are another good example. Fossil fuel believers think
that the hydrates are an ancient accumulation of life which fell from the
near surface. The plume of hydrocarbons flowing from Deep Water Horizon
demonstrates the fate of these molecules in the Ocean. When scientists
searched for them three month after the well was capped, they discovered
that microbes had bloomed to the extent of food available. The hydrocarbons
were gone.
The massive layer of hydrates off the coast of the Carolinas start ~500 ft
under the layer which appears to be the bottom of the ocean, and accurate
analysis indicate natural gas, not just methane. It is not fossil fuel.