Evidence of a Cycle 25 sunspot found
In our previous post: Solar activity crashes – the Sun looks like a cueball,
Our resident solar physicist, Dr. Leif Svalgaard commented and provided a link to something reported by his colleagues, something that likely would not have been possible without the fantastic solar observations of NASA’s Solar Dynamic Observeratory (SDO). He said:
Cycle 25 has already begun
http://sprg.ssl.berkeley.edu/~tohban/wiki/index.php/A_Sunspot_from_Cycle_25_for_sure
It looks to me that SC25 will be a bit stronger than SC24, so probably no Grand Minimum this time
http://www.leif.org/research/Prediction-of-SC25.pdf
http://www.leif.org/research/comparative-study-solar-prediction.pdf
(ignore the 2014 in the top line – it is just a place holder).
It seems a small sunspot has been observed, that has the opposite polarity of cycle 24 sunspots.
From the first link at Berkeley, Tomek Mrozek and Hugh Hudson write:
This brief Nugget simply announces that YES, we really have seen Cycle 25 [sunspot activity]. An earlier Nugget hinted at this, but it was not so clear a case as presented by today’s new tiny sunspot. Why is this interesting? It’s because spots appearing this early in a cycle – even before a minimum is well established – are quite rare. We could speculate that solar minimum may arrive early and/or may be brief, more evidence regarding the seemingly stochastic component of the development of the solar magnetic cycle.
The Cycle 25 Sunspot
At the time of writing, NOAA has not identified this new sunspot with an official active-region number, and so there could be some things to quibble about. But the magnetic polarity of the region unmistakeably identifies it as a piece of the new cycle, because it reverses the polarity expected for Cycle 24 regions.
Figure 1 here shows the new spot as of this date (10-April-2018). It is marginally detectable but definitely there in relatively crude 1024×1025 .gif versions of the beautiful data from the SDO space observatory.

Figure 1: File images from the HMI instrument on SDO: left, the continuum intensity; right, the telltale magnetic field. From the latter one can see black polarity to the right (“preceding”, as the Sun rotates). This is the opposite of that shown, for example, by the exceedingly tiny region at about -5 degrees.
It requires a bit of patience to see the spot; refer to the location of the magnetic features and perhaps dither the window on your browser screen. The icon for this Nugget on the parent page here has a slightly better view derived from a 4096×4096 image.
Conclusion
This sunspot has been tabulated in the excellent SOLEN page of Jan Alvestad. The Nugget-writers here thank him for his thorough monitoring of solar activity, and also thank Leif Svalgaard for paying close attention as well.
Robert Zimmerman, in our previous story, noted this:
If the solar minimum has actually arrived now, this would make this cycle only ten years long, one of the shortest solar cycles on record. More important, it is a weak cycle. In the past, all short cycles were active cycles. This is the first time we have seen a short and weak cycle since scientists began tracking the solar cycle in the 1700s, following the last grand minimum in the 1600s when there were almost no sunspots.

We’ll be watching for “official confirmation”, but if Dr. Svalgaard says Cycle25 has happened, it is almost certain to be true. Now comes the waiting to find out if Cycle 25 is going to be a strong or weak cycle.
OK. One little spot. Maybe we should wait to see if more appear soon before we declare SC25 started, given the observations that all previous weak cycle were strong cycles. This seems a bit premature. If we have a long length of time (12+ months or whatever) and no more SC25 spots, then we can probably count this as an anomaly, and file it in our observation bank for the future. If more appear, then this was actually the start.
F10.7 cm emissions don’t seem to be coming up yet, but again it’s early. After this spot, If F10.7 starts up then it’s easy. But a little spot is not enough for me. I need the whole picture to come into focus.
“omething that likely would not have been possible without the fantastic solar observations of NASA’s Solar Dynamic Observeratory”
The opening paragraph implies that this sun spot would not have been observable as a cycle 25 spot prior to Solar Dynamic Observeratory.
If so, how do we know that such sun spots are unusual?
The good doctor surely must have a prediction… no?
And he’s already made it. Weeks ago.
The good doctor surely must have a prediction
Pay attention. It has been propounded several times already
http://www.leif.org/research/Prediction-of-SC25.pdf
Thank you for the PDF.
So prediction is between SC20 and SC24…
Looking forward to the next 10 years!
Mr. Isvalgaard
I’m very much a novice stargazer and moon watcher. Question? What makes SC25 important? And what solar minimum?
Thank you very much! Pricella
Dr. Svalgaard,
Does a star’s mass, age, and/or rotation rate relate to it’s average sunspot cycle length? What stellar factors combine to give Proxima Centauri an ~ 7 year cycle and Sol an ~ 11 year cycle? Is this true for all classes of stars or just for main sequence stars?
There is a rich literature on this. Here is something more accessible:
http://www.skyandtelescope.com/astronomy-news/proxima-centauri-sun-like-cycle-1110201623/
Thank you!
It is true that a signle C25 region appearing now does not necessarily signal the start of C25 right now.
Cycle 25 spots have already been appearing sporadically for some months – probably a false alarm with a fairly high-lat reversed polarity region in Dec 2016 – but there were definitely a few in August-October last year. The one region this month was NOT the first.
We had the spate of groups last Aug-Oct before things went quiet on the Cycle 25 front, now we have had a handful more groups between February and now.
As already stated above, we won’t know for a while after the “official” minimum that it has actually occurred. Now that Cycle 25 spots have started to appear, I have a hunch that there could be an uptick in C25 activity later this year. If this happens (big if), then it could well be that Solar Minimum, statistically, could well turn out to be April 2018.
There is talk, *if* this happens, that C24 will have been very short as well as a low one. However, Cycle 24 had such a slow start that (in my opinion) statistically the minimum was delayed making the start of the cycle appear later – I would have expected it around the end of 2007. In which case, C24 would be around 10.25-10.5 years long (if Min turns out to be April 2018). As of April, we will have lost the burst of higher activity around August/September last year (which came from the old cycle) from the 12-month smoothed mean, so any increased activity from the new cycle in the last quarter of this year could well be enough to cause a rise in the 12-month smoothed mean and signal properly the start of Cycle 25.
All ifs and buts, of course, but the appearance of C25 sunspot regions as early as late last summer in my opinion, based on past cycles, makes an earlier minimum more likely.
Time will tell!
As far as sunspots go, it’s barely there, but now that it’s a designated active region I think it deserves a shot so I took a photo of AR12704.
http://a4.pbase.com/o10/77/857277/1/167296121.HuzTGgGS.AR12704_Sun_095424.jpg
Date=130418
Start(UT)=165406.964
Date_format=ddMMyy
Time_format=HHmmss
LT=UT -8h
You do fine work! What equip do you use?
Here’s the latest magnetograph. Definitely a SC25 spot.
Hit the button too soon
https://postimg.cc/image/4ymwfj8on/
try again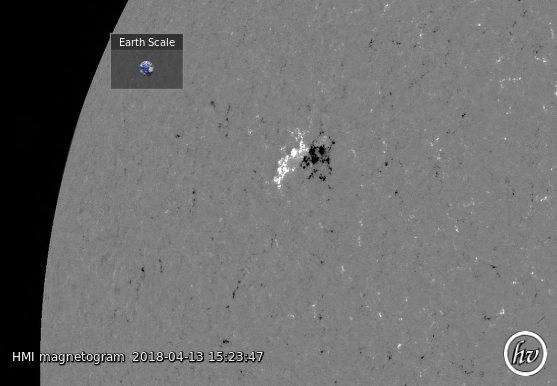
Is that a 100 mile, 1000 mile, or 10,000 mile across ‘spot’? Can you provide a reference dimension within the image (say at lower right corner), to provide ‘size’ comparison?
Thanks Pop! I encourage others to provide similar reference dimensions in such image, to help everyone understand the scale of the phenomena illustrated.
Here it is about an hour and 15 minutes later.
Earth added for scale this time.
Equipment is 6″ refractor at with 2280mm focal length, <0.7nm H-alpha etalon, IMX252 camera
Date=130418
Start(UT)=181657.273
Date_format=ddMMyy
Time_format=HHmmss
http://a4.pbase.com/o10/77/857277/1/167296656.rnGjpArL.AR12704_Sun_111714.jpg
Equipment is 6″ refractor at with 2280mm focal length, <0.7nm H-alpha etalon, IMX252 camera
Shoot- that won’t be happening on my pension…
J Mac you don’t need me, just go to https://helioviewer.org and look for yourself.
Pop and David,
I appreciate both of your responses. Like many others, I struggle with understanding the relative size of solar phenomena. Understanding of this visually ‘tiny’ little sunspot is greatly magnified with the reference earth diameter included in the image.
Here’s a fun site to get a good perspective.
http://www.suntrek.org/sun-as-a-star/sun-and-earth/comparing-size-sun-and-earth.shtml
What matters is what the solar flux does over the next few years.
If it begins to correspond differently from the SSN, then it could signal a problem with the data analysis. Otherwise, they are pretty much in lock-step from my years of observation. In fact, as an AR rounds the eastern limb, the F-10.7 flux rises before the sunspots are countable so what you said is very true in its own way.
Here are the major solar indices of interest when looking at warming and cooling, aligned at the decadal warming line. SORCE TSI is higher now from instrument degradation by about 0.15 W compared to PMOD,
but its still useful as long as degradation is recognized because it’s daily data, consistently every day.
In early 2007 after a few days of F10 over 90 sfu, F10 was under 90 sfu until late 2009, early 2010, and then for only a few days. The 5 years in F10.7cm from 2006-2010 averaged 75 sfu. The 2009/10 El Nino ensued under these conditions,when F10.7cm flux was under 90 sfu. So, there’s more to everything than just 90 sfu, just as there’s more to it than 120 sfu.
It’s this simple: the ocean is supersensitive to short-term TSI changes, overall TSI level, seasonal insolation changes, and insolation changes related to TSI-evaporated tropical cloud cover. Temperatures rise and fall as solar activity rises and falls, with short lags, one at the sun of 1-4 months, the other in the ocean due to upwelling time, then subsequent realtime obscuration by the TSI evaporated clouds over the tropics.
All of these mechanisms were in play during the last solar minimum, and will recur again soon enough:
Bob,
I have seen your poster at the 2018 SORCE meeting last month. Pretty interesting stuff. Are you aware of the presentation by Leamon & McIntosh at the Fall AGU meeting, regarding the relationship between Solar minima and La Niña?
Predicting the La Niña of 2020-21: Termination of Solar Cycles and Correlated Variance in Solar and Atmospheric Variability
I think they are up to the same stuff as you. Perhaps you should write something up and try to publish it this year so it doesn’t come after theirs. In my opinion it would be better to use simpler graphs with up to two variables per panel.
I very much like your calculation of the threshold value. I had come to the conclusion from evidence that such solar threshold for the effect on climate must exist.
“F10 was under 90 sfu until late 2009, early 2010, and then for only a few days.”
“…and then it was higher than 90 sfu for only a few days.”
Thanks much, Bob.
Clearly, the Curie point doesn’t apply. Obviously it is incorrect to say that magnetism per se is destroyed by heating. It is in ‘cold’ solid metal magnets due to thermal agitation of atoms that causes mixed reversals of magnetic polarity on an atomic scale. Teachers stop saying it destroys magnetism!
Long time WUWT follower. Posts like this and subsequent comments are why I love this site so much. There are always new things to learn. Thank you to the authors and commenters.
Maybe if Gavin or Cookie thought to include actual science current events on their sites, they’d be approaching 350 million hits too.
Dave, do you ever wonder why the warming trolls don’t partake of this kind of “breaking science news”?
given their smug superior attitudes i think it would take a lot more than that pop.
I’m not a denier, so I guess I’m a warming troll.
I have a question for Dr. S.
I see from your studies that you are convinced that sunspots and flux have no effect on cloud formation and thus no effect on temperature. All of my studies on the subject have caused me to also question the effect.
However, I am curious if there is an effect on TSI? Yes, I know TSI doesn’t change with the cycle but would a number of cycles of lower sunspots or flux cause a change in TSI?
I guess what I am asking is this. What causes changes in TSI from the sun? It strikes me that the Little Ice Age and previous cold periods were caused by the sun. You make it plain that it is not sunspot minimum so that only leaves TSI. What would cause a significant enough change in TSI to cause fluctuations in temperature?
Actually, with a little more research I answered my own silly question. Found a paper which indicates that TSI does change on the cycle. Around 1361.5 Wm2 average during the max to 1360.6 Wm2 average during the minimum.
Andrew, I would normally refer you to http://www.leif.org but when I follow that link I get some new financial company. I believe someone has stolen his domain.
Leif, are you aware of this glitch?
At the bottom right, “Looking for Leif Svalgaard?”
Thanks, Bob I neglected to scroll down the page. Maybe it would be courteous for them to place that notice at the top for a while.
The very small changes on TSI are caused by the magnetic field of the sun. A 70 times larger change through the year is caused by the changing distance to the sun [closer = higher TSI]
“A 70 times larger change through the year”
Any evidence of this 93W bi-annual swing July-January formula would absolutely stand out in any terrestrial data.
Got some? It’s not like I haven’t looked, hard.
If that were right, this solar minimum in 1 au TSI and the growing number of spotless days would have no meaning to this NH winter, as the formula “true TSI” variation during this NH winter would have been so many tens of times larger than any 1 au change that it would swamp the actual real solar output change at 1 au. That is the real implication.
My work says the earth responds year-round to daily solar variation at 1 au, “seasonally”.
Your formula says the magnitude of any daily 1 au TSI change is only within range of the less than or equal to the ‘up to 70X value’, twice a year for only a few days each time. Under that regime, the Sun’s actual change at 1au only averages to that formula value during the one year period registered Jan-Jan, rendering the daily 1 au TSI values or changes throughout the year virtually moot by comparison.
Very clever, except it doesn’t work like that in real life, as there is no direct evidence for it in terrestrial data. Evidence for ~1409W in January at the Tropic of Capricorn, and for ~1316W in July at the Tropic of Cancer, is necessary please, in several climates indices for multiple confirmations, otherwise it’s just a “construct”.
Please provide ample direct evidence of the claimed huge 93W difference in TSI every six months in several ocean and atmospheric indices. If it’s right, there should be no trouble providing all kinds of supportive evidence any time on the spot, as it should already be at your fingertips.
I stand ready to be corrected by an overwhelming display of supporting evidence in ocean and atmospheric data, but won’t accept any restatement of that formula or it’s derivation as evidence, or any petulant demands that I adhere to it without direct terrestrial evidence for it.
I can tell you right now there isn’t a case for a 93W bi-annual TSI swing at the earth. All there is is a formula, which isn’t evidence.
Dredge up and display ample evidences of the impact of a 93W swing in TSI every six months on the earth system or there isn’t a case. No evidence = no case.
Anytime. Anybody. Take your time. I’m not holding my breath.
If it’s beyond anyone to do that then I don’t expect to hear about this again, ever, unless someone wants to talk about their failure to supply the requested evidence.
Please provide ample direct evidence of the claimed huge 93W difference in TSI every six months in several ocean and atmospheric indices.
It is difficult to fish that out of the usual seasonal variation. The issue is usually sidestepped by calculating anomalies, i.e. the difference between what is usually seen over a long time span and any particular time. The 93W difference then neatly cancels out.
I’m sorry sir, but that reply doesn’t answer the question. It took me years to assemble the data in support of the 1 au daily variation. The 93W is so big the earth would fry in Jan and freeze in July. All I asked for was sufficient evidence to be convinced it does anything at all to temperatures. So far no evidence.
The 93W is so big the earth would fry in Jan and freeze in July.
The 93W is observed with high precision. Here is what it looks like:
http://www.leif.org/research/TSI-at-Earth.png
If you plot each year on top of each other it looks like this
http://www.leif.org/research/TSI-through-a-year.png
The tiny wiggles you may see are due to solar activity.
The nice sine-curve is just due to the varying distance
“Solar cycle 24 one of the shortest and weakest ever”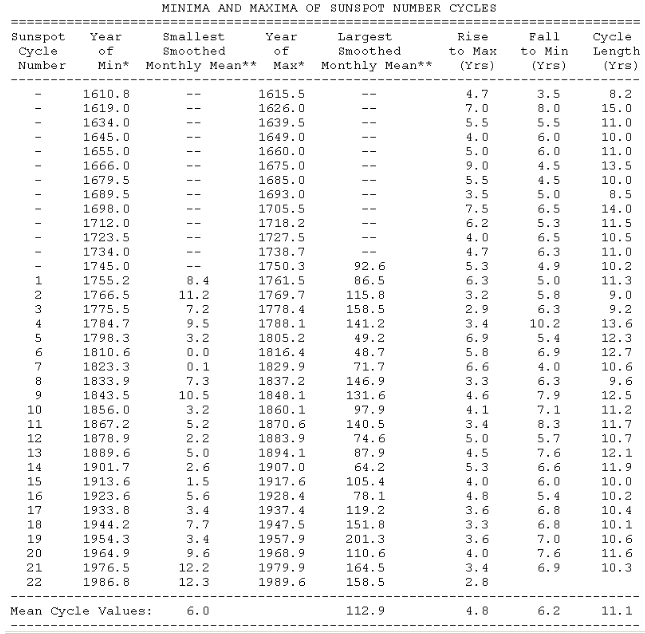
Solar cycle 24 has not ended so it’s length is not currently known. It is already longer than the shortest cycles.
Solar cycle 24 has not ended so it’s length is not currently known
The time from minimum to minimum is not the true length of the cycle [which is about 17 years] as two ‘cycles’ overlap by some years.
The overlap is obvious the butterfly diagram thanks.
Andrew, I would normally refer you to http://www.leif.org but when I follow that link I get some new financial company. I believe someone has stolen his domain.
Leif, are you aware of this glitch?
Leif, are you aware of this glitch?
I have outsourced maintenance of my domain [it was a chore] so now I live in a little corner of it. You can get there with http://www.leif.org/svalgaard or http://www.leif.org/research or http://www.leif.org/EOS
Many thanks for the links and explanation. Reminds me of a doctor friend in West Hollywood who turned his sprawling ranch house with a yard into mid-rise condos with underground parking. He lives in the smallest unit.
Solar physicist Dave Birch explained it thru his twitter account: ‘I have explained this many times, outgoing/incoming solar cycles cross over with existing cycle spots around the equator new cycle spots at higher latitude, we have not reached solar minimum yet.’. There were spots with reverse polarity observed back in August 2017 and December 2016 too.
From http://www.solen.info/solar/cycle25_spots.html, early Cycle 25 sunspot observations in SDO HMI imagery:
“While smaller spots with the correct polarity alignment of cycle 25 regions have been observed at high latitude locations as early as 2016, this overview will only include spots large enough to have been visible at a 1K resolution. In the case of reversed polarity cycle 24 regions, those that are not at a sufficiently high latitude (ie. 30 degrees or more), are considered most likely to belong to cycle 24 and will not be included in this list until closer to the actual solar cycle minimum (likely to be sometime between April and December 2018).” !!! (my exclamation marks).
We will know much more about SC25 when the actual time of the next minimum is established. Dr. Svalgaard’s http://hmi.stanford.edu/hminuggets/?p=2084 “educated guess” for SC25 max, also guessed that the minimum at the start of SC25 wlll occur in 2021. (see his Figure 2 and Table 1):
Caption for Figure 2;
“Figure 2 The solar Dipole Moment DM inferred from the sunspot number, SN (red symbols), and from the group number, GN (blue symbols) for the cycles following the minima for which the DM is determined using the regression equations from Figure 1. The average DM for each cycle is shown with a heavy black line with light-blue circles. The observed DM values since Cycle 21 are shown with large circles. An educated guess for Cycle 25 (size between Cycles 20 and 24, based on extrapolated DM from WSO) completes the inferences.”
Caption for Table 1:
“Table 1 Time of minimum for the numbered solar cycles. Average Group Numbers GN and Sunspot Numbers SN for the two highest yearly values for each cycle. DM (μT) observed at WSO for the three years prior to minimum, and the DM inferred from GN and SN, and their average, and finally the inferred HMF strength B (nT) at each minimum. Estimated values are in italics.”
“Table 1 also shows for Cycles 1 to 24 their DM at minima reconstructed from GN and SN of the following solar maxima, as well as the average of the two reconstructions. Figure 2 graphs the reconstructions and shows DM for each cycle as marked.”
So, if the next minimum is in 2018 instead of Dr. Svalgaard’s prediction assumption of January 2021, that’s more than two years earlier than shown in his Figure 2 and Table 1!
BTW, yesterday’s http://www.solen.info/solar/ Recent Activity section reports this:
“Minor update at 17:30 UT: While there are few and small sunspots this close to the solar minimum, cycle 25 spots could soon outnumber cycle 24 spots. The actual minimum is likely to occur earlier than previously expected, making cycle 24 both a short and small cycle. The most likely time of the minimum appears likely to occur sometime between April and December 2018. This cycle 25 region was observed at noon today at S31E09”
Yet, we know that, in general, low cycles are longer than high cycles. SC24 started in late November of 2008, so it would only be a 10 year cycle if it officially ended this year. Cycles as low as SC24 are usually more than 11 years in length.
https://www.thegwpf.com/put-up-or-shut-up-time-for-the-solar-climate-theory/
“Here’s the nice thing about the sun-spot theory: It’s a testable hypothesis. The theory states in no-uncertain terms that solar radiation as measured by sun spots is a key driver of earth’s climate. The theory says that cycles in earth’s temperatures closely match cycles in sun spot activity”
The theory says that cycles in earth’s temperatures closely match cycles in sun spot activity
And observations says that they do not. So much for that theory.
Earth doesn’t have a temperature – it has weather.
Quiet sun puts Europe on ice
New Scientist, May 2010
Exactly. Observations support a match between climate and solar activity. We just went through a Modern Maximum formed by seven consecutive solar cycles with above average activity. The longest such period in over 300 years of solar records. This period (~ 75 years) coincides with 20th century global warming. We have now entered an interesting period of below average solar activity, characterized by the lack of warming known as the Pause.
Global warming has stopped until solar activity becomes above average again.
All historical climatic data without exception shows a clear solar/climate relationship.
How come Willis hasn’t managed to find it then – and if there is such a clear link how come none of your forecasts for cooling have been proven correct yet. You’ve been making the same cooling predictions year after year for the past decade on Roy Spencer’s blog.
While many others like myself see it .
I’d be interested in knowing exactly what it is you “see”.
John Finn,
If using Willis as your guide dog, try to keep in mind that he can’t even see the solar cycle in the 14C record.
******
Snowfalls are now just a thing of the past
Independent, March 2000
Scientists predict milder winters in Britain and an end to Europe’s ski industry
Guardian, Jan 2001
NASA Study Finds Increasing Solar Trend That Can Change Climate
NASA/GISS, March 2003
Sunspots reaching 1,000-year high
BBC, July 2004
“A new analysis shows that the Sun is more active now than it has been at anytime in the previous 1,000 years.”
Is Mild Winter a Sign of Climate Change?
NPR, Jan 2007
No more drought: it’s a ‘permanent dry’
TheAge Sep 2007
“Drought will become a redundant term as Australia plans for a permanently drier future”
A First! Snow Falls in Baghdad
AP, Jan 2008
Climate change threat to alpine ski resorts
Telegraph, May 2008
Spotless Sun: Blankest Year of the Space Age
NASA, Sep 2008
Arctic blast brings London earliest snow for 70 years
Evening Standard, Oct 2008
The Alps have best snow conditions ‘in a generation’
Telegraph, Dec 2008
‘Quiet Sun’ baffling astronomers
BBC, April 2009
“If the Sun’s dimming were to have a cooling effect, we’d have seen it by now.”
– Professor Mike Lockwood
Children die in harsh Peru winter
BBC, July 2009
World’s climate could cool first, warm later
NewScientist, Sep 2009
Beijing’s Heaviest Snow in 54 Years Strands Thousand
Bloomberg, Nov 2009
Heavy snow continues as temperatures set to plunge minus 20C
Herald (Scotland) Jan 2010
Quiet sun puts Europe on ice
New Scientist, May 2010
Freeze Challenges Power Supply
Xinhua (China), Jun 2010
Scientists see climate change link to Australian floods
Reuters, Jan 2011
Scientists:Don’t make “extreme cold” centerpiece of global warming argument
WaPo, Feb 2014
‘Polar vortex’ brings big freeze to North America
Telegraph UK, Aug 2014
Cold winters have been caused by global warming: new research
Telegraph UK, Oct 2014
Why global warming does not necessarily result in warmer winters
Economist, Mar 2015
Global warming will make winters in Britain even COLDER
Sun UK, Oct 2016
Climate change could make summers hotter and winters milder
SanDiegoTribune, Jan 2017
Is It Okay to Enjoy the Warm Winters of Climate Change?
Atlantic, Feb 2017
A warming Arctic can actually make our winters colder
Poopular Mechanics, Sep 2017
Climate change at work? Weather Service calls for third straight mild winter.
WaPo, Oct 2017
It’s cold outside. But that doesn’t mean climate change isn’t real.
USA Today, Dec 2017
Big snowfall, a cooler ocean and, yet, more signs of global warming
NBC, Jan 2018
Why climate change may be to blame for dangerous cold blanketing eastern U.S.
NBC, Jan 2018
Q&A: What does all this snow mean for climate change?
Guardian, Feb 2018
Why a Warming Arctic May Be Causing Colder U.S. Winters
NatGeo, Mar 2018
******
Did you not see the effect of solar activity on climate propaganda?
Did you notice the polarity of global warming winters flip from mild to brutal and back again with the rise and fall of the cycle?
If you did, you now know what to expect from “global warming” if the next solar cycle is low: more freezing heat.
That’s a prediction I would bet on.
Javier April 13, 2018 at 11:01 am
Ah, you see… Those that don’t agree with you are nasties.
I guess it takes one to know one…
You should know. You are the one calling them/us nasties. You complain how you are treated, yet you are the one calling names.
Dr. S, you tried to stamp the solar UV record flat. The Internet will never forget.
You got the SC 24 prediction right. And then you had to go and stuff things up.
You can fight Javier with the reconstructions you approve of, but it will do no good. Javier can clearly smell your character, just as many others can. If you hope that AGW sceptics are all aspy’s who can be bogged down in arguments over scientific minute, you are wrong.
We know what you did. I may sympathize with your reasons for doing the wrong thing. But it was still the wrong thing.
Dr. S, you tried to stamp the solar UV record flat.
You are confused or perhaps misinformed.This might put you back on track again:
http://www.leif.org/research/Reconstruction-of-Solar-EUV-Flux-1740-2015.pdf
http://www.leif.org/research/EUV-Magnetic-Field.pdf
“This is the first time we have seen a short and weak cycle …”
The CO2 did it.
Greetings from the Big Mango (BKK). This is a little bit off topic but maybe related to a quiet sun. The QBO has been alternating E W E W for many years, and the spring of 2016 should have been easterly but it’s repeated a Westerly flow instead. Any ideas?
Sandy, Minister of Future
Barton, C. A., & McCormack, J. P. (2017). Origin of the 2016 QBO disruption and its relationship to extreme El Niño events. Geophysical Research Letters, 44(21).
“The descent of the westerly phase of the quasi‐biennial oscillation (QBO) in equatorial stratospheric zonal wind was interrupted by the development of easterlies near 40 hPa (~23 km altitude) in early 2016. We use tropical meteorological analyses of wind and temperature to describe in detail the special circumstances by which equatorward‐propagating planetary waves produced this unprecedented disruption in the QBO. Our findings show that the subtropical easterly jet in the winter lower stratosphere during the 2015–2016 winter was anomalously weak owing to (1) the timing of the QBO relative to the annual cycle and (2) an extreme El Niño event. The weak jet allowed an unusually large flux of westward momentum to propagate from the extratropical Northern Hemisphere to the equator near the 40 hPa level. Consequently, the QBO westerlies at that level experienced sustained easterly acceleration from extratropical wave breaking, leading to the observed wind reversal.”
https://agupubs.onlinelibrary.wiley.com/doi/full/10.1002/2017GL075576
Watanabe, S., Hamilton, K., Osprey, S., Kawatani, Y., & Nishimoto, E. (2018). First Successful Hindcasts of the 2016 Disruption of the Stratospheric Quasi‐biennial Oscillation. Geophysical Research Letters, 45(3), 1602-1610.
“In early 2016 the quasi‐biennial oscillation in tropical stratospheric winds was disrupted by an anomalous easterly jet centered at ~40 hPa, a development that was completely missed by all operational extended range weather forecast systems. This event and its predictability are investigated through 40 day ensemble hindcasts using a global model notable for its sophisticated representation of the upper atmosphere. Integrations starting at different times throughout January 2016—just before and during the initial development of the easterly jet—were performed. All integrations simulated the unusual developments in the stratospheric mean wind, despite considerable differences in other aspects of the flow evolution among the ensemble members, notably in the evolution of the winter polar vortex and the day‐to‐day variations in extratropical Rossby waves. Key to prediction of this event is simulating the slowly evolving mean winds in the winter subtropics that provide a waveguide for Rossby waves propagating from the winter hemisphere.”
https://agupubs.onlinelibrary.wiley.com/doi/full/10.1002/2017GL076406
It seems pretty clear it was a 60-year anomaly caused by the humongous 2015 “El Niño.” It altered the patterns of tropical winds so much that pushed upward the descending QBO phase causing a hiccup in the QBO. A great opportunity to learn how things work.
@Javier- Thanks for links.
Sandy, Minister of Future
I remember how the predictions for Solar Cycle 24 were so far off. It did not follow the previous cycles, was much weaker than expected and underperformed all revised projections. Think the old girl has some more surprises for us yet. The first robin does not Spring make. Time will tell.
Sun spots numbers provide a rectified measure of solar activity. There are two major components at roughly P1 = 20 and P2 = 23.6 years. Rectification produces harmonics at about P1/2 = 10, P2*P1/(P2+P1) = 10.8, p2/2 = 11.8, and P2*P1/(P2-P1) = 131 years, the latter having the greatest uncertainty as it depends upon the small difference between the periods.
The plot below shows the SSN, a hypothetical PSD of the underlying processes, and a match between the SSN^2 PSD and the autoconvolution of the hypothetical PSD of the underlying processes, which is what rectification would produce.
http://oi66.tinypic.com/ffa2xi.jpg
I could perhaps get a better match if I futzed around with the amplitudes and widths of the peaks, but the PSD itself is merely an estimate, having its own error bars. In any case, further massaging of the representation is not necessary to recognize that the triple peaks near 1/11 yr^-1 align with the SSN^2 PSD and the autoconvolution of the HRP.
The finite length of the record and the quantized fuzziness of sun spot numbers limits resolution, so the ~131 year peak does not show clearly. However, the width of the 11 year clustered peaks indicates that these are not coherent sinusoids, but instead randomly driven resonances. However, local projections of future activity can be produced by propagating the damped oscillations forward. I’ve never gotten around to trying this, because it’s not my job. But, an enterprising researcher could build a credible model for prognostication on this basis.
Curve fitting is very easy (“with five parameter I can make it wiggle his trunk”) and the number of people who claim they can fit (all different, of course) the sunspot curve is legion. Here is a modern one
https://arxiv.org/pdf/1804.03617.pdf
http://www.leif.org/research/Qin-Wu-Fit-Cycles.png
They are all spurious, of course, as the generation of new-cycle spots from the debris of the old cycle has a large random component:
http://www.leif.org/EOS/Choudhuri-forecast.pdf
“The rising phase of the solar cycle is predictable, but not the declining phase: It may never be possible to predict maxima 7-8 years ahead of time! ”
So, no more cyclomania, please.
That’s really stupid, and not anything like what I have done.
Sun spots numbers provide a rectified measure of solar activity.
You seem to think that solar activity in every other cycle is negative [or what else do you mean by ‘rectify’]. That generates power at about 22 years, of, course, but so does 11 random positive number followed by 11 negative random numbers repeated many times.This is numerology, not science.
It is a signed oscillation between the Northern and Southern hemispheres.
Ther is no such thing, and it was not the figure you showed. Solar activity has no sign.
Then, your butterfly’s wings are just noise.
Then, your butterfly’s wings are just noise.
No, they are the signal.
A full cycle is completed when the poloidal field returns to its original orientation. That is approximately 22 years on average.
A full cycle is completed when the poloidal field returns to its original orientation.
No, that is what you call a cycle, but there is no cycle. There is a series of overlapping eruptions of activity each with a duration of about 17 years.
It starts in one state and returns to that state after some number of years. That’s a cycle. You are arguing against tautology.
It starts in one state and returns to that state
No, it most certainly does not. Where I live it is sunshine almost all the time. Occasionally it rains, so before the rain we same a state [sunshine], after the rain we return to the same state [sunshine], but nobody in his right mind would call that a cycle. Same with solar activity.
You have a very narrow view of what comprises a “cycle”.
Gor blimey, I’ve just browsed the whole of this thread for the first time, and I’ve never seen Svalgaard and Javier going hammer and tongs quite like this. What a waste of electrons! Can’t you moderators do summat abaht it?
It’s quite simple: spots belonging to one cycle do last for a spasm of about 17 years, as Svalgaard says. But that doesn’t make them a cycle, which should have an approximate period and show up in spectral analysis (that’s statistics not radiation). The ~11 year cycle shows up when overlapping spasms are added together, which is what Javier (and SILSO etc) was saying. Except “spasm” is my natty term.
Now, as to length of Cycle 24 measured from minimum to minimum, if 1 year is the standard between first spot of the new Cycle and minimum, then minimum is due in April 2019, which would be 10.3 years after the previous minimum, and shorter than average. But I think there is significant variation in that statistic (first spot of new spasm and minimum), and I expect Leif (I’ve now calmed enough to use his Christian name) will be able to enlighten us on that.
Best solar wishes to all,
Rich.
Perhaps the easiest way to see the difference between us is that Javier [and his ilk] is a ‘cyclist’ who believes that by finding or postulating and adding enough cycles, one can predict solar activity hundreds if not thousands of years forwards and backwards in time, while I am a ‘realist’ who believe [based on observations and theory] that this is not possible and that we can only predict with confidence one cycle ahead, and only when we have good measurements of the polar fields before the minimum, perhaps combined with the timing of appearance of new-cycle spots before the official minimum. Once we are about three years past the minimum, prediction becomes easy as the growth of a new ‘spasm’ [to use your nice word] is pretty deterministic [and the theory is well understood], in contrast to the build-up of the new polar fields which has a large random component and thus cannot be reliably predicted [we have to wait until it has run it course to see what the result is].
None of this is controversial and is generally accepted by solar physicists. Of course, you can always find people who disagrees with the detail, but their opposition quietly fades away as the cycle develops as predicted.
See – owe to Rich April 14, 2018 at 1:10 pm
The difference between Javier and me, is this:
Javier is a ‘cyclist’. He believes than solar activity is controlled by strict cycles, that when added together can predict solar activity hundreds, even thousands, of year forwards and backwards in time. These long-term predictions are only possible if the cycles are strictly periodic, otherwise phase differences will quickly build up rendering the predictions useless.
I am a ‘realist’ and think that solar activity can only be forecast with confidence one cycle ahead. This view derives from observations and theory [i.e. understanding of how the solar dynamo works]. Each ‘cycle’ is about 17 years long and is born from the polar fields that are advected [moved] into the interior and is build up from the debris of dead sunspots migration to the poles. Those movements are due to a ‘meridional’ circulation driven by a small temperature difference between the poles and the equator [like the Hadley cells in the Earth’s atmosphere]. The [weak] polar fields are amplified in the interior [by induction and ‘winding up by differential rotation] to become strong flux concentrations [‘ropes’] moving towards the equator [by the same meridional circulation that has to close somehow] and also, because they are buoyant, up towards the surface. On their way they are shredded into many ‘strands’ by the granulation cells. Once at the surface the shredding stops and the rope can reconstitute itself into [generally] two sunspots, that immediately begin to decay [eaten away at the edges by the granules]. The magnetic flux does not decay but spreads out into the area around the spots and are then caught up in the meridional circulation and moves towards the po
area around the spots and are then caught up in the meridional circulation and moves towards the poles, completing the cycle. This takes place all the time and new spots are generated even if old spots from the previous cycle are still around, resulting in old and new cycles overlapping for some years. The result of adding both old and new cycle spots is, of course, a shortening of the 17-year individual cycles to the familiar 11-year sunspot cycle. The conversion of the polar fields into ‘toroidal’ fields that form the sunspots is rather deterministic, allowing a firm prediction of the cycle size only the polar fields are known [by direct measurement]. As only a very small amount of the flux actually makes it to the poles [something like a 1/100th] we are dealing with ‘small number statistics and large [random] fluctuations can occur [like it is possible to get all ‘heads’ when flipping a coin, say, four times]. This cannot easily be predicted and we have to wait for the polar fields to formed so we can measure them] and a large random component is thus an important part of the cycle, causing a large [unpredictable] variation in the size of the cycles. Of course, if we have a large cycle, the is more flux to work with, so the polar fields have a tendency to be large [and conversely for a small cycle] so, statistically, large cycles [and small one] will occur in ‘bunches’ giving rise to longer pseudo cycles.
All this is not controversial but is generally accepted by solar physicists. Of course, as in all science, there are [small] disagreements about the details. And, from time to time, attempts are made to introduce novel ideas and contrary methods, but they usually become failures, but are welcome because that is how science [possibly] advances. On the other hand, scientists are usually very conservative and new theories are only accepted if the evidence is overwhelming and compelling, and even then, some people cling to the old ideas way past their ‘sell by’ date [Planck: “science progresses one funeral at a time”].
“He believes than solar activity is controlled by strict cycles, that when added together can predict solar activity hundreds, even thousands, of year forwards and backwards in time.”
I cannot speak to what Javier believes, but what we have here is two dominant resonances being driven randomly. They cohere for some characteristic length of time over which predictions can be made with quantifiably increasing uncertainty. Beyond that characteristic time, the uncertainty grows rapidly so that assurance in the result basically falls off a cliff. Whether that characteristic time is a single cycle or ten, I could not say without doing significant analysis that I do not have time for. But, it is a straightforward application of Kalman Filtering theory using a model with restricted complexity.
what we have here is two dominant resonances being driven randomly
Except that is not how the sun works. We know quite a lot about the dynamo creating and maintaining solar activity.
Yes, it is. The PSD does not lie. This is very typical behavior for systems governed by partial differential equations. A modal expansion provides the solution.
This is very typical behavior for systems governed by partial differential equations
Except that the sun is not so governed. Its magnetism is controlled by bodily movements of plasma, i.e. the initial conditions are changing all the time.
‘i.e. the initial conditions are changing all the time.’
Yes, it is a stochastic system. Just the sort of thing for which the Kalman Filter formalism was devised.
a stochastic system
No, it is not ‘a’ stochastic system, it is billions of such systems on top of each other, not governed by a single equation. You are out of your depth here. When you only have a hammer, everything looks like a nail.
I’m sorry but, it is very clearly you who is out of his depth. It’s too bad. I could lead you to significant progress.
I could lead you to significant progress.
The world is waiting with bated breath for your revelations that surely will revolutionize modern physics. Perhaps you should already reserve a flight to Stockholm to pick up your Nobel Prize.
Yes.
Well Leif, I’m glad I stirred you into that action, which was very informative.
The nub of the problem is talking at cross purposes because of the overloading of the term “cycle”, which is why I introduced the term “spasm”, though I don’t expect that to catch on. “Cycle” certainly is sometimes used in the sense that you use for the 17-year evolution of sunspots, as for example in the human life cycle which isn’t properly periodic. But as far as solar cycles and numbers are concerned, the generally accepted usage for the purposes of naming is that a Cycle refers to the interval between two minima. So for that reason I wish the article title had said something like “Next Cycle 25 spots have now been seen”.
Regarding cyclomania etc, the really interesting question is whether the Sun is truly chaotic beyond some timescale, which I think is your position, so we can have no idea of when the next grand Minimum will occur, or whether there are driving forces which alter the probability of one occurring in a particular timeframe. I think the jury will be out on that question for several centuries to come (I’m being optimistic regarding the survival of said jury).
Thanks, Rich.
Hi Leif, just a quick couple of questions. You say:
“It looks to me that SC25 will be a bit stronger than SC24, so probably no Grand Minimum this time.”
I take it this means you are ruling out the possibility of a Grand Solar Minimum beginning with SC25? Are you also ruling out the possibility that a GSM may manifest during SC26?
Zharkova predicts that SC25 will be slightly weaker (whereas you are predicting it will be slightly stronger) than SC24 and SC26 will be a lot weaker still, forecasting a GSM to take place between 2020-2053. Any comments on her work?
take it this means you are ruling out the possibility of a Grand Solar Minimum beginning with SC25? Are you also ruling out the possibility that a GSM may manifest during SC26?
We can only predict one cycle ahead, so SC26 is out of reach.
Zharkova predicts that SC25 will be slightly weaker
Her work has been thoroughly debunked, so I’ll not put much credence in it.
https://arxiv.org/pdf/1512.05516.pdf
Thanks. Actually, the paper which you link to in support of your statement that ‘her work has been thoroughly debunked’ is not the study to which I was referring. It ‘thoroughly debunks’ a separate study on millennial scale prediction of solar activity, which no doubt relies heavily on her solar dynamo model, but the time scales involved are very different.
I might be wrong, but I in an interview with David Hathaway some years ago I think he said that they were expecting and looking for signs (specks) of Cycle 25 already at the peak of cycle 24, which back then was expected to happen in May 2013. Again, I might remember wrong but in that sense the arrival of Cycle 25 cannot be considered early(?)
So Hathaway was then wrong by almost a year as to when the peak would occur. Tough job these prediction thingies.