By Christopher Monckton of Brenchley
Skeptics 1, Fanatics 0. That’s the final score.
The corrected mid-range estimate of Charney sensitivity, which is equilibrium sensitivity to doubled CO2 in the air, is less than half of the official mid-range estimates that have prevailed in the past four decades. Transient sensitivity of 1.25 K and Charney sensitivity of 1.45 K are nothing like enough to worry about.
This third article answers some objections raised as a result of the first two pieces. Before I give some definitions, equations and values to provide clarity, let me make it plain that my approach is to accept – for the sake of argument only – that everything in official climatology is true except where we have discovered errors. By this acceptance solum ad argumentum, we minimize the scope for futile objections that avoid the main point, and we focus the discussion on the grave errors we have found.
Definitions
All definitions except that of temperature feedback are mainstream. I am including them in the hope of forestalling comments to the effect that there is no such thing as the greenhouse effect, or that temperatures (whether entire or delta) cannot induce feedbacks. If you are already well versed in climatology, as most readers here are, skip this section except for the definition of feedback, where climatology is at odds with mainstream feedback theory.
Greenhouse gases possess at least three atoms in their molecules and are thus capable of possessing or, under appropriate conditions, acquiring a dipole moment that causes them to oscillate in one of their vibrational modes and thus to emit heat.
Carbon dioxide (CO2), being symmetrical, does not possess a dipole moment, but acquires one in its bending vibrational mode on interacting with a near-infrared photon. To use Professor Essex’s excellent analogy, when a greenhouse gas meets a photon of the right wavelength it is turned on like a radiator, whereupon some warming must by definition occur.
The non-condensing greenhouse gases exclude water vapor.
Water vapor, the most significant greenhouse gas by quantity, is a condensing gas. All relevant changes in its atmospheric burden are treated as temperature feedbacks. Its atmospheric burden is thought to increase by 7% per Kelvin of warming in accordance with the Clausius-Clapeyron relation (Wentz 2007).
Emission temperature would obtain at the Earth’s surface if there were no non-condensing greenhouse gases or feedbacks present. Emission temperature is a function of insolation, albedo and emissivity (assumed to be unity), and of nothing else. As non-condensing greenhouse gases and feedbacks warm the atmosphere, the altitude at which the emission temperature obtains rises.
Radiative forcing (in W m–2) is an exogenous perturbation in the net (down minus up) radiative flux density at the top of the atmosphere. Forcings become warmings via –
The Planck sensitivity parameter (in K W–1 m2: Roe 2009), the quantity by which a radiative forcing is multiplied to yield the reference sensitivity. To a first approximation, it is the first derivative of the fundamental equation of radiative transfer with respect to the Earth’s emission temperature and emission flux density. Its value is thus dependent on insolation and albedo. The first derivative is the change in temperature per unit change in flux density, i.e., at today’s values 255.4 / (4 x 241.2) = 0.27 K W–1 m2. However, owing to altitudinal variation, the modeled value today is 0.31 = 3.2–1 K W–1 m2 (IPCC 2007, p. 631 fn.).
Temperature feedback (in W m–2 K–1), an additional forcing proportional to the temperature that induces it, in turn drives a feedback response (in K) that modifies the originating temperature. This definition of a feedback as a modification of a signal (not merely of a change in the input signal but also of the input signal itself) is standard in all applications of control theory except climatology, where it has been near-universally but falsely imagined that an input signal (emission temperature in the climate) does not induce a feedback, even where feedback processes are present and will modify even the tiniest change in that signal. It is this error that has misled official climatology into overestimating climate sensitivities.
Models do not implement feedback math explicitly. However, their outputs are routinely calibrated against past climate. Paper after paper incorrectly states that the entire 33 K difference between today’s surface temperature of 288 K and the emission temperature of 255 K that would prevail today in the absence of greenhouse gases or of feedbacks is driven by the directly-forced warming from the non-condensing greenhouse gases and the feedbacks induced by that warming.
For instance, Lacis (2010) says that three-quarters of the difference between emission temperature and today’s temperature is the feedback response to the non-condensing greenhouse gases: i.e, that the feedback fraction is 0.75, which, given the CMIP5 reference sensitivity of 1.1 K (Andrews 2012) would yield Charney sensitivity of 4.4 K. Sure enough, the CMIP5 models’ feedback fraction, at 0.67, is close to Lacis’ value, implying Charney sensitivity of 3.3 K. It will be proven that there is no justification whatever for mid-range estimates anything like this high. They arise solely because the models have been tuned over the decades to yield Charney sensitivities high enough to account for the entire 33 K.
- Reference sensitivity is the temperature change in response to a radiative forcing before taking feedbacks into account.
- Equilibrium sensitivity, the warming expected to occur within a policy-relevant timeframe once the climate has resettled to equilibrium after perturbation by a radiative forcing (such as doubled CO2 concentration) and after all temperature feedbacks of sub-decadal duration have aced, may be somewhat larger than –
- Transient climate sensitivity, the warming expected to occur immediately in response to a forcing. The chief reason for the difference is the delay occasioned by the vast heat-sink that is the ocean.
- Charney sensitivity, named after Dr Jule Charney, is equilibrium sensitivity to doubled CO2.
Zero-dimensional-model equation relates reference and equilibrium sensitivities or temperatures via the feedback fraction, which accounts for the entire difference between them. Control theory in all applications except climatology uses both forms of (1) and of its rearrangement, (2), but climatology has not hitherto appreciated that the right-hand form of each equation is permissible. For this reason, it has failed to accord sufficient – or in most instances any – weight to the feedback response that arises from the presence of emission temperature. As a result of this grave error, official climatology has greatly overestimated the feedback fraction and hence all transient and equilibrium climate sensitivities.
![]()
Input variables
Input variables are from official sources. Net industrial-era anthropogenic radiative forcing to 2011 was 2.29 W m–2 (IPCC 2013, table SPM.5); the Planck sensitivity parameter is 3.2–2 K W–1 m2 (IPCC 2007, p. 631 fn.); the radiative energy imbalance to 2010 was 0.59 W m–2 (Smith 2015); industrial-era warming to 2011 was 0.75 K (least-squares trend on the HadCRUT4 monthly global mean surface temperature anomalies, 1850-2011: Morice 2012); and the radiative forcing at CO2 doubling is 3.5 W m–2 (Andrews 2012); the Stefan-Boltzmann constant is 5.6704 x 10⁻⁸ W m–2 K–4 (Rybicki 1979); albedo without non-condensing greenhouse gases or feedbacks would be 0.418 (Lacis 2010); global mean surface temperature without greenhouse gases would be 252 K (ibid.); and today’s global mean surface temperature is 288.4 K (ISCCP 2016).
Mid-range industrial-era Charney sensitivity
Now for the simplest proof of small Charney sensitivity. Net industrial-era manmade forcing to 2011 was 2.29 W m–2, implying industrial-era reference warming 2.29 / 3.2 = 0.72 K. The radiative imbalance to 2010 was 0.59 W m–2. Warming has thus radiated 2.29 – 0.59 = 1.70 W m–2 (74.2%) to space. Equilibrium warming to 2011 may thus prove to have been 34.7% greater than the observed 0.75 K industrial-era warming to 2011. The feedback fraction for transient sensitivity is then f = 1 – 0.716 / 0.751 = 0.047, so that transient climate sensitivity is 1.09 / (1 – 0.047) = 1.15 K. Industrial-era f for equilibrium sensitivity is 1 – 0.716 / (0.751 x 1.347) = 0.29, implying Charney sensitivity 1.09 / (1 – 0.29) = 1.55 K.
That’s it. Charney sensitivity is less than half of the 3.3 K mid-range estimate in the CMIP3 and CMIP5 general-circulation models, distorted as they are by the long-standing misallocation of all 33 K of the difference between today’s temperature and emission temperature to greenhouse-gas forcings and consequent feedbacks.
Mid-range pre-industrial Charney sensitivity
To show how official climatology’s grave error arose, we shall study how it has been apportioning that 33 K difference between today’s temperature and emission temperature.
Lacis (2010) estimated albedo without greenhouse gases as 0.418, implying emission temperature [1364.625(1 – 0.418) / (4σ)]0.25 = 243.26 K (Stefan-Boltzmann equation, with unit emissivity). However, Lacis estimated the global mean surface temperature without non-condensing greenhouse gases as 252 K, implying a small feedback response to emission temperature, arising from melting equatorial ice and about 10% of the current atmospheric burden of water vapor. That 10% value can be obtained from the 7% per Kelvin increase in water vapor found in Wentz (2007): thus, 100 / 1.0733 = 10.7.
Global temperature in 1850 was 287.6 K. The 35.6 K difference between 287.6 and 252 K was given as 25% [8.9 K] directly-forced warming from the naturally-occurring, non-condensing greenhouse gases and 75% [26.7 K] feedback response to that greenhouse warming. However, if the feedback fraction f over Lacis’ 50-year study period were constant, for transient sensitivity f would be 1 – (243.26 + 8.9) / 287.6 = 0.123, and transient sensitivity itself would be 1.09 / (1 – 0.123) = 1.25 K. If an energy imbalance in 1850 might eventually increase that year’s temperature by 10%, then f = 1 – (243.26 + 8.9) / (287.6 x 1.1) = 0.203. Charney sensitivity would then be 1.09 / (1 – 0.203) = 1.4 K.
In Lacis, the 44.2 K difference between emission and 1850 temperatures comprises 8.7 K (3.6%) feedback response to the 243.3 K emission temperature and, since Lacis takes transient-sensitivity f = 0.75, directly-forced greenhouse warming of 8.9 K inducing 26.6 K (300%) feedback response. Thus, Lacis imagines the feedback responses to emission temperature and to direct greenhouse warming are 3.6% and 300% respectively of the underlying quantities, which is absurd. What is more, Lacis says that the feedback fraction 0.75 applies also to “current climate”, an explicit demonstration that climatology’s error leading to overstatements of equilibrium sensitivity in the models arose from its neglect of the large feedback response to emission temperature.
Our corrected method finds transient-sensitivity f a lot less that Lacis’ 0.75. It is just 0.123. Then the 44.2 K difference between 1850 temperature and emission temperature comprises 243.3 f / (1 – f) = 34.1 K feedback response to emission temperature; 8.9 K directly-forced greenhouse warming; and 8.9 f / (1 – f) = 1.2 K feedback response to direct greenhouse warming. Thus, feedback responses to emission temperature and direct greenhouse warming are identical at f / (1 – f) = 14% of the underlying quantities.
In practice, ice-melt would steadily reduce the ice-covered surface area, reducing the surface-albedo feedback and hence the overall feedback fraction, though that effect might be largely canceled by increased water vapor and cloud feedback. The assumption of a uniform feedback fraction throughout the transition from emission temperature to 1850 temperature is, therefore, not unreasonable. Other apportionments might be made: but it would not be reasonable to make apportionments anywhere close to those of Lacis or of the CMIP models.
Note how well the industrial and pre-industrial sensitivities cohere, and how very much smaller they are than official climatology’s 0.67-075. The corrected industrial-era values, just 1.25 K transient sensitivity and 1.55 K equilibrium sensitivity, necessarily follow from the stated official definitions and values. In my submission, it is no longer legitimate for official climatology to maintain that the mid-range estimate of Charney sensitivity is anything like as high as the CMIP3/CMIP5 models’ 3.3 K.
Certainty about uncertainties
What of the uncertainties in our result? Some of the official input values on which we have relied are subject to quite wide error margins. However, because our mid-range estimate of Charney sensitivity is low, occurring at the left-hand end of the rectangular-hyperbolic curve of Charney sensitivities in response to various values of the feedback fraction, the interval of plausible sensitivities is nothing like as broad as the official interval, which I shall now demonstrate to be a hilarious fiction.

The Charney report of 1979, echoed by several IPCC Assessment Reports, gives a Charney-sensitivity interval 3.0 [1.5, 4.5] K. The 2013 Fifth Assessment Report retains the bounds but no longer dares to state the mid-range estimate, for a reason that I shall now reveal.
By now it will be apparent to all that the chief uncertainty in deriving transient or equilibrium sensitivities is the value of the feedback fraction. I found it curious, therefore, that IPCC did not derive its mid-range estimate of Charney sensitivity from the mean of the bounds of the feedback fraction’s interval. The mismatch is quite striking (see below)
IPCC’s mid-range Charney sensitivity 3.0 K implies a feedback fraction 0.61, which is three times closer to the upper bound 0.74 than to the lower bound 0.23. If IPCC had derived its mid-range Charney sensitivity from a value of the feedback fraction midway between the bounds, its 3 K mid-range estimate would have fallen by an impressive 0.75 K to just 2.25 K:

How, then, did IPCC come to imagine that mid-range Charney sensitivity could be as high as 3 K? The Charney Report of 1979, the first official attempt to derive Charney sensitivity, provides a clue. On p. 9, Charney found that the interval was 2.4 [1.6, 4.5] K, implying a feedback fraction close enough to the mean of its bounds. However, by p. 16 he had decided that his eponymous interval was “in the range 1.5-4.5 K, with the most probable value near 3 K”. Why did he go for 3 K? And why did IPCC and CMIP5 remain in that ballpark for four decades? Perhaps it was because, owing to their error, they could not otherwise account for the 33 K difference between emission temperature and present-day temperature.

Be that as it may, where (a) the feedback fraction is defined as 1 minus the ratio of reference to equilibrium temperature (Eq. (2)), where (b) the mid-range value of the feedback fraction is the mean of the bounds of its interval, and where (c) the mid-range estimate of equilibrium sensitivity is twice the lower-bound estimate, the upper bound of the feedback fraction must be unity. Then the upper bound of equilibrium sensitivity will fall precisely on the singularity in the rectangular-hyperbolic response curve, and will therefore be somewhere between plus and minus infinity (see above). This is definitive evidence that the supposed Charney-sensitivity interval 3.0 [1.5, 4.5] K is nonsense, and that all attempts to ascribe a statistical confidence interval to it are likewise nonsense.
Is our mid-range estimate of Charney sensitivity reasonable?
Rud Istvan, in one of many interesting comments on the earlier articles, says Lewis & Curry (2014) found transient and equilibrium sensitivities to be 1.3 K and 1.65 K respectively, implying that Charney sensitivity is 1.25 times transient sensitivity, not 1.37 times as I calculated earlier. In that event, the feedback fraction is 1 – 0.716 / (0.751 x 1.25) = 0.237, implying Charney sensitivity 1.09 / (1 – 0.237) = 1.45 K, similar to the 1.5 K in Lewis 2015.
Rud offers the following interesting confirmatory method. In IPCC (2013), the mid-range estimates of the sub-decadal temperature feedback sum is 1.6 W m–2 K–1, since the feedbacks other than the water-vapor feedback sum to zero. Multiplying the feedback sum by the Planck parameter gives a mid-range feedback fraction 0.5 (Table 1). Note in passing that, as discussed earlier, the upper-bound feedback fraction works out at the absurd value 1.0.

Rud goes on to point out that, as several papers show, the CMIP5 models produce about half the observed rainfall, implying that the modeled water-vapor feedback is double the true value. Therefore, he says, the true feedback fraction is half the CMIP5 models’ estimate. That means 0.25, giving a Charney sensitivity of 1.09 / (1 – 0.25) = 1.45 K.
I shall let Rud Istvan have the last word:
“This is not coincidental. The ‘best’ Charney sensitivity, whether calculated using the energy budget, or observed v. modeled via Bode’s feedback fraction f, is half of the ‘best estimate’ in IPCC (2007). I agree with Christopher Monckton of Brenchley. It’s game over.”
I’m.still waiting on Mosher to drop in and destoy your argument with a single incomprehensibly cryptic rebuttal…
Well, anyone who wants to undermine our result will have not one but two arguments to rebut.
Two? Presumably the mathematical (feedback theory), and empirical (Lewis & Curry (2014))
The theoretical argument (pre-industrial) and the empirical (industrial-era) are the two arguments. They are distinct, though they share some common features. And they cohere in their results. Lewis & Curry (2014) and Lewis (2015) use a different and less simple method to reach the same result. Nic Lewis is a neighbor here in the English West Country.
I wish we could edit our typos… I presume Willis is also working on his response. Excellent work Your Lordship.
TCS and ECS are guesses,
requiring many assumptions,
and the use of very questionable surface
temperature data — with more wild guess
infilling than actual measurements …
and even they are repeatedly adjusted !
The best we can do now is to create
a worst case estimate of warming,
by assuming 100%
of the measured warming
in a given time period
was caused by CO2.
If you use the weather satellite era,
since 1979, and assume all warming
was caused by CO2, the TCS is about
+1 degree C. per CO2 doubling = harmless.
If you use the period since 1750,
and blame 100% of the
very haphazardly measured /
(minimal Southern Hemisphere
data before 1940)
wild guessed warming on CO2,
the WORST CASE TCS
is about +1.5 degrees
per CO2 doubling = harmless
Any attempt to claim one “knows” TCS,
or the more difficult concept of ECS,
is a self-serving lie.
Even a worst case TCS or ECS estimate
is just a rough estimate.
because temperature
measurements before satellites
are very rough data,
and feedbacks,
if any, are unknown.
The claim of a positive feedback,
with no scientific proof, is weak
— that’s just like saying
we had no positive feedback
(or runaway warming)
for 4.5 billion years
… and then suddenly
man made CO2
triggered a brand new
water vapor positive feedback
in recent decades !
Of course anything goes
in modern climate “science”.
I suppose the fairy tale of a “new”
water vapor positive feedback
goes well with the other fairy tale
the global warmunists love,
which was used in the
TCS estimate of +1 (above):
— 4.5 billion years
of natural climate change
suddenly stopped in 1940.
— Aerosols took over
as the “climate controller” in 1940.
— Aerosols fell out of the sky in 1975, and then
CO2 took over as the “climate controller”.
No one even tries to explain
how a water vapor positive feedback
would suddenly appear … or how
natural climate change would suddenly
disappear … because in modern climate “science”,
you can always EXCLAIM anything,
but never have to EXPLAIN anything !
Monckton of Brenchley seems overconfident,
and in climate science that has always meant
WRONG — 100% of the time in the 20 years
I’ve been following the subject.
In climate science,
which I consider to be
“no one knows science”,
you can be wrong
but still be much closer
to “the truth”,
than the IPCC.
I still believe the person
who says “I don’t know”
can be the smartest person
in the room, when the subject is
climate science.
My four lessons from 20 years of reading:
(1) Don’t predict the future climate,
or believe predictions of the future climate,
(2) Don’t be so sure you, or anyone else,
have “the answer”, and
(3) Don’t think you can make precise calculations using
the huge margin of error (my opinion, not “official” margins)
surface temperature “measurements”, and
(4) Remember that politicians love to use a “crisis”
to gain power, even a fake crisis like global warming,
… by claiming a catastrophe is ahead
and only THEY / THE GOOBERMINT
know how to prevent it !
My climate change blog
for people with common sense,
which leaves out leftists !
http://www.elOnionBloggle.Blogspot.com
It would be easier for followers of this thread if Mr Greene would be kind enough to avoid excessive use of the carriage return in laying out his comments.
Nor is his allegation that I am “over-confident” at all fair. I have set out an argument simple enough for anyone with sufficient determination to follow without too much difficulty. The argument in no way depends on my personality, confident or otherwise. It stands or falls by such intrinsic merits as it may be thought to possess. That, like it or not, is how science works.
Stepwise refinement of science! Who could ask for more?
Well done to all.
Many thanks to Steve Richards. The comments here have indeed been of immense value in assisting us in refining and improving our result.
acquiring a dipole moment that causes them to oscillate in one of their vibrational modes and thus to emit heat.
You may find it immensely helpful to know that IR radiation is an electromagnetic wave, not “heat”, which is vibrational kinetic energy. It is not when they acquire vibrational energy that they emit a photon but when they lose it.
Greg is, as usual, intellectually dishonest. Had he cited me in full, it would have been apparent to all that it was not the photons of near-infrared radiation but the CO2 molecules that, on interacting with such photons, acquire a dipole moment that causes them to oscillate in one of their vibrational modes (the bending mode being of principal relevance with the CO2 molecule), and thus to emit heat.
At no point in my outline of the relevant optical physics, which I learned by sitting at the feet of arguably the world’s most eminent living professor in that subject, had I in any way suggested that infrared radiation itself constituted heat.
Lord MoB,
You are being somewhat unfair to Greg here. I don’t know Greg but his statement regarding IR being radiation not heat is correct. Your attempt to discredit his statement is unwarranted.
It may be that your use of the words ’emit heat’ are misleading. Heat is energy in transit from hot to cold. Once vibrationally excited through higher energy absorption, a CO2 molecule will emit radiation. Radiation is not heat (noun), as you correctly pointed out later, but whether that radiation can be considered ‘to heat’ (verb) will depend on the temperature of the receiving molecule. If the receiving molecule is colder than the CO2 emitter, then the receiver will ‘heat up’ as it will have absorbed the radiation for internal (thermal) energy gain. So your vibrating CO2 molecule may or may not emit heat but it will certainly emit radiation. An ice cube in a warm room emits radiation but it does not emit heat. The radiation emitted by a CO2 molecule after it has absorbed LW radiation will have no effect on the temperature of the Earth. In this sense, so-called Radiative Forcing is zero in terms of temperature as the radiation emitted by atmospheric CO2 is thermally irrelevant to the planet’s surface (unless that surface locally is cooler than the emitter).
[“To use Professor Essex’s excellent analogy, when a greenhouse gas meets a photon of the right wavelength it is turned on like a radiator, whereupon some warming must by definition occur.“]
Not if the room is warmer than the radiator. To what definition do you refer?
Maybe you could ask ‘arguably the world’s most eminent professor’ to clarify?
Arfurbryant seems to be quibbling somewhat. If the CO2 molecules, on being induced to oscillate, do not warm their surroundings, then there is no greenhouse effect. Since they do, Professor Essex’s analogy is apt.
Lord MoB,
You are perfectly entitled to accuse me of quibbling, although it is ironic that this accusation comes from someone who prides himself on being objective and specific when it comes to the use of language.
Nevertheless, my quibbling does not obscure the fact that your use of the words ’emit heat’ is incorrect.
I am perfectly happy to accept that the oscillating CO2 molecules may conduct heat to neighbouring molecules but that transfer of heat is not by radiation but by conduction. As each CO2 molecule is surrounded by roughly 2500 non-absorptive molecules, the chance of such radiation being absorbed by a molecule capable of such absorption is minuscule.
In this sense, I repeat, the Radiative Forcing figure is pretty much meaningless. No radiation emitted by atmospheric CO2 has any warming effect for the planet surface. What little conductive heating there is will be virtually unmeasurable.
I am sure Professor Essex did not intend his radiator description to apply to the CO2-induced warming effect as surmised by the IPCC…
Kind regards,
Arfur
Neomarxists and post modern have their own logic and facts don’t matter if it does not support their “cause”.
The intolerance of the totalitarian faction in the West has now become extreme and vicious. Those of us who dared to question the Party Line on climate were the first victims of that spite. However, they have made a strategic mistake in peddling the climate nonsense. Their mistake is to state, falsely, that their Party Line is science-based when it is really hatred-based. Science has now proven their Party Line wrong.
Lord MoB,
You are perfectly entitled to accuse me of quibbling, although it is ironic that this accusation comes from someone who prides himself on being objective and specific when it comes to the use of language.
Nevertheless, my quibbling does not obscure the fact that your use of the words ’emit heat’ is incorrect.
I am perfectly happy to accept that the oscillating CO2 molecules may conduct heat to neighbouring molecules but that transfer of heat is not by radiation but by conduction. As each CO2 molecule is surrounded by roughly 2500 non-absorptive molecules, the chance of such radiation being absorbed by a molecule capable of such absorption is minuscule.
In this sense, I repeat, the Radiative Forcing figure is pretty much meaningless. No radiation emitted by atmospheric CO2 has any warming effect for the planet surface. What little conductive heating there is will be virtually unmeasurable.
I am sure Professor Essex did not intend his radiator description to apply to the CO2-induced warming effect as surmised by the IPCC…
Kind regards,
Arfur
arfur
essentially I agree with your comment. The re-radiation of CO2 at 14-15 can only be met with same of water which makes about 0.4 or 0.5 % of the atmosphere. To the rest of the gases it is mostly permeable.
This is not that to say I am denying that there is some kind of a GH effect. But it comes mostly just from pure clouds. I noticed here that in winter Tmin rises quite significant when clouds move in overnight.
henrys
Yes. The big question is exactly how much ‘warming effect’ can a trace non-condensing gas have? When people like Lacis start insisting that CO2 is 26% of the GHE without any empirical evidence to support such comments, one has to ask why a 40% increase in CO2 and an even large increase in CH4 have had so little impact – even if you assume that all the ‘measured’ warming is due to to the increase in so-called Greenhouse gasses – an assumption which is logically unsound.
Sorry henryp… autocorrect! 🙂
Arfur and HenryP: CO2 molecules usually don’t “re-emit” photons they have absorbed. Molecules at atmospheric pressure are colliding about 10^9 times per second. The average CO2 molecule in an excited state takes about 1 second to emit a photon. After a CO2 absorbs a photon, it is collisionally relaxed (or thermalized) long before it emits a photon. Collisions also excite CO2 molecules. The warmer the temperature, the large the fraction of CO2 molecules that are in an excited state. The net result is that emission depends only on the local temperature, not on absorption of a photon.
It is colder higher in the atmosphere than near the surface. Since emission (but not absorption) depends on temperature, there is more LWR traveling upward through the atmosphere than downward. This is just the 2LoT – heat (the net flux of energy) travels from hot to cold. So rising CO2 interferes more with the outward flux of energy.
Frank,
You are correct. I have made this exact point on other sites. But it seems most people would rather not let the truth stand in the way of a good story…
Frank,
Just to clarify, you are correct in the thrust of your comment although I think the relaxation time is more like 6-10 microseconds, rather than one second. Either way, there will be time for hundreds or even thousands of collisions before the CO2 molecules can re-emit.
Arfur wrote: Just to clarify, you are correct in the thrust of your comment although I think the relaxation time is more like 6-10 microseconds, rather than one second. Either way, there will be time for hundreds or even thousands of collisions before the CO2 molecules can re-emit.
Correct. Collisions occur about 10^9 times a second, but only a small fraction of collisions relax an excited CO2, about 1 in 10^4. Excited CO2 emits about 1 photon per second.
Frank,
Thanks for that info.
Arfur
In Bode’s paper there is an implicit assumption. It is the reference which is usually taken as a zero volt ground. All the other voltages are measured relative to that. ie. the negative lead of your volt meter is connected to ground and you measure everything else with respect to that.
If we are talking about the climate and feedbacks, what is the reference? If you are allowed to take the reference as the temperature right now, then the feedback will indeed act on “even the tiniest change” in temperature. If we take absolute zero as the reference then we have an entirely different kettle of fish.
When Hansen applied Bode’s analysis to the climate he just threw it in and started using it. He didn’t state, let alone justify, the implicit assumptions that he apparently didn’t know he was using.
Reference in surface climatology is the temp of space. ~3°K
How surface temps are being regulated by WV.
https://micro6500blog.wordpress.com/2016/12/01/observational-evidence-for-a-nonlinear-night-time-cooling-mechanism/
Sensitivity to insolation, derived from biannual change in forcing.
https://micro6500blog.wordpress.com/2016/05/18/measuring-surface-climate-sensitivity/
I once learned, the hard way, that a certain circuit had a 500 volt reference level. Wrong assumptions can literally get you killed or, in that case, deeply shocked.
If we’re trying to apply feedback analysis, the reference will depend on the mechanism involved.
If I understand correctly, the reason Hansen invokes feedback is as follows: Increased CO2 will cause some warming. That warming will cause extra water vapor to enter the atmosphere. That will cause additional warming. ie. The CO2 induced warming will be accompanied by a water vapor induced positive feedback. In that light, we could speculate that the reference might be related to the properties of water, maybe the dew point (mentioned in your link) or the moist adiabatic lapse rate.
I haven’t seen a rigorous physics based development of feedback theory related to climate sensitivity. The most honest, and probably best, I have seen is CM’s comment on the subject.
It is the vapor pressure of the water vapor at the surface, regulates low temp and high temp, and at least some of the changes to the moist lapse rate difference between day and night is from the extraction, and restoring of the the energy used in regulating surface temps.
But that’s the regulated, ie output side of the regulator, space is ground, and if you look at how well temps are regulated in K, it’s pretty fricking good at it.
It’s really an emergent switching regulator, where both the surface and water vapor replace the capacitors.
At the university, circa 1958, the temperature of space was given as 4 K. Is it a constant? Is it universal in all directions? Or does it vary with solar activity or changes in the ionosphere?
The temp of Space, is nearly identical in all directions, as measured by COBE, and WMAP.
And the variance is in uK
In response to CommieBob, one should not expect the climate to behave like an op-amp, but one may design an op-amp to demonstrate certain specific aspects of how the climate may be expected to behave.
If one is considering the 44.2 K of temperature difference between the Earth’s emission temperature of 243.25 K without any greenhouse forcings or feedbacks (assuming Lacis’ albedo 0.418) and the temperature of 287.6 K in 1850, the sum of the emission temperature and the 8.9 K directly-forced warming from the presence of the naturally-occurring, non-condensing greenhouse gases may serve as the reference temperature, if one assumes that the feedback fraction was invariant across the period. Then the 1850 temperature is the equilibrium temperature. Other assumptions are of course possible: but, as explained in the head posting, Lacis’ apportionment of the 44.2 K seems altogether unjustifiable.
I agree that Hansen (1984), followed closely by Schlesinger (1985), did not quite know what they were doing. But they set climatology off on the long and profitable wild-goose chase that – if we are in substance correct – is now at an end.
There’s no justification for assuming that the feedback analysis applies only to the ΔT. Given time constants, etc., one might be able to make that argument for the Transient Climate Sensitivity but you are explicitly talking about the Equilibrium Climate Sensitivity.
I think you have hoisted Hansen with his own petard.
The political based UNFCCC has been falsified by reality for many years. I don’t think they easily will accept facts after so much has been invested in this idea? They will take on their postmodern hats and simply state that nothing is truth?
What Hansen did not include in his ‘water vapor feedback’ was that as the humidity increases so does the enthalpy of the atmosphere. This means that the _temperature_ of the atmosphere will not increase in direct ratio with the energy content (in kilojoules per kilogram) as its specific heat (the enthalpy) is a variable.
If the intent is to measure the energy content of the atmosphere then the correct metric should be used. Temperature is not proportional to the energy content of the atmosphere, it is an intensive variable and should not ever be ‘averaged’. Energy content which is what concerns everyone should be measured in kilojoules per kilogram. A daily average atmospheric kilojoules per kilogram could also be calculated.
The entire house of cards seems to be balanced on incorrect assumptions. Its proponents then proceed to take maximum and minimum temperature observations and ‘average’ them as if that gives some 24 hour average ‘temperature’ but is in fact completely meaningless. Both in terms of an average quantity and of what that quantity represents.
To give these base assumptions the courtesy of carrying out complex mathematics with them raises doubt as to whether anyone is aware of the incorrect assumptions on which they are based.
Where are the metrologists to keep these meteorologists in line?
In response to Ian W, for the sake of argument I have accepted the official position that, in the climate, temperature feedbacks are denominated in Watts per square meter per Kelvin of the temperature that induced them. I have modified that official position only to the extent of demonstrating and verifying that it is not only a change in temperature that induces a feedback but also a pre-existing temperature. In the climate, that is emission temperature.
Another way is to calculate the total energy in the atmosphere and calculate extra energy absorbed by adding CO2.
95% of this analysis is from the http://www.calqlata.com website
while the 5% at the end is mine.
The mass of each gas in the earth’s atmosphere was established from their pressures and by multiplying the specific heat capacity by its mass we can determine the heat energy stored in each gas.
Whilst the calculation is valid for a particular temperature (273K), and the specific heat capacity of most gases rises with temperature, the relative contribution from each gas in the earth’s atmosphere will remain largely unchanged.
The following table lists the results from these calculations:
Gas cp Mass Stored Energy %age of Air
J/kg/K kg J/K
N? 983 4.13091006E+18 4.060684588E+21 79.5209485%
O? 919 1.10774396E+18 1.018016698E+21 19.9359619%
Ar 531 4.91366416E+16 2.609155669E+19 0.5109546%
CO? 844 1.58453127E+15 1.337344390E+18 0.0261894%
Ne 1030 9.50566787E+13 9.790837905E+16 0.0019174%
He 5240 2.74608183E+13 1.438946878E+17 0.0028179%
CH? 2200 1.05618532E+13 2.323607701E+16 0.0004550%
H 14300 2.53484477E+12 3.624828014E+16 0.0007099%
N?O 880 2.63837434E+12 2.321769416E+15 0.0000455%
(H?O) (1859) (1.05618532E+17)(1.963448508E+20)
Totals 5.28951345E+18 + H?O 5.106433796E+21 + H?O 100% + H?O
The stored energy values in the above table assume that all the atmospheric gases are at 273K, which is not correct. Temperature drops and rises with altitude (see Fig 2) and the specific heat capacity of all gases rise and fall with temperature, not necessarily at the same rate but very similarly, except where certain gases fade out at various altitudes, the total percentage contribution of stored heat is virtually identical no matter how you perform this calculation.
The temperature of the earth’s atmosphere is directly proportional to the heat energy retained in its gases. Therefore, a change in the mass of any gas in the earth’s atmosphere will have a consequential effect on the earth’s surface temperature.
The sum of all the ‘Stored Energy’ values in the above table (5.106E+21J/K) represents the energy in the atmosphere that would be required to raise the temperature of all the gas molecules to 273.15K.
Therefore, every single degree (1K) of this temperature must be generated by 1.8695E+19J of heat energy. In other words, to raise the temperature of the atmosphere by 1K (to 274.15K) you would need to increase the total Stored Energy by 1.8695E+19J. ##########################################################################################################################################################################################################################################################################################################
The above value is the most important point in this whole thesis. It will be referred to inl argument at the end.
To conclude;
because nitrogen is responsible for 79.52% of the atmosphere’s stored energy, a 1% change in its mass will significantly affect surface temperature
On the other hand;
a significant increase (e.g. >1000%) in the mass of gases such as neon, carbon dioxide, helium, hydrogen that together constitute less than 0.039% of the atmosphere’s stored energy will have very little effect on the earth’s surface temperature.
However, if we apply the laws of thermodynamics to the above argument these effects are not quite so straight forward, for example; …
CO?
Along with other carbon gases, CO? is today charged with being the principal cause of Global Warming (see Global Warming below) because it is a “Greenhouse” gas. This claim is made because of its low specific heat capacity; i.e. it requires less energy input to raise its temperature by 1K than the more abundant atmospheric gases (except argon). However, its contribution to the earth’s atmospheric temperature can only be considered in conjunction with its relative mass.
Dont forget that even though all the above calculations were for a starting temperature at 273K, the linear proportionality of heated gases dictates that the calculations are good for any temperatures that you would encounter in the troposhere.
If you double the CO2 and assume that every CO2 molecule is then maxed out with its maximum IR that it can absorb an additional
1.337344390E+18 of heat that is now trapped in the atmosphere by the additional CO2. However as in the above where it is ###########
To raise the temperature of the atmosphere by 1K no matter what temperature you are at you would need an additional 1.8695E+19 Joules/kg
The above analysis assumed that the atmosphere was warmed from 273K to 288K( average earth temperature) because of greenhouse gases. The generally accepted view is that without greenhouse gases susch as H2O and CO2, the earth would be 255K or -18K below freezing. Therefore the above analysis of the amount of energy needed to maintain the earth equilibrium temperature at 288K has to be multiplied by a factor of 2.2 ((18+15)/15 ).
Taking the ratio of the above 2 numbers (1.337344390E+18J / 1.8695E+19J and deleting the extra significant digits in the numerator so as to match the 4 significant digits in the denominator you end up with an initial specific heat ratio for CO2 doubling of ~ 0.07. However you have to apply the 2.2 factor above so that you end up with 0.154 as the final specific heat ratio for CO2 doubling. This means that a doubling of CO2 only raises the temperature 0.154K which is .07 * 2 Therefore 1 /0.154 = ~ 6.5
You would need 6.5 times as much CO2 to raise the temperature 1K. And that assumes that each increase has a linear effect when most climate scientists say that the effect is diminished logarithmically. So the increases in temperature are actually much less as the CO2 rises. Now the CAGW scientists will argue that the water vapour forcing by the increase in CO2 starts at any increase in temperature no matter how small. Indeed according to the Clausius-Clapeyron relation (Wentz 2007) they show a 7% increase in H20 vapour for an increase in temperature of 1K. Therefore the increased energy from this increase in H2O vapour is = .07 * 1.963448508E+20 = 1.37441E19 J If it takes 1.8695E+19 J (as in the above *******) extra to heat the atmosphere 1K higher then you get an increase of 1.37441E19/1.8695E+19 = .735 K and applying the 2.2 doubling factor you get 1.47K increase because of the feedback increase in H2O . So a complete doubling of CO2 which hasn’t happened yet and is only based on the present level anyway plus the extra H2O forcing would give you 0.154K + 1.47K = 1.62K increase. Of course this doubling of the CO2 doesnt happen all at once and actually will take 126 years at the present rate of increase in the earth’s atmosphere based on a .0055 rate of increase of the past 50 years and a potential CO2 doubling of 408ppm to 816ppm by volume. Indeed
this 1.62K projected increase for the next 126 years is approximately double the O.85K that the IPCC has said has occurred in the last 132 years from 1880 to 2012. Dont forget that in 1880 the CO2 level was about 280ppm and the level in 2012 was 393ppm which was an increase of only 113ppm which was only a 40% increase from the level in 1880. So we have never had a doubling yet and that doubling of todays figures wont happen for another 126 years as per the above. So even though the resultant water vapour forcing might initiate an instantaneous feedback from even a 0.000001K change in the CO2 level increase; the total feedback temperature change caused by the H2O vapour alone can’t be more than 1.47K . This total increase of temperature of 1.62K (1.47K + 0.15K) assumes that there are no mitigating factors of water vapour forcing. Most skeptics are arguing that there is no net water vapour forcing because 1) net (evaporation – precipitation) is not positive and 2) the increase clouds will cause an increased albedo effect to cancel out the forcing. In any case this analysis dictates that the 1.62K increase over the next 126 years is the worse case scenario. It is also the best case scenario of the IPCC. So this analysis proves that almost all the models are wrong and the only models that have their projection correct is the ones that are projecting ~ 1.5K increase for next 100 years. Surely even the IPCC will agree that that temperature change over that long a period of time is only but a good thing.
Well we know that temperatures are local and the variability is dwarfed by the evaporation and precipitation and accompagnied temperature decreases and increases. However even if we accept the assumption that water vapour forcing commences at any small temperature increase and that there are no mitigating factors from increased albedo from the increased clouds and that net (evaporation – precipitation) is positive; and that the increase is 7% per 1K, then the CAGW scientists have to prove that there has been an increase in the average water vapour(H2O) content of the atmosphere in the past 60 years or so. The Goddard Space Institute a division of NASA had a project team that was measuring the H2O content of the atmosphere from 1989 to 2009. They could not show or prove that the H2O content was any different in the 20 years of measuring so the then director of the Goddard Space Institute Dr. James Hansen shut the project down. Until NASA or anyone else proves that there is more H2O in the atmosphere today than there was in 1950 ( or if there is a definite upward trend in any given time period of not less than 10 years) we have to assume that the Global warming theory of AGW caused by CO2 is simply one big hoax.
“Therefore the above analysis of the amount of energy needed to maintain the earth equilibrium temperature at 288K has to be multiplied by a factor of 2.2 ((18+15)/15 ).”
i should have said that you need the factor of 2.2 because the amount of energy that is in the atmosphere that has caused each 1K increase in the atmosphere has to be divided by 33 instead of 15 as in the original calculations in the http://www.calqlata.co website.
“What is the difference between “apply[ing] Bode’s analysis” and “applying the terminology and procedures of Bode “?”
Hansen set out some linear algebra leading to a conclusion. He said it was the way Bode did it. But the algebra stands on its own. A quote I was responding to was
” I’m just pointing out the requirements involved in trying to apply Bode’s analysis to the climate|
and there are no external requirements in his analysis. He just has to get the maths right. And he did.
Anomalies of temperature are a great way to obfuscate what is actually going on since you get to choose the reference number.
Absolute zero is a tightly fixed reference for all the thermodynamics. It’s the best reference to use for climate, since all the atmospheric effects involce thermodynamics in one way or another
Philohippous is in essence right. Temperature feedback processes, denominated as they are in Watts per square meter per Kelvin of the originating temperature (or of any amplification thereof), do not care how it comes to be that the emission temperature of the Earth is 255.4 K. The feedback response they induce is a response to that temperature. How could they possibly tell which part of that temperature to respond to and which to ignore?
“When Hansen applied Bode’s analysis to the climate he just threw it in and started using it. He didn’t state, let alone justify, the implicit assumptions that he apparently didn’t know he was using.”
EEs here make a big mystery about feedback analysis to which only they, with Bode, have the key. In fact it is just linear algebra, of which their understanding can be patchy. There are no implicit assumptions from Bode in what Hansen did. He said
“We use procedures and terminology of feedback studies in electronics (Bode, 1945) to help analyze the contributions of different feedback processes.”
That is just putting the algebra in a familiar context. But it doesn’t alter what is done, which is just linear algebra which could be done entirely independent of BOde.
The first big assumption is that the climate is sufficiently linear that such analysis provides a close enough approximation of reality.
The other big problem, which is what CM points out, is that there is an offset or reference level to reckon with. Some folks seem to think the system gain is applied only to the change in temperature. CM points out that it applies to the whole signal; ie. there’s a ‘DC’ component to deal with.
As you point out, the actual math is trivial. The correct application of that very simple math is something else.
“CM points out that it applies to the whole signal; ie. there’s a ‘DC’ component to deal with.”
He’s wrong. But what he never explains is what “dealing” with it means. I have asked over and over, with no answer, this simple question. Snowball Earth, no GHGs, at 255 K. The emission temperature is 255K. What is the feedback to that “DC” temperature? Where does it appear?
As to non-linearity, in Bode’s time they had thermionic valves, not op amps. And they are plenty non-linear. As with climate, you do a linearised analysis for small changes.
Nick, night time cooling is nonlinear.
This is not about hour by hour progress at a single site. It is about climate. Specifically, at least annual time averages of a global space average. And that will be non-linear too. As with any device of Bode’s time, it looks at small changes of a non linear system.
If we rigorously apply Bode’s analysis, the forward and feedback transfer functions together create a system transfer function. The output will be the input times the transfer function. link OK, what is the input?
The input is compared with the system reference. The output is the system transfer function times the difference between the input and the system reference. If we want to use Bode, or control system, analysis we are stuck with defining a reference.
Climate scientists want to say that the feedback applies only to changes in temperature. No problem. We can write a transfer function that accomplishes that. Well, actually there is a problem if we do that. What it means is that the feedback will have no effect on the Equilibrium Climate Sensitivity. The Transient Climate Sensitivity will be greater. Remember that Hansen hypothesizes positive feedback.
If we insist on using Bode’s analysis, we are faced with a choice.
1 – Define a reference and justify the choice.
2 – Hypothesize a transfer function that passes only changes and get a rather low Equilibrium Climate Sensitivity.
IMHO, Hansen should have consulted a control systems engineer before he decided to invoke Bode. I would also humbly suggest that CM find the best expert that he can.
That’s not my problem. I’m just pointing out the requirements involved in trying to apply Bode’s analysis to the climate. That was Hansen’s idea. Ask him.
“I’m just pointing out the requirements involved in trying to apply Bode’s analysis to the climate. That was Hansen’s idea.”
No, it wasn’t. What he said was that he was applying the terminology and procedures of Bode. That is just to help make it recognisable. But as you noted, what he is doing is just linear algebra. He doesn’t need any authority from Bode to do that.
“The input is compared with the system reference. The output is the system transfer function times the difference between the input and the system reference.”
Yes. The system refernce is present state. Or 1850 state, if you prefer – it just creates an offset. What MoB claims is that the system reference itself generates a feedback that needs to be taken into account. And as your formulation emphasises, that makes no sense.
Dear God in Heaven.
What do you think was novel about Bode’s work that made it worth publishing? How did it differ from Maxwell’s formulation?
The system reference isn’t arbitrary, which is what you are implying. It will be determined by the physics of the process.
He was postulating an actual physical feedback process. Even if we accept, for purposes of reasoning, that the application of Bode’s analysis was valid, he made a fundamental error in doing so. That’s CM’s point.
I’m sorry if you don’t understand my formulation. I feel like such a failure.
“What do you think was novel about Bode’s work that made it worth publishing? How did it differ from Maxwell’s formulation?”
You tell me. I think it simply explained the relevant linear algebra to EEs.
“he made a fundamental error in doing so”
And, wearily, what was that fundamental error. One notable thing about this discussion of CM is that it all comes back to normalcy. There is no feedback in his calculation of CS. It is just the most primitive version of dividing temperature change by forcing. With now, an allowance for ocean heat flux, which makes it equivalent to Lewis and Curry. There is no room for any “fundamental error” here.
In response to Ian W, for the sake of argument I have accepted the official position that, in the climate, temperature feedbacks are denominated in Watts per square meter per Kelvin of the temperature that induced them. I have modified that official position only to the extent of demonstrating and verifying that it is not only a change in temperature that induces a feedback but also a pre-existing temperature. In the climate, that is emission temperature.
Mr Stokes is right to point out that the feedback loops considered in Bode’s influential textbook (cited as an authority by numerous climatological authors) may be expressed algebraically. Bode himself does this. In a future head posting, I shall present Bode’s version of the zero-dimensional-model equation, demonstrating yet again that, even in the absence of any amplification of the input signal, that signal itself will induce a feedback response in a dynamical system in which feedback processes are present.
Mr Stokes says that my argument does not depend upon feedback at all. That is, of course, trivially true as far as the empirical verification of our result by reference to actual temperature change in the industrial era is concerned.
However, our argument based on the pre-industrial situation is that, since there is a large feedback response to emission temperature, the feedback response to any additional temperature directly forced by the presence of the non-condensing greenhouse gases will be correspondingly diminished.
Using the simplified form of the Bode equation, assume ad argumentum that the entire difference of 32 K between the 287 K temperature as it stood in 1850 and the 255 K emission temperature was attributable solely to the feedback response to emission temperature. Then the math is not in the least difficult. The feedback fraction is simply 1 – 255 / 287 = 0.11. However, suppose 9 K of that 32 K is attributable to directly-forced warming from the non-condensing greenhouse gases. Then, on the simplifying assumption that the feedback fraction is constant, it would be 1 – (255 + 9) / 287 = 0.08.
If the feedback fraction is not constant, how large is the maximum realistic difference between the feedback fraction that induces the response to emission temperature and the feedback fraction that induces the response to the presence of the non-condensing greenhouse gases?
One could assume, as Lacis (2010) do, that there is a tiny feedback response of just 9 K to the 243 K emission temperature they consider would obtain in the absence of greenhouse gases, owing to a higher surface albedo. Then they assume that 75% of the 35 K difference between the 1850 temperature of 287 K and their 252 K estimate of surface temperature after the action of the feedback response to emission temperature will be attributable to feedback – in other words, that the feedback fraction is 0.75/ The CMIP5 models adopt a position not dissimilar to this, with their mid-range feedback fraction 0.67. IPCC’s mid-range feedback fraction is around 0.61.
But is that position at all reasonable? Is it really likely that the the emission temperature will induce a feedback response only 3.6% of itself, while the greenhouse-gas warming will induce a feedback response 300% of itself?
If the temperature 50 years after removal of the non-condensing greenhouse gases would be 9 K higher than the emission temperature, what would be the cause of the 9 K difference, if it were not the feedback response to emission temperature?
“Mr Stokes says that my argument does not depend upon feedback at all. That is, of course, trivially true as far as the empirical verification of our result by reference to actual temperature change in the industrial era is concerned.
However, our argument based on the pre-industrial situation is that, since there is a large feedback response to emission temperature, the feedback response to any additional temperature directly forced by the presence of the non-condensing greenhouse gases will be correspondingly diminished.”
Trivially true means true. The result does not depend on feedback. The calculation process of Lord M just introduces it and then cancels it out. The simple calculation as ratio of temperature change over forcing change isn’t verifying the result. It is the result, just derived it properly and cutting out the rigmarole. The rigmarole includes nutty stuff about feedback to the “emission temperature”, but it all disappears anyway in the result.
AS further demonstration of this, I present the same spreadsheet that sets out the calculation of Charney Sensitivity using Lord M’s method. But I change the value input for the Planck factor from 0.3125 to -1. It could be anything. The intermediate numbers become strange, but the final answer, Charney sensitivity, is the same to ten decimal places. It doesn’t matter what you do to the feedback calc. I have added in column E the spreadsheet formulae used in column D:
Mr Stokes continues to be surprised and excited that our method of verifying in the industrial era our pre-industrially-derived theoretical result does not depend upon the feedback fraction. Of course it doesn’t. It’s an empirical method of verification. As ought to be entirely clear from the head posting, we derive the feedback fraction from the ratio of estimated directly-forced anthropogenic warming to 2011, based on IPCC’s estimate of the net anthropogenic forcing to that year to the observed warming to 2011. The feedback fraction is thus a consequence of that comparison. Once we have obtained that feedback fraction, we can of course compare it with the pre-industrial feedback fraction.
4.6 billion years ago the amount of CO2 in the atmosphere was astronomical. It provided the initial feedback temp to start the evaporation precipitation process going. Once clouds and water vapour got into the atmosphere then CO2 became unimportant except for vegetation. CO2 is only important for plant life. It doesnt regulate the temperature. H2O and clouds do. According to my calcs Monctons total temperature feedback bar chart should be 7.2K clouds; 22.2K H2O vapour; and 3 CO2. As you can see CO2 is a very minor player. As an interesting aside I have calculated the worst case scenario using total energy in the atmosphere of all the gases vs temperature and have arrived at delta 1.62K which is composed of delta 1.47K feedback from H2O and delta 0.15K from CO2.
A snowball earth with no GHG’s has never existed. When Lacis (2010) pulled all the CO2 out of his model, he got a snowball earth in few years. This is the error of treating atmospheric water as feedback only. Water vapor sublimates out of ice. It is a very legitimate GHG on its own. It don’t need no steeenkin’ CO2.
In response to Gymnosperm, Lacis actually found that a dozen years after removing the non-condensing greenhouse gases there would be a slushball or (as it is now called) waterbelt Earth with open sea in the Tropics, and that the climate would stabilize in a new state in which albedo would be 41.8% and global mean surface temperature would be 252 K (or about 9 K above the emission temperature of 243 K). Their mistake was in underestimating the strength of the feedback response to the 243 K emission temperature, and attributing most of that response, incorrectly, to the non-condensing greenhouse gases.
The primary influence of water vapor on climate is that it responds to any temperature or increase in temperature by way of feedback. It would only be a forcing if we were to add it to the atmosphere directly by some industrial process or another. This is done on a very small scale in some industries, but is not currently significant. Water vapor, then, is properly understood as a feedback: and the evidence that it is a far lesser feedback than had been thought is mounting daily.
In the case of it as a positive feedback, absolutely.

On the other hand water vapor is a massive store of energy and regulated how much it cools at night.
It regulates Tmin to near dew point, it does this as air temps near dew point it starts condensing wv, and uses the stored latent heat of evaporation to stabilize cooling. This makes Tmin invariant to changes in the noncondensing GHG’s, as it just varies how much energy it taps to slow cooling.
You can see this in action here
Remember the optical window under clear skies is always bleeding energy to space, and the surface temps never come into equilibrium as you can see using an IR thermometer measuring Tzenith
This is the action of a regulator. In the case on an increase in co2 forcing, as you rightly show there little to no positive to increase water vapor, but it also varies cooling independently to stop surface temps from trying to go below dew point.
I started wondering why it stopped cooling in the middle of the night while doing astrophotography under clear calm skies. I noticed it did this as air temps neared few points, and then I started measuring Tzenith in IR, finding it was still about the same amount colder than the surface when it stopped cooling, as it was at sunset when temps dropped 3° or 4°F/hr. Then realized it tapped the stored energy in WV, as the vertical column cools, that IR radiates down, replacing the energy going out the optical window, but only enough to try and stay about few point. The effectiveness of this varies based on absolute humidity, deserts have little available and cools most of the night, and has a large drop in temps, the tropics however have an excess of WV, and doesn’t cool a lot at the surface. The rest of the planet varies between these two extremes.
But in the end, co2 has little impact on what temp Tmin ends up at, why it can not accumulate energy in the system, WV just regulates it out prior to it slowing the cooling rate.
All very elegant as a self emergent regulator. This reduces CS to as best I can tell from the biannual variation in insolation to below 0.5C/doubling.
Therefore we have 3 different calcs to counter the IPCC estimate to a doubling of CO2.
Monckton ‘s figure of 1.23K
Micro6500’s figure of 0.5K
and mine of 1.62K
All are much lower than the lower case of the IPCC and even at my figure of 1.62K that would not be a cause of runaway global warming for a doubling of CO2 which hasn’t even happened yet by the way.
Monckton’s number was fund by calculating forcing vs sensitivity.
My figure was found by calculating forcing vs total stored energy in the atmosphere
and Micro6500’s figure was found by calculating sensitivity by humidity.
Not sure it ended up in the right place, so reposting answer
To be clear I used delta insolation forcing / measured delta temp change over the biannual seasonal change in forcing.
The exploration of cooling and RH was explaining why co2 has minimal effect.
Alan Tomalty March 31, 2018 at 12:49 pm
At its formation 4.54 Ga, Earth was too hot to hold much air, and, as yet lacking a magnetosphere, the light gases H2 and He of the first atmosphere would soon have been lost. After the core differentiated and our magnetic field spun up, heavier gases could be retained.
The surface cooled. and a second atmosphere formed. It included gases produced by volcanoes, similar to those released today, ie H2O, CO2, SO2, CO, S2, Cl2, N2 and H2, plus NH3 (ammonia) and CH4 (methane). Again, the H2 was too light to be retained by Earth’s gravity, so was lost to space.
Following more crustal cooling, liquid water condensed onto the surface. Plate tectonics got going. Solar UV made ozone from water molecules.
Nick Stokes: Quoting “I’m just pointing out the requirements involved in trying to apply Bode’s analysis to the climate. That was Hansen’s idea.”
No, it wasn’t. What he said was that he was applying the terminology and procedures of Bode.
What is the difference between “apply[ing] Bode’s analysis” and “applying the terminology and procedures of Bode “?
Well done all of you! However, – the bureaucrats have taken over, – we, therefore, have no say at all.
Windmills will go up all over the place for another 20 years or so…. They will represent monumental manifestations of the follies of our time. (“A bureaucrat is a member of a bureaucracy and can compose the administration of any organization of any size, although the term usually connotes someone within an institution of government.” Wikipedia )
In response to Mr Hovland, our argument (if true) is simple enough that the climate campaigners will no longer be able to pretend that climate sensitivity is anywhere near as high as is at present asserted. One should not fear to tell the truth merely because the totalitarians would find the truth uncongenial.
“let me make it plain that my approach is to accept – for the sake of argument only – that everything in official climatology is true except where we have discovered errors.”
If that WERE true, this would be a magnificent achievement. I will leave it at that.
To grumble about a scientific result without making any specific objection is spite, not science, and reflects poorly upon the grouch.
I am not sure that I understand your comment, since my reading of what Mr Moon was saying, is that it would be a magnificent achievement if everything else in climatology were to be true. He does not appear to be making any comment or objection to your scientific result, so why the put down?
I would suggest that it is extremely unlikely that everything else in climatology is true. Some of it maybe true, but to consider that everything else is all true, is highly unlikely. I can’t think of another branch of science where only one mistake has been made.
I have foolishly misread Mr Moon’s comment, and apologize to him.
One piece at a time mon ami, one piece at a time. Brick by brick. Think of the game Jenga. If there is no scientific rebuttal to this work then the whole thing becomes a big mess.
More on ECS and TCRE relevant to this discussion.
https://chaamjamal.wordpress.com/human-caused-global-warming/
CMoB is one of my heroes, but how new is this? Wasn’t Lindzen saying this exact thing a long time ago?
.
That discussion certainly zeros in on what MB was working on: the models do a poor job on “feedback”, “amplification”, “sensitivity”. Thanks for the link.
Mr Stokes (possibly some way below this reply, owing to the oddities of WordPress’ current thread management software) complains that there is nothing new in our result given that Professor Lindzen had already shown equilibriium sensitivity to be only 0.7 K some years back.
Professor Lindzen’s work depends upon a short period of data from datasets subject to large uncertainties, and it is sufficiently complex to be inaccessible to the general observer. Our result, insofar as it is correct, is simple enough to be generally understood.
We are less concerned with what is new than with what is true.
Of course the incomparable Dick Lindzen – the most knowledgeable of all climatologists – came to his own conclusion in 2009, reinforced in 2011, that equilibrium sensitivity is of order 0.7 K. His masterly papers are a model of scientific detective work. But they are sufficiently complex, and depend upon such uncertain datasets, that it is easy for the ruthless climate establishment to disregard him, knowing that most governments and their advisors won’t understand what he found.
lf there be any merit in our own two distinct approaches, it is that they are at root very simple. As has been well demonstrated in these threads during the comments on the two earlier pieces, the idea that emission temperature induces a large feedback, just as the presence of non-condensing greenhouse gases induces a small one, is readily understood. Unless a significant enough error can be found in each of our two methods – one theoretical, one empirical; one pre-industrial, one industrial – then anyone with high-school math and sufficient determination can grasp what we have discovered and form his or her own view.
If we are right, then people will be able to understand that we are right, however many fanatics block their eyes, ears and minds and shriek that we must – somehow – be wrong.
“reinforced in 2011, that equilibrium sensitivity is of order 0.7 K”
And that is why this is such a hopeless muddle. This article says that MoB has revealed, in 2018, that CS is 1.45 K/doubling, so game over. But the incomparable Dick Lindzen revealed in 2011 that the sensitivity was 0.7 K. How many times can the game be over? Does 1.45 revive it? Who’s right?
Nick,
Whether 0.7 or 1.45 degrees C, the game is over. It doesn’t matter what the correct value is, as long as it’s a fraction of IPCC’s baseless claim of 3.3 degrees C. Machts nichts if off by a factor of 4.7 times or 2.3 times.
Nick. lindzen was right about the adaptive cirrus iris (see my and Judith Curry’s back to back posts on that maybe two years ago on Climate Etc, and wrong about Lindzen and Choi 2011. Bad data, bad result. Wrote that up in the climate chapter of The Arts of Truth, which he prepub kindly critiqued. Nobody bats 1000. He was wrong in that last paper. My critique expalined how and why. IMO any effort to prove an ECS below 1.2 is doomed (includind previous Monckton) simply because basic physics and the world say cannot be so. My own vote, is 1.5ish, though perfectly willing to go with Monckton at ‘my’ 1.45 or his 1.55. Too mich uncertainty. No matter which value, CAGW is thereby permanently cancelled.
Rud,
So MIT endowed chair physics professor Lindzen is doomed by basic physics? How could he be so ignorant?
ristvan, I did a search through the scientific literature for the term “CAGW” and found nothing. Can you please tell me how you can “cancel” something that does not exist?
Keith,
Please tell retired NASA GISS director Jim Hansen that there is no such thing as Catastrophic Anthropogenic Global Warming.
Hansen says that man-made CO2 has Earth on the “Venus Express”, such that our oceans are liable to boil. He says that “CEOs of fossil fuel companies should be tried for high crimes against humanity” and calls coal-fired power plants “factories of death”.
These opinions aren’t catastrophic enough for you?
Chimp, please note that a scientist’s personal opinion is not relevant to actual science. Could you please show me where in the scientific literature the term “CAGW” is defined?
For example Chimp, Einstein had the opinion that “God does not play dice with the universe.” He was dead wrong.
Keith,
It’s not just the opinion of one purported scientist. That anthropogenic global warming will be catastrophic unless stopped is the “consensus”, don’t you know.
The pseudoscientific literature is rife with dire warnings about the alleged catastrophic, disastrous consequences of man-made global warming. Dunno how you could possibly have missed them.
How did you miss this widely cited scientific paper on the consensus on AGW, ie that’s it’s dangerous, else why worry about AGW?:
Quantifying the consensus on anthropogenic global warming in the scientific literature
http://iopscience.iop.org/article/10.1088/1748-9326/8/2/024024
According to President Obama, the best scientists assured him that anthropogenic “climate change” due to the global warming effect of more CO2 was real and dangerous. Indeed, he considered it the gravest threat to humanity.
https://www.usnews.com/news/articles/2015/01/20/obama-no-greater-threat-than-climate-change
Well, since we are into the long ad hominem rough. Let me explain. First,mgo read revised Lindzen and Choi 2011.I have. Then, consider their data inputs. The problem lies in an assumed 6 month cloud lag. Now, that parameter was statistically fitted to a short segment of sat cloud data.
Why don’t you all vo read the revised paper and do the rest of,its,logical critique yourselves. Or, buy The Arts of Truth, read the climate chapter, and see what I said that Lindzen himself could not refute.
I’m familiar with Lindzen and Choi, original and as revised.
My question was, why do you consider net negative feedbacks unphysical, when [MIT] professor of atmospheric physics Lindzen apparently doesn’t?
Thanks.
[Jest NIT-picking critiques, right? .mod]
MIT. I’ve caught your typo-itis.
Mod,
It all started with Nick-picking.
Chimp: ” Dunno how you could possibly have missed them.” ….I guess I did, could you please show me where in the scientific literature the term “CAGW” is defined?
Chimp, the link to the ERL article doesn’t mention “catastrophic.” Again, can you please point me to a scientific article that qualifies and/or quantifies the “catastrophic” AGW?
Lastly Chimp, Obama is not a scientist, and posting a link to his opinion does not qualify as a scientific definition of CAGW.
ristvan: “Or, buy The Arts of Truth,” …
..
LMAO, schlepping your carp ? Poor poor Rud, can’t get published in a reputable journal so he “sells” carp!
And the reason you can’t get it published Rud is because all of it doesn’t stand a snowball’s chance in hell of passing peer review.
Keith,
If AGW isn’t potentially catastrophic, why worry about more plant food in the air?
The president said “dangerous”. Alarmists also call it a threat and a looming disaster. Some say it’s already too late to avoid catastrophe.
Are you trying to argue that scientists don’t consider the threat of AGW catastrophic because they don’t define precisely what qualifies as catastrophic? NYC under water, as so many fear, wouldn’t be a catastrophe in your book?
“Catastrophe” is Hansen’s word. Ask him how he defines it. Boiling oceans, I guess.
https://en.wikipedia.org/wiki/Storms_of_My_Grandchildren
Books by scientists on CAGW don’t count in your book, either, as scientific literature? Did you search books as well as papers?
Keith,
Obama claimed to rely upon the scientific consensus, which is that climate change is real, caused by humans and dangerous, according to him.
Also according to IPCC. You don’t consider IPCC reports scientific? On that we agree.
“Risk of catastrophic or abrupt change”:
https://www.ipcc.ch/publications_and_data/ar4/wg3/en/ch2s2-2-4.html
Dunno how you missed that part of the scientific literature, either, since it’s the CACA Bible.
Chimp, let me repeat: ” Obama is not a scientist, ”
…
Do you understand that?
…
Secondly, the IPCC reports on science, it does not conduct scientific inquiry. Can you please point me to a scientific study of the “catastrophic” AGW?
Keith,
IPCC reports alleged consensus science, which includes catastrophe.
You clearly haven’t read the CACA literature. It’s mostly rent seekers and publishing or perishing papers on how CAGW will adversely affect this, that or the other phenomenon. limited only by the imagination of the trough feeder.
Again, I ask, if supposed AGW isn’t a threat, danger or looming disaster, catastrophe or calamity, why are we asked to spend so much global treasure on combating it? If, as its first proponents believed, AGW is entirely a beneficial thing, then what’s the problem?
PS Chimp, “Risk Assessment” is not science, it’s value-oriented opinion. Science does not place any “value” (i.e. good or bad) on outcomes.
Chimp, from a scientist’s point of view, both “CACA” and “CAGW” are not defined within the realm of science.
Keith,
You could not possibly be more wrong.
The whole “climate change” industry is all about warning of dire consequences. Without the assessment that what people are doing will be very, very bad for humans and other living things, supposed scientists would be out of work and grant money. Hence, post-modern science is totally about being Cassandras and predicting various forms of ruin, death, destruction, disaster and catastrophic calamity. You really have not been reading the literature. It’s obvious.
The original AGW proponents, like Arrhenius and Callendar, considered it beneficial. That was their scientific conclusion.
Please, I ask for a third time, why is the world being required to spend trillions and tax itself into the Stone Age if more CO2 in the air is not a threat of some sort or another?
Why did Obama’s science advisers tell him that AGW is so dangerous as to constitute the gravest threat we face?
PS: You speak from a “scientist’s point of view”. Does that mean that you are a scientist?
Are scientists like Ehrlich and Sagan, who purveyed scenarios of environmental and nuclear disaster, not then scientists, because they make value judgement? IMO they aren’t scientists because they don’t practice the scientific method, not because they consider some outcomes worse than others.
Chimp, it doesn’t matter what I am from a scientific point of view. I could be a janitor in a hospital for example, and that doesn’t change the science. Next you say: ” IMO they aren’t scientists” which of course is just your opinion. I do hope you realize that science does not care about your opinion.
These guys aren’t scientists, either, then, despite publishing in the world’s most prestigious scientific journal?
Abstract
“Rapid and deep reductions in greenhouse gas emission are needed to avoid dangerous climate change.”
http://science.sciencemag.org/content/357/6357/1242
Or those at Scripps Institute of Oceanography who published that rapid, man-made global warming poses and “existential threat” to humanity, not scientists, either?
http://www.sandiegouniontribune.com/news/science/sd-me-scripps-climatechange-20170914-story.html
Well, end of a long and probably dead thread, but here goes. The no feedbacks CO2 doubling value is 1.1 (here) to 1.2 (Lindzen 2012). My own best guess is 1.16.
Now, the TCR must be higher than no feedbacks (since GHG do cause primary warming) and the ECS is likely something higher still. There are two logical arguments as to why. 1. If TCR was less than no feedbacks CO2, it would be cooling, not unevenly warming. No feedbacks is generally 1.1-1.2K. Observationally false for actual observed values.
2. ECS by theory cannot be less than TCR from the basic definitions of same, IF GHE exist at all. GHG must warm, not cool.
Keith,
Your opinion of what scientists should or should not do counts for less than nothing. The fact is that you are wrong, as shown not only by what scientists are doing now, but what they have always done.
Chimp says: ” like Arrhenius and Callendar, considered it beneficial. That was their scientific conclusion.”
..
Chimp, when you post that, you’ve shown the whole world you do not know what science is. “Beneficial” is a value judgement, which lies in the domain of philosophy, not in science. Science cannot deem ANYTHING “beneficial.”
Chimp, “Policy Forum” from your link is where opinion is published, not where scientific research is published. Second link from the Chicago Tribune is not a scientific publication.
…
Can you please post a link where either “CAGW” or “CACA” is rigorously defined?
Chimp posts: ” The fact is that you are wrong,”
…
How can I be “wrong” when I ask you for a precise definition of the terms “CACA” and “CAGW” and you are unable to provide me with them?
Keith,
Scientists can and throughout history have done precisely that. You clearly aren’t qualified to comment upon what science is or does. In short, it is practicing the scientific method. Scientists often chose what to investigate based upon their perception as to its value to humanity or to them.
Individual scientists have always made value judgements. Hence, Arrhenius and Callendar concluded, based upon their scientific investigations, that AGW was a good thing.
And hence, the IPCC found AGW potentially “catastrophic”, and scientists told the president that it was dangerous. Other scientists call it disastrous, and existential threat and calamitous.
They are scientists. You, plainly, are not. You’re just chirping from the peanut gallery as to what you imagine or someone told you that science is or isn’t.
I gave you operational definition after definition of catastrophic AGW.
Every paper that highlights a new alleged negative consequence of AGW further the definition.
How obtuse can you get?
Similarly, Hansen and IPCC contributors who use the term “catastrophic” provide specific instances of what they mean by it. Why is that so hard for you to grasp?
Next you’ll be asking for a scientific definition of gravity. Good luck with that!
Chimp says: “I gave you operational definition after definition of catastrophic AGW.”
….
I asked you for a definition from the scientific literature. Your definition doesn’t count. Show me the definition of CAGW that scientists are using.
…”c
Scientific papers do not make value judgements. They cannot ascribe a result as either “beneficial” or “detrimental”
For example Chimp, science can describe the capture of a neutron by a U235 nucleus and the resulting splitting of said nucleus and energy release. Science does not say if said process is “beneficial” or “detrimental.” It depends. If the fission is in a power reactor that generates electricity, it could be deemed “beneficial.” However, if that fissioning nucleus is within a military explosive device on the battlefield, it might be deemed “detrimental”
Keith,
You are simply, completely, totally and utterly wrong. Allegedly scientific paper after paper for decades now has gone on about how really bad, awful and dreadful is AGW. The “climate change” literature is sadly lacking in any real science. It’s mostly dreck along the lines of how bad AGW will be for this, that or the other thing.
Honestly, please do a real literature search, instead of just pretending to have done one. Most of the so-called literature is just “scientists” upping their publication count by ginning up a hypothetical new disaster, based upon GCM projections of future GW.
Much of science operates without precise definitions. Tell me how to define a microbial species, for instance. Or, as I mentioned, gravitation.
Thanks.
Keith,
Post-modern “climate science” doesn’t follow the rules of science. It’s all about providing policy makers and media with new horror stories. Your naive view of science is not only outdated, but it never was really like that to begin with.
The atomic scientists were very concerned about whether splitting nuclei was a good thing or not, but pursued the project because they felt that N@zi Germany was a greater evil than nuclear weapons or power ever could be.
Pasteur went into medical research in order to improve human health. Dr. Snow considered the spread of cholera to be bad, so sought to understand it.
Chimp asks: ” Why is that so hard for you to grasp?”
..
I understand your problem. You are unable to separate “opinion” from science.
..
Where in the scientific literature ( NOT OPINION ) is “CACA” and “CAGW” defined?
In the hearts and minds of every “scientist” who attended every CAGW-CACA-IPCC conference and panel meeting at every one of their worldwide global warming sites. It is intrinsic in their propaganda and n every press release. In every picture of a polar bear, penguin and seal/walrus/cave bear habitat that is “threatened by global warming”. In every prediction of the Hudson River flooding New York, of every political warning of the Norfolk Harbor flooding, of every hurricane warning and every falling hillslide and every overflowing dam in California blamed on rains/drought/lack of snowfall/too much snowpack.
There may be no “CAGW” in the “literature” but I’ve found hundreds of thousands of “polar ice cap albedo solar radiation feedback ” “death spirals” that have NEVER been challenged as “exaggerated” by ANY CAGW-funded self-called “scientist”. Instead each paper repeats the meme. And then add “… more funding is needed …”
PS: For Pasteur, microbial roles in industrial and commercial processes were also important, not just health.
ROTFLMFAO: “Much of science operates without precise definitions.”
…
Chimp….you make me laugh.
Chimp says: “Pasteur went into medical research in order to improve human health. Dr. Snow considered the spread of cholera to be bad, so sought to understand it.”
…
Good!
…
I’m glad both of them were highly motivated individuals.
…
What is your point?
Chimp, the motivation of an individual has no bearing on science. Science doesn’t care if the person that discovered a fact was in it for the money or in it for the prestige. Some people discovered significant science with no motivation at all.
Chimp says: “Post-modern “climate science” doesn’t follow the rules of science”
…
Obviously you are not actually doing climate science, because if you were, you’d not make a fool of yourself by making such an absurd assertion.
Keith,
If you imagine that science requires precise definitions for the terms it uses, you have never, ever practiced science. By the very nature of science, definitions always change. You obviously have never studied the history of philosophy of science, let alone engaged in it.
Again, please provide me the agreed upon, precise definition for such important scientific concepts as “species”, “universal gravitation” and “evolution”. Thanks! The recent discussions here over the concept of “feedback” would be instructive for you to read.
No one needs to define “catastrophic” for CACA spewers. They want “climate change” to pose vague but grave threats.
I can’t believe that you have ever actually reviewed the literature. Had you done so, you’d have seen the most preposterous litany of alleged looming threats to every imaginable value. The site often provides instances of the most outrageous such attempts to keep up the scare through “scientific papers”.
Your naivete knows no bounds.
Chimp if you truly believe that post-modern “climate science” doesn’t follow the rules of science, then why do Lindzen, Curry, Monckton, Christy and Spencer all follow the rules?
Chimp: “If you imagine that science requires precise definitions for the terms it uses, you have never, ever practiced science.”
..
LOL!!
..
..
F=ma
Chimp: “No one needs to define “catastrophic” for CACA spewers”
..
I take it that you are unable to provide a definition then.
..
Figures.
Kieth Sketchly:I guess I did, could you please show me where in the scientific literature the term “CAGW” is defined?
I think you have made your point: There is no scientific basis to the claims that CO2-induced warming will be catastrophic. Claims by famous alarmists like James Hansen go beyond what is scientifically supportable. Could you point that out to organizations such as AAAS who are advocating urgent action to forestall the catastrophic warming that is not supported by science? Or to people who claim that the Trump Administration does not advocate urgent action for a “problem” that the science does not indicate the existence of?
Meanwhile, CAGW, scientific or merely political or rhetorical, has suffered a blow.
“ristvan, I did a search through the scientific literature for the term “CAGW” and found nothing.”
Keith, maybe you don’t know how to use search engines? The term can be found in the following scholarly publications:
Carlin 2011 – http://dx.doi.org/10.3390/ijerph8040985
Lindzen 2012 – http://www.euresisjournal.org/public/article/pdf/EJv2id9_SM2008_Lindzen.pdf
Van Kooten 2012 – http://dx.doi.org/10.1007/978-94-007-4988-7_3
Nemeth 2014 – http://dx.doi.org/10.1007/978-94-007-7353-0_14
Rose 2014 http://www.searchanddiscovery.com/abstracts/html/2014/90196gcags/abstracts/83.html
Parker 2016 – http://dx.doi.org/10.1515/nleng-2015-0031
Poptech, link #1 is economics.
.
Link #2: “. . “This paper will deal with the origin of the cultural changes and with specific examples of the operation and interaction of these factors..”
.
LInk #3: No mention of ‘catastrophic’
.
Link #4: “Let me sketch out here my vision of the cloistered cornucopia of AD 2100:” Speculation/opinion
.
Link #5: Author uses term in abstract, but does not define it.
,
Link #6: Nice try, don’t see the definition.
.
I see your problem Mr. Poptech, you can search for a term, and get hits, but you still haven’t provided a link to a paper that DEFINES the term. The internet is hurting you, not helping.
Keith
I agree completely
There is no such thing as CAGW!
Hence there is no issue that simple migagation won’t resolve. See between the 2 of us we just solved the whole thing, good work buddy!
ristvan March 30, 2018 at 8:19 pm
Thanks for your reply.
Even with net negative feedback, there is still warming at, say, 0.7 rather than 1.2 degrees C. However, under some conditions, added CO2 does indeed appear to cool. Javier has linked to a recent study finding cooling in Antarctica as a result of higher CO2. Others have argued that above about 30 degrees C in the moist tropics, more CO2 also causes cooling.
Relying on “theory” for such questionable concepts as “climate sensitivity” isn’t IMO warranted.
IMO it makes sense that a self-regulating water planet would feature more negative than positive feedbacks. In the case of water vapor, it’s obvious what some of them are, and that they are ignored or downplayed in the GIGO GCMs of “consensus climate science”.
Keith Sketchley March 30, 2018 at 9:11 pm
Of course I can provide a definition, but you asked for an accepted scientific definition. It’s whatever CACA spewers want it to be. As with all else, they fudge it.
The most harped upon prospective catastrophes are sea level rise and loss of sea and land ice. The former would be manageable and the latter is a good thing. But in fact, MSL is rising no faster now than since the end of the LIA, and Arctic sea ice has been growing since 2012.
Time to stop responding to Kieth Sketchley – he’s clearly nothing more than a troll. Chimp, you keep taking his troll bait…
My calc is 1.62K
Nick Stokes: And that is why this is such a hopeless muddle. This article says that MoB has revealed, in 2018, that CS is 1.45 K/doubling, so game over. But the incomparable Dick Lindzen revealed in 2011 that the sensitivity was 0.7 K. How many times can the game be over? Does 1.45 revive it? Who’s right?
The short answer is that “scientists do not know” the climate sensitivity. Each calculation depends on so-far not thoroughly tested assumptions. CMoB here takes a set of “IPCC endorsed” propositions and shows that, carefully used, they produce a lower estimate of the sensitivity than the “IPCC endorsed” estimate of sensitivity. The contradiction is too important to be superciliously rejected; if the sensitivity is as high as the “IPCC endorsed” value, some other of the “IPCC endorsed” propositions must be in error. Lindzen started with different propositions as assumptions.
After reading your comments a few times, I confess that I have missed what might be called the “gist”, some coherent central criticism. Are you claiming/asserting that the “IPCC endorsed” derivations are correct?
Clearly “IPCC endorsed” is my own shorthand for a long set of references to the particular propositions and their places in the reports. CMoB provides a lot of those. Is he misquoting?
“Are you claiming/asserting that the “IPCC endorsed” derivations are correct?”
I am claiming that there is nothing here that says “game over”. The calculations here are mostly primitive – where they do, at a late stage, approach legitimacy, they simply duplicate those of Lewis and Curry. And they have no relation to any “grave error” by climatologists. My summary is here.
As to what the IPCC endorses, the AR5 SPM D2 said
“The equilibrium climate sensitivity quantifies the response of the climate system to constant radiative forcing on multicentury time scales. It is defined as the change in global mean surface temperature at equilibrium that is caused by a doubling of the atmospheric CO2 concentration. Equilibrium climate sensitivity is likely in the range 1.5°C to 4.5°C (high confidence), extremely unlikely less than 1°C (high confidence), and very unlikely greater than 6°C (medium confidence). The lower temperature limit of the assessed likely range is thus less than the 2°C in the AR4, but the upper limit is the same.”
They acknowledge considerable uncertainty. In fact there is no “game over” here, as Lord M’s estimates are mostly within the range. And even if they could be taken seriously, they would be just one more item of evidence. They would not obliterate the other studies on various different bases. No-one else puts forward a new estimate and says – “here it is, game over”.
Nick Stokes: The calculations here are mostly primitive
Is it not true that the IPCC has used the same model?
“Is it not true that the IPCC has used the same model?”
Well, the IPCC does not use any model. But they cite papers that have used various models. They summarise this in Box 12.2 of the AR5:
“ECS and TCR can be estimated from various lines of evidence. The estimates can be based on the values of ECS and TCR diagnosed from climate models (Section 9.7.1; Table 9.5), or they can be constrained by analysis of feedbacks in climate models (see Section 9.7.2), patterns of mean climate and variability in models compared to observations (Section 9.7.3.3), temperature fluctuations as reconstructed from paleoclimate archives (Sections 5.3.1 and 5.3.3.2; Box 5.1), observed and modelled short-term perturbations of the energy balance like those caused by volcanic eruptions (Section 10.8), and the observed surface and ocean temperature trends since pre-industrial (see Sections 10.8.1 and 10.8.2; Figure 10.20). For many applications, the limitations of the forcing-feedback analysis framework and the dependence of feedbacks on time scales and the climate state (see Section 12.5.3) must be kept in mind. Some studies estimate the TCR as the ratio of global mean temperature change to RF (Section 10.8.2.2) (Gregory and Forster, 2008; Padilla et al., 2011; Schwartz, 2012). Those estimates are scaled by the RF of 2 × CO2 (3.7 W m–2; Myhre et al., 1998) to be comparable to TCR in the following discussion.”
I don’t think they have ever cited a paper that just divided warming to date by current forcing to get ECS. It has long been recognised that such a ratio will not reflect further warming that the raised flux will create in the future (so not equilibrium) but also will depend on the time history of forcing. Hence TCR is defined, but with a specific history (70 years of exponentially rising forcing, leading to a doubling after 70 years). The above passage does allude to trying to estimate TCR by ratio of ΔT to ΔF. Forster and Gregory, though, used ERBE satellite data to get TOA balance, and said of the process:
“The uncertainty range is due to a combination of the short time period for the analysis as well as uncertainties in the surface temperature time series and radiative forcing time series, mostly the former. Radiative forcings may not all be fully accounted for; however, an argument is presented that the estimate of climate sensitivity is still likely to be representative of longer-term climate change. “
The uncertainty was high; the data is noisy.
The idea of dividing by forcing corrected by heat uptake originated with Gregory et al, 2004. They used it for GCM studies, where at least the relevant fluxes could be estimated accurately. The idea of applying this to measured data is obvious, but people no doubt held off because of the uncertainty of the quantities. Lewis and Curry (not from IPCC casting) plunged in, but at least did an uncertainty analysis, which properly indicated that this was no panacea. The noisiness of the data was reflected in wide uncertainties.
But the point of “primitiveness” is that the methods have been available, obvious, and mostly eschewed, for a long time. You can’t suddenly advance such a calculation in 2018 and say “game over”.
Nick Stokes: But the point of “primitiveness” is that the methods have been available, obvious, and mostly eschewed, for a long time. You can’t suddenly advance such a calculation in 2018 and say “game over”.
So the method was “eschewed” while still being cited? “No one ever …” comes up short of saying that how CMoB used the method was wrong, only that his approach is novel.
I do agree that his claim of “game over” is optimistic.
“So the method was “eschewed” while still being cited?”
No. As I said, I don’t believe the IPCC has ever cited a paper which just used the primitive method of dividing current warming by current forcing. To get anything published, let alone cited, you have to do something to overcome the obvious flaws in that. Allowing for ocean heat, as Nic Lewis did, is one such. But then you have to do a proper uncertainty analysis, as he did. That is where the improvement is needed. And it still wasn’t good.
Keith, so does the term “CAGW” exist in the scholarly literature? If you would like a further education in how to use search engines in the future let me know.
Poptech, I’d be glad to let you “educate” me on searching, but only after I give you a lesson in reading comprehension. For example, if you read through this thread you’ll note my continual reference to “SCIENTIFIC LITERATURE.” I see that you misunderstood these two quite commonly used words and substituted your “SCHOLARLY LITERATURE” in it’s place.
>>
Keith Sketchley
March 30, 2018 at 7:33 pm
. . . can you please point me to a scientific article that qualifies and/or quantifies the “catastrophic” AGW?
<<
I don’t usually feed trolls. This troll is completely off topic (typical for trolls), is discussing a nonsense point (also typical of trolls), and is wasting everyone’s time (the primary purpose of all trolls). Since the troll doesn’t seem to know how to search properly, I’ll try to help him out (“try” is the operative word here). CAGW is shorthand used on this site. If the troll searches for “catastrophic” and “climate change,” he will get a better result. When I search on EBSCO, I get 585 hits. If the troll knows his history, “climate change” replaced “global warming.” Doing a search on EBSCO for “catastrophic” and “global warming” gets about 128 hits.
So when they say “climate change,” they really mean “global warming.” And when they say “global warming” they really mean the “anthropogenic” kind (otherwise, why bother if it’s the “natural” kind).
I hope this helps the troll.
Jim
Jim you are making the same mistake that Poptech makes, your use of the EBSCO database is too broad, and is not focused exclusively on scientific literature. You can use “CAGW” or “Catastrophic anthropomorphic global warming” in quotes in order to get an exact match. (that is because that is what the acronym represents. I suggest you read the post above from matthewrmarler because it hits the nail on the head. Science does not deal with “catastrophic” because that is a non-objective value laced term, beyond the realm of actual science.
PS Jim, when you say: ” CAGW is shorthand used on this site.” this fact indicates that the acronym is not in widespread use within the scientific community. If it were commonly used in the scientific literature, it’s use would range much farther beyond just this site.
Keith, you used a term that is not defined in a dictionary, “scientific literature” but rather by Wikipedia which is not the most reliable source but it does state: “Scientific literature comprises scholarly publications that report original empirical and theoretical work in the natural and social sciences,”
https://en.wikipedia.org/wiki/Scientific_literature
Thus all the publications I presented count and it can irrefutably be established that the term is present in the scientific literature.
>>
Science does not deal with “catastrophic” because that is a non-objective value laced term, beyond the realm of actual science.
<<
And that’s more nonsense from our troll. Those 585 hits were of scientific papers published in scientific journals. Nice try.
Jim
Poptech says: ” Wikipedia which is not the most reliable source”
..
Thank you, you are correct. Your choice on an unreliable source indicates to me that you have no problem compromising your ethics when it suits your purposes. As such, your citations provided above are suspect. Seriously, although “economics” is a social science your picking that as a source referencing “catastrophic” warming is hilarious.
jstalewski,
You’re right.
Happily, I didn’t need to keep feeding the shameless troll. His time-wasting efforts have been thoroughly shown idiotic by other commenters in this thread, and here:
HAL 9000 GORE April 2, 2018 at 3:37 pm
http://en.cnki.com.cn/Article_en/CJFDTotal-DQXK199204010.htm
https://www.nature.com/articles/35098000
http://www.pnas.org/content/114/39/10315
https://www.epa.gov/sites/production/files/2014-12/documents/incorporating_catastrophic_climate-change_into_policy_analysis.pdf
Keith, each of those scholarly articles mentions “CAGW.” So it appears that the term is used in the scientific literature. As for a definition, you appear confused, scholarly articles are not dictionaries.
Carlin 2011 – http://dx.doi.org/10.3390/ijerph8040985
“The risk of catastrophic anthropogenic global warming appears to be so low that it is not currently worth doing anything to try to control it, including geoengineering.”
“There is little doubt that proposals to mitigate the threat of climate change, sometimes referred to as catastrophic anthropogenic climate change (CAGW) or global warming, has presented environmental economics with its most important challenge to date in terms of providing useful advice on what if anything should be done concerning what is perhaps the major environmental public policy issue of the last decade or more.”
“Hypothesis 2: Increases in atmospheric CO2 levels interact with the major greenhouse gas, water vapor, to create a large positive feedback capable of creating catastrophic global warming.”
“List of Acronyms:
CAGW – Catastrophic AnthropogenicGlobal Warming”
Lindzen 2012 – http://www.euresisjournal.org/public/article/pdf/EJv2id9_SM2008_Lindzen.pdf
“This time, real scientists who were also environmental activists, were recruited to organize this web site and ‘discredit’ any science or scientist that questioned catastrophic anthropogenic global warming.”
“The scientists who participate in such exercises quite naturally are supportive of the catastrophic global warming hypothesis despite their ignorance of the underlying science.”
Van Kooten 2012 – http://dx.doi.org/10.1007/978-94-007-4988-7_3
“A more recent survey of the same database but covering more recent years showed that scientific opinion was shifting away from belief in catastrophic anthropogenic warming, and not toward it (Schulte, 2008), while a survey of climate scientists showed that the matter remains very much debated among them (Bray and von Storch, 2007).”
Nemeth 2014 – http://dx.doi.org/10.1007/978-94-007-7353-0_14
“This was a significant tipping point for the fortunes of humankind in my estimation: without A1 Gore in the White House, the long-lumoied possibility of catastrophic anthropogenic global warming had finally teetered over into the realm of the real.”
“In every less-than-catastrophic anthropogemc global warming scenario generated by current climate models, chemical energy production on Earth (e g the food cycle) seems sustainable for humankind, although not at current population levels.
Rose 2014 http://www.searchanddiscovery.com/abstracts/html/2014/90196gcags/abstracts/83.html
“The latter three disciplines argue against Catastrophic Anthropogenic Global Warming (CAGW).”
“Recent and continuing unsavory revelations (“Climate Gates I and II”) have also cast doubt among the general public on the objectivity of the science underpinning CAGW, motivated by ideology and the search for research funding. Indeed, the greatest threat posed by the whole controversial CAGW campaign of the past 25 years may be the loss of public confidence in the integrity of Western science.”
Parker 2016 – http://dx.doi.org/10.1515/nleng-2015-0031
“The computational generalized GIA adjustment is unfortunately an argument often used to reverse the results of ‘non-cooperative’ results towards compliance with the Catastrophic Anthropogenic Global Warming (CAGW) narrative.”
Keith, please provide the definition of “scientific literature” from a dictionary.
Poptech asks for a “dictionary” definition of scientific literature. Poptech must not realize that “scientific literature” is two words, not one. The reason you will not find a definition for “scientific literature” in a dictionary is the same reason you will not find a definition in a dictionary for “black cat.” The fact that you ask for a definition from a dictionary is an indication you are grasping at straws.
So Keith what is you problem then with a four letter phrase? Would you like links to dictionaries online?
Now Mr. Poptech, instead of requesting a “dictionary” definition of the term, you’d get much better results if you asked for an encyclopedia definition: http://encyclopedia2.thefreedictionary.com/Scientific+literature
Keith if you need help with the definitions of words I would recommend Mosher, he has an English degree.
No Poptech, you don’t have to go through the trouble of linking to a dictionary for the four letter acronym. The problem with the four letter acronym (CAGW) is that it is not a scientific term. Science studies the AGW phenomena, but the “C” is not a part of the science. In fact the “C” is actually a strawman, built by the cohort of folks that reject mainstream science, that they use in a futile attempt to discredit said mainstream science. To put it even simpler, once you begin discussing the “C” prefix to AGW, you’ve left the realm of science, and entered the realm of opinion.
Michael Mann and James Hansen might have different definitions of “catastrophic”, but they both use the same word:
https://trofire.com/2017/10/03/connecting-dots-climate-change-catastrophic-destruction/
I’m still waiting for Keith’s precise scientific definitions for such concepts as “gravitation”, “spacetime”, “energy”, “matter”, “species”, “evolution” and “life”. Thanks!
https://encyclopedia2.thefreedictionary.com/Scientific+Literature
Keith you do realize your link is citing Pravda and USSR sources? Do you actually read anything before you post it?
Keith, is the term “Catastrophic Anthropogenic Global Warming” (CAGW) used in the scholarly literature?
Keith,
However, if you want to argue that Mann and Hansen aren’t scientists because they use the phrase, “catastrophic climate change”, then I’ll agree.
Oxford philosopher’s matrix for catastrophic and existential risk:
https://en.wikipedia.org/wiki/Nick_Bostrom
https://en.wikipedia.org/wiki/Global_catastrophic_risk#Global_catastrophic_vs._existential
Poptech, round two.
…
SCIENTIFIC
..
Stop substituting “scholarly”
..
One is the subset of the other. Publication of an opinion can be scholarly, but publication of an opinion is not scientific.
..
Hansen and Mann’s use of the term when expressing their opinion does not detract from their status as scientists.
Chimp, that wonderful table from Oxford’s philosophers is not scientific. It is in fact bestowing a value judgement on categories of events. That is not science, and is a subject field within philosophy called ethics. You see, science cannot determine if something is good or bad, only what is and what isn’t
Keith, why are you dodging the question?
Keith,
Bostrom’s background is scientific. His Institute, which published the matrix I posted, is multidisciplinary, linking philosophy, math, social and natural sciences.
https://www.fhi.ox.ac.uk/about-fhi/
“Oxford philosopher’s matrix for catastrophic and existential risk”
This haggling reminds me of a quote from British PM Disraeli. He seemed to be making a distinction between a disaster and a catastrophe, and was asked to clarify. He said
“Well, if Mr Gladstone were to fall into the Thames, it would be disaster. But if someone were to pull him out, it would be a catastrophe.”
And of course, Einstein was also a philosopher of science, specializing in epistemology, but also of ethics:
Einstein’s Philosophy of Science
https://plato.stanford.edu/entries/einstein-philscience/index.html
Einstein, Ethics and Science
https://link.springer.com/article/10.1007/s10805-005-9002-0
Give it up, Keith.
For you, the game is over.
The game is never over, it goes on and on. What Einstein was is not relevant to this conversation, unless of course Chimp in your world a person is allowed to only wear one hat. Einstein’s greatest contribution was to physics, but that does not preclude him from pursuing other interests. Bostrom’s chart is not science.
…
Poptech, I’ve avoided nothing, and you are confusing “scholarly” with “scientific.”
Keith,
Nope, the game is over. You know it, but can’t admit it.
As shown among other proofs by your inability to answer our questions.
For Einstein, ethics, epistemology and physics were all one, just as truth is one. The path to righteous behavior is the same as the path to understanding the natural world.
As the dying Romantic poet wrote, “(B)eauty is truth, truth beauty,’ – that is all / Ye know on earth, and all ye need to know.”
The game is not over just because you say so. Now, you mention “our” questions, yet you have not asked one. Who is “our?”
..
You are ignorant of the differences between ethics, epistemology and physics. They all deal with different subject matter.
..
Again, science does not deal with “good” and “bad.” If you think it does tell me, is a neutron good, or is a neutron bad? Does science tell you that five electrons are better than two protons?
And of course for Newton, too, it was all one: math, physics, alchemy, biblical chronology, Deist theology, until he gave it all up, and left Cambridge to run the mint and Royal Society in London, where he might smite his enemies.
Keith,
You are profoundly ignorant of science. I wonder if you have ever even met a practicing scientist.
Your imaginary world doesn’t exist in reality.
“You are profoundly ignorant of science”
..
People that live in glass houses….. https://wattsupwiththat.com/2018/03/30/game-over/comment-page-1/#comment-2778872
Same goes for the great British physicists of the 19th century: Faraday, Kelvin and Maxwell.
A tendentious Darwin scholar has claimed, without much support, that the greatest 19th century English naturalist also developed his hypotheses and theory from ethical grounds, being motivated by his anti-slavery beliefs. To put it mildly, I’m not convinced, but the fact is that all the pottery heir Wedgwoods were anti-slavery, whether Christian, like Charles’ cousin-wife Emma, or agnostic, like the Darwin side of the family.
Keith,
Your profound ignorance is yet again on display.
F=Ma is an equation, not a definition. How ignorant can you get?
Now please provide the precise definitions for scientific terms which I have repeatedly asked of you. You won’t because you can’t.
I’ll make it really really easy for you Chimp, I’ll ask you a multiple choice question…….
.
Is a proton good, or is a proton bad?
..
A) it is good
B) it is bad
C) Science cannot answer this question.
Chimp, F=ma is the definition of “force” in physics.
..
Thanks for playing
https://en.wikipedia.org/wiki/Force
Keith,
Can you possibly really be this obtuse? Apparently, yes.
That some scientific discoveries are value-neutral doesn’t mean that all are. Why is this hard for you to grasp?
Why do you suppose that there is such a thing as the Union of Concerned Scientists? Why do you suppose that so many “climate scientists” feel the need to warn that alleged AGW is potentially “catastrophic”, as you’ve been shown over and over again?
Why did Sagan, Ehrlich, Schneider, et al feel the need to warn about “nuclear winter”?
Clearly, you have never studied science, the history of science nor the philosophy of science.
But thanks for making such a fool of yourself. Your betters have had a good laugh, but now you’re just boring.
Buh-bye, pathetic troll.
“doesn’t mean that all are.”
..
You are dead wrong, they all are.
..
Science has no concept of “good” nor does it have a concept of “bad”
Keith,
You are such a blithering scientific ignoramus that you don’t even understand the Second Law. The equation F=ma isn’t a “definition” of “force”, but of momentum.
Please quit embarrassing yourself and quite digging your hole deeper.
Keith, you failed to provide a definition of “scientific literature” from a dictionary to support you usage. Wikipedia clearly supports mine.
The term “catastrophic” implies impacts and thus it is going to be found in the same scholarly literature referenced in Working Group II and III of the IPCC reports.
Everyone can see you are avoiding answering the following questions:
1. Is the term “catastrophic anthropogenic warming” (CAGW) used by scientists in the scholarly literature?
2. Does the IPCC talk about catastrophic climate change?
https://www.ipcc.ch/publications_and_data/ar4/wg3/en/ch2s2-2-4.html
F=ma=d(mv)/dt
…
You lose Chimp
…
The change in momentum per time is equal to mass times acceleration.
..
“force” in physics is defined in units of mass, time and distance
Chimp did you skip class the day they defined acceleration? You know, a=d(v)/dt ????
Keith,
[pruned]
The verbiage definition of force is “any influence that causes or attempts to cause a free body to undergo a change in the acceleration or the shape of the body.” The 2nd Law equation which describes momentum in classical Newtonian physics is F=ma.
This is entirely different from a worded definition of a term such as “catastrophic”. Why is this hard for you to grasp.
Please do as asked and provide the precise, accepted scientific definitions for the terms I’ve repeatedly asked you to define, to wit, gravitation, spacetime, energy, matter, species, evolution and life. Thanks. Hope the fourth time is the charm.
Poptech: RE: dictionary definition of “scientific literature”……please see post above regarding “black cat.” In other words, you are requesting something that does not exist.
..
THIRD (maybe fourth) TIME: “scientific literature” is not the same as “scholarly literature,”
.
The IPCC reports on science, it is not science per se. So, please do a search of SCIENTIFIC literature and post a link to the SCIENTIFIC definition of “catastrophic”
…
Hint: What are the units they use to measure “catastropic?”
Keith Sketchley
Hmmmn. “Loss of power, influence, funding, my future salary, my future speaking and media engagements” = Catastrophic.
See, you are playing a classic switch-and-bait-by-distraction game. The IPCC is NOTHING, has NO influence, power, control, or political strength if it has no “catastrophe” to threaten the world with by its annual/monthly/weekly/daily forecasts of absolute and death and doom by flooding/loss of habitat/death by mosquitoes/malaria/drought/famine/flooding (again)/chocolate/easter eggs/lack of polar bears/penguins/elk/moose/mouse etc, etc, etc.
You are trying to pretend that the climastrologist community of politicians/academia/laboratory/”scientists”/publicists/bueaucrats/demonstrators/anti-human sociopaths are “scientific” and “pristine” in their ivory towers of learning. They are not. They are USING their ivory towers of soapboxes to CREATE hysteria and catastrophe where there iis none, and when there will be none to CREATE their power and their funding and their media images. No catastrophe in their supposed “scientific papers”? Do you pretend to ignore the polar ice “death spiral”, or pretend it (the “catastrophe” you are spending dozens of replies to distract us with) is not there when it is disguised by the more erudite “albedo feedback” leading to “loss of the polar ice pack” … even when loss of Arctic sea ice leads to more cooling?
Keith,
You clearly missed the entire Newtonian mechanics class. The term “force” is not defined by the equation F=ma. “Force” is proportional to acceleration. F is the net force acting on the body, m is the mass of the body, and a is the center-of-mass acceleration.
Please educate yourself at the most elementary level:
https://www.thoughtco.com/force-2698978
Sorry Chimp, “force” is a defined quantity in physics.
..
F=ma
F=m(dv/dt)
…
Take your pick
..
because a=dv/dt, and you must have learned basic algebra
Chimp says: “”Force” is proportional to acceleration. ”
…
Very good Chimp, now…..
…
F/a=m which is the proportionality factor
…
See, even you can understand it.
Keith if you are illiterate and cannot answer these questions please say so.
1. Is the term “catastrophic anthropogenic warming” (CAGW) used by scientists in the scholarly literature?
2. Does the IPCC talk about catastrophic climate change?
Keith, your appear to have trouble using dictionaries as well since “black cat” can be found in them.
http://www.wordnik.com/words/black%20cat
http://www.freedictionary.org/?Query=black%20cat
https://www.vocabulary.com/dictionary/black%20cat
Catastrophic effect of AGW on birds:
http://rsbl.royalsocietypublishing.org/content/6/2/253.short
Poptech continues to use “scholarly literature” instead of “scientific literature.” I’ll ignore him until he asks the proper question.
It’s all, and only theoretical. Cooling is done through convection, what individual human produced molecules – 10, 700 or 70 000 – does in a hurricane is totally irrelevant.
A half open gate does not prevent half of anything escaping.
In response to Mr Larsen, our argument based on the pre-industrial state of the climate is theoretical, for we cannot measure that state. However, our argument based on the industrial era, which we can measure to some extent, is empirical.
And of course our calculations are not incompatible with the non-radiative transports in the atmosphere – notably evaporation and convection up, advection across and precipitation and subsidence down. But there is no need to model them explicitly in our simple method, which uses the zero-dimensional-model equation (1 and 2 above) as it is intended to be used – diagnostically. The narrow purpose of the equation is to indicate how a given feedback fraction will act in the actual climate and, therefore, to diagnose not only what interval of equilibrium temperatures the CMIP3 and CMIP5 models would predict based on their current feedback fraction 0.67 but also what temperature those models would be likelyto predict based on the substantially lesser feedback fractions that we have derived after correcting climatology’s error.
RJ, just wrong, Tropospheric cooling is indeed done partly by convection. BUT, our planet has an atmospheric ‘envelope’ surrounded by space at CMB 2.7K. Now, how the heck does your convective cooling extend to space.? iT DOESN’T. Only radiative outbound LWR can ultimately cool this planet. To space, there is no convection and no conduction. Period.
Now, in partial forgiveness of your conceptual error, Willis Eschenbach has posted many times on how convection can help cool despite the GHE by lifting heat above most of the GHE. And I have posted many times on how his irrefutable observation means the climate models are misparameterized so run inarguably hot.
You say; “Global temperature in 1850 was 287.6 K.”
I say false precision and in need of a very large error bar.
Very clear reasoning and an excellent job of isolating the analysis from the usual distractions. Thank you.
There is no need to be picky with MB on this, as he states, he accepts the IPCC numbers up front, to narrow the discussion.
In reply to the Dawg, first of all many thanks for your kind words. Secondly, the ISCCP dataset finds today’s global mean surface temperature to be 288.4 K, and the HadCRUT4 dataset finds the warming from 1950 to 2011 to be 0.8 K. The difference – 287.6 K – is the approximate value of global mean surface temperature in 1850.
Furthermore, even if one were to vary the value a little bit either way, it would make little difference to the conclusion. All I have done is to work with official mid-range estimates. And, because my method is explicitly stated step by step, the Dawg is free to substitute any alternative value he considers appropriate and recalculate.
Herein lies the problem
None of the data sets are fit for purpose such that we cannot empirically test anything using observational data.
Merely for the sake of argument, let us assume that if we had properly measured temperature and had proper and accurate data on this, such that we would see that the temperature today is no greater than it was in 1940 and in 1880 (there being some variations between 1850 to 2017, but the peaks of 1880 and 1940 were the same, or slightly greater, than the peak of 2016/17), are you really saying that that fact would not impact upon your conclusion?
Are you really saying that if there was no temperature increase during the period when about 97% of all manmade CO2 emissions have occurred, that would not impact upon your conclusions?
I find that difficult to comprehend.
“Are you really saying that if there was no temperature increase during the period when about 97% of all manmade CO2 emissions have occurred, that would not impact upon your conclusions? ”
Our current instrumentation(satellites, buoys), balloons, is certainly better. Thus the near panic over the “pause”.
One agrees with Mr Verney that the datasets are unsatisfactory and uncertain and disagree with one another. However, small variations either side of the temperature as it stood in 1850 are not going to make that much difference to the calculation.
Can anyone who really believes in man made warming please help me out here. My data sets (Mean, Min. and Max) made up from 54 weather stations (27 Nh and 27 Sh, balanced to zero latitude) are showing, over the past 40 years:
0.000K/annum i.e. no warming in the Sh
0.024K/annum warming in Nh,
That gives me an overall result of 0.012K/annum [for the past 40 years], which, in actual fact, does not even compare badly with what Spencer & them are getting.
My dilemma is this: if the warming were due to more CO2, noting that CO2 is rising globally, should we not measure equal rates of warming in the Nh and the Sh?
Just asking.
The position of the continents is a major factor in climate processes, particularly ocean currents. Sorry I can’t offer a more detailed answer; maybe someone will come along with a more thorough explanation. It is a major effect, though, and can be seen in some of the paleoclimate data as a lag.
Kristi
well, true enough, the abundance of continent in the Nh could be another clue to the truth.
In fact, two of my stations’ results made me wonder: In Las Vegas USA I noted a steep rise in minimum T. No, here one has to consider that they turned a desert into a paradise [over the past 40 years].
In Tandil, ARG, I noticed a steep decline in minimum T. Apparently here they cut all the trees down. It left me pondering with the conclusion that the ‘greening’ of the earth that everybody wants, actually does trap heat. I mean everybody wants lawns, trees and crops. We also know that the increase in CO2 also contributes to the greening of earth. I think I could look this up but I remember I did see a report here on WUWT showing that earth has become 30 or 40% greener compared to 40 years ago. Is that then maybe not the reason why the warming in the Nh is more pronounced?
Could the CO2 be something like dung in the air and is it not the resultant greening
– that everybody wants and needs –
the main reason for the warming trend?
You tell me!
Based on linear regression of annual CO2 levels against the monthly CET data since 1950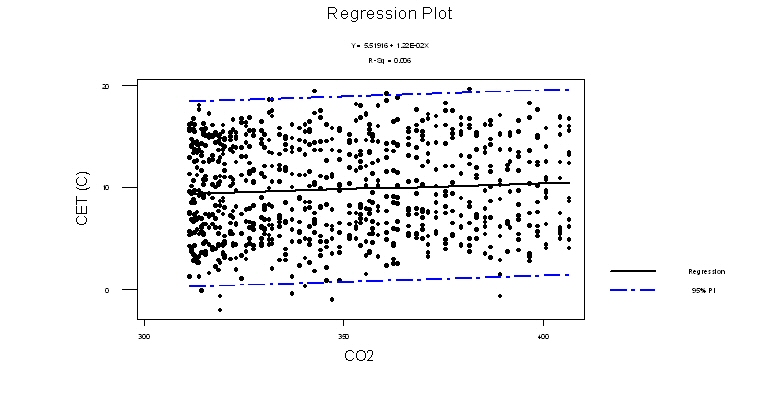
a rise of 0.006K per extra ppm of CO2 in the atmosphere is found, with teleconnections such as Arctic Oscillation (AO), East Atlantic (EA) and the lagged monthly insolation more important variables.
https://mynaturaldiary.wordpress.com/2018/03/03/whither-the-weather-2/
This suggests if the background CO2 level is doubled from 280ppm to 560ppm a background rise of 1.68K would occur.
Actually that makes sense. There is correlation. Namely there are giga tons of bicarbonate in the oceans. What is the first smoke in a kettle when you boil it?
HCO3 – + heat = CO2 (g) + OH-
So there is always correlation. But not necessarily causation. Heat causes more CO2. For sure. But I maintain that it has never been proven that more CO2 is the cause of more heat.
HenryP – Monckton of Brenchley’s excellent post above highlights the IR dipole moment mechanism which is the causal mechanism for CO2 to be a greenhouse gas.


The question remains to what extent it effects us. His analysis suggests doubling the preindustrial concentration will result in heating in the order of 1.5K. The best subsets regression model suggests about 1.7K. These are far beneat the 3.3K IPCC and CMIP5 models.
Incidently the strongest driver for Monthly CET values since 1950 is unsurprisingly last months solar insolation,
followed by the Arctic and North Atlantic Oscillations (teleconnections ‘weather’ influencing jetstream)
and the East Atlantic, East Atlantic/West Russia. Also the Atlantic Multidecadal Oscillation.
With all these factors combined in a model selected by best subsets regression, you can predict the monthly CET
CO2 is the weakest component in this relationship.
mynaturaldiary
you say
Monckton of Brenchley’s excellent post above highlights the IR dipole moment mechanism which is the causal mechanism for CO2 to be a greenhouse gas.
That is exactly where the problem lies.
Looking at the spectrum of CO2 we have absorption of CO2 in the UV [ that is how we can identify it on other planets], at 1-2 um and 4-5 um [ I remember I used to measure the CO2 in nitrogen using the 4600 nm]. These are the bands of the CO2 in the spectrum where the sun emits. Then there is also the absorption at 14-15 um where the earth emits which is causing some entrapment of heat. My question is: where is the test report that shows that the net effect of more CO2 is that of warming rather than cooling? I am afraid that the closed box experiments won’t apply since it does not take the cooling effect of the CO2 into account. You need to give me a report that quantifies both the cooling and warming effect.
HenryP
Regarding the long term carbon cycle and it’s effect on the climate, you couldn’t do better than to watch this.
http://www.dailymotion.com/video/x52qsnd
It’s 49 mins long, but a fabulous watch, linking causation of ice ages across geological time.
The academic papers are there, but paywalled off from the general public.
I appreciate your concern with ‘test tube experiments’ vs the global system. I work with an analogy in the day job – shifting test tube chemistry onto chemical plants. Simple reaction kinetics often can be poor prediction of what happens on a reactor undergoing complex mixing and temperature cycles at industrial rate. Empirical models of the type I employed on the CET can often be more predictive, if you use methods like best subsets. Check
https://mynaturaldiary.wordpress.com/2018/03/03/whither-the-weather-2/
for more details if you are interested.
Sorry Kristi and mndiary
Sleeptime here now.
I will get back to you and we can still speak about another thing:The elephant in our room….
mynaturaldiary,
I’m afraid your statistics are terrible. You are not getting a good enough signal from anything to make any conclusions at all. If you are going to take this sort of approach, you would use a multivariate analysis (such as multiple regression or principle components analysis) that would tease apart the different effects in one test.
But it’s pointless. All these questions have been addressed long ago by scientists who dedicate their lives to such things. Natural variation is a driver of change, but humans are at least as influential.
Henry P:
“It left me pondering with the conclusion that the ‘greening’ of the earth that everybody wants, actually does trap heat. I mean everybody wants lawns, trees and crops. We also know that the increase in CO2 also contributes to the greening of earth. I think I could look this up but I remember I did see a report here on WUWT showing that earth has become 30 or 40% greener compared to 40 years ago. ”
This is a good question to ponder, but turns out it’s quite complicated. I’m not sure what the figures are for greening, or what the 30-40% means – increase in leaf area, I suppose, but it seems quite high. This has a pretty picture of the change:
https://www.nasa.gov/feature/goddard/2016/carbon-dioxide-fertilization-greening-earth
“From a quarter to half of Earth’s vegetated lands has shown significant greening over the last 35 years largely due to rising levels of atmospheric carbon dioxide.” This is a very different statistic, since even a 2% greening in 30% of the vegetation would count.
Notice that there are areas of red, as well. The models generally predict greater extremes of precipitation/drought, and this is borne out by observation. (Interesting – I’d heard that the area just south of the Sahara was greening, but it looks more like desertification.) Some of the additional greening is due to thawing permafrost. Boreal forests have also responded to CO2 and are a big sink, at least temporarily.
Anyway… I’m not sure about the idea that forests trap heat. Some, such as tropical rainforest, transpire lots of water and can have regional impacts on precipitation and cloud cover, but I’m not sure if anyone knows the net effects that has on temperature – cloud effects and tropical precipitation are the two biggest sources of difficulty and debate in climate modeling.
CO2 level affects photosynthetic rate and water use efficiency, but in general, the effect has been found to diminish with increasing CO2. Temperature increase alone can have a big impacts on many ecosystem variables, and in concert with CO2 the effects are likely to be quite complex. Rates of photosynthesis, respiration, transpiration and root growth and uptake; microbial and fungal interactions; nutrient availability and use; water tables; change in season length and pollinator and seed disperser communities; range, rate of spread and potential damage by invasive plants, pests and pathogens – ALL of these are likely affected by climate change and some already have been. Many many species of plants have been shown to be coming out of winter dormancy significantly (days to weeks) earlier.
I know I’m not providing links as evidence. You can trust me, do some research yourself, or if you really want the background I will give links, but it takes time that I suspect is largely wasted. Most of the above I was just reading about yesterday. Plant ecology is my area of expertise.
“Looking at the spectrum of CO2 we have absorption of CO2 in the UV”
CO2 absorbs in IR. Three peaks, one of which is in a trough for water vapor, which is one reason it’s as effective as it is.
“My question is: where is the test report that shows that the net effect of more CO2 is that of warming rather than cooling? I am afraid that the closed box experiments won’t apply since it does not take the cooling effect of the CO2 into account. You need to give me a report that quantifies both the cooling and warming effect.”
Have you ever looked? Who needs to give you a report? You are the one that doesn’t trust, and yet you don’t even know if your distrust is appropriate because you don’t have and won’t seek the knowledge. The theory is 150 years old. Why wouldn’t lab experiments pick up cooling? It doesn’t matter – there is NO cooling effect of CO2. The fact that this is a GHG is so well-established that you really should just accept it, and if not it’s on YOU to show why that’s wrong (Sorry, I don’t mean to single you out, I’m really talking to everyone. I figure the only way I might be able to get people to question their “skepticism” [ironic!] is by pointing out examples erroneous/baseless assumptions, poor reasoning, denial, misplaced distrust and judgments that are based on ignorance resulting from distrust [how can anyone reject something without knowing about it, and how can they know about it if they reject it first?]. I don’t care about policy half as much as I care about the public’s distrust of science.)
“CO2 level affects photosynthetic rate and water use efficiency, but in general, the effect has been found to diminish with increasing CO2. ”
Not to any meaningful level until we get far far above current ppm levels.
Indeed the increase is fairly linear, as is the increase in drought tolerance.
In short more food on the same amount of land and water. Whereas the purported harms are failing to manifest.
Kristi Silber
Best subsets regression is multiple regression analysis – the overall fit to the annual monthly CET since 1950 is 93.2%. Check the link for the details.
David A –
“Indeed the increase is fairly linear, as is the increase in drought tolerance.
“In short more food on the same amount of land and water. Whereas the purported harms are failing to manifest.”
This is just the kind of oversimplification that leads to erroneous judgments.
The in situ effects of elevated CO2 are not going to mimic the CO2 fertilization in greenhouses. I’m not sure if that’s what you are referring to, but that’s my guess. Correct? Or do you have a reference for a linear CO2 effect in nature, across species?
Just a couple hints of the greater complexity involved, first I came across…
” We assessed whether N limitation caused a reduced stimulation of net primary productivity (NPP) by elevated atmospheric CO2 concentration over 11 y in a free-air CO2 enrichment (FACE) experiment in a deciduous Liquidambar styraciflua (sweetgum) forest stand in Tennessee. During the first 6 y of the experiment, NPP was significantly enhanced in forest plots exposed to 550 ppm CO2 compared with NPP in plots in current ambient CO2, and this was a consistent and sustained response. However, the enhancement of NPP under elevated CO2 declined from 24% in 2001–2003 to 9% in 2008. Global analyses that assume a sustained CO2 fertilization effect are no longer supported by this FACE experiment. N budget analysis supports the premise that N availability was limiting to tree growth and declining over time —an expected consequence of stand development, which was exacerbated by elevated CO2. Leaf- and stand-level observations provide mechanistic evidence that declining N availability constrained the tree response to elevated CO2″
http://www.pnas.org/content/107/45/19368.full
Or, for a quickie excerpt:
The effect of elevated [CO2] on A [photosynthesis] is well characterized, yet the
photosynthetic stimulation observed in CO2 enrichment
experiments does not always match theoretical expectations
…. Similarly, while gs [stomatal conductance] at elevated [CO2] is typically
reduced, the effect is variable and subject to environmental
feedback ”
https://www.bnl.gov/face/pdfs/Ainsworth_%26_Rogers_2007.pdf
mynaturaldiary – Thanks, I remember seeing (some of) that data before. Interesting that you get such a nice change in signal depending on time of year. Boy, that’s a long article, you put a lot of work into that! I’m afraid I don’t have time to read it all now, but it looks interesting.
close to my calculation of 1.62K
Not that I’m someone who “really believes in man-made warming,” but keep in mind that IR (i.e., the alleged “reradiation from CO2”) can’t warm the oceans since IR does not penetrate beyond a few MICRONS of the ocean surface.
AGW is no science,'”Not that I’m someone who “really believes in man-made warming,” but keep in mind that IR (i.e., the alleged “reradiation from CO2”) can’t warm the oceans since IR does not penetrate beyond a few MICRONS of the ocean surface.”
Even at that penetration (if true), it doesn’t mean oceans can’t absorb heat! The surface absorbs and transfers heat to lower depths.
True but irrelevant. Oceans are warmed by post albedo SWR. They will accordingly emit LWR. Nobodynever said oceans were warmed by backradiation (well, except some idiots).
REMEMBER, AGW is NOT indirect warming, it is only the absence of offsetting indirect IR cooling.
Get the basics of the physics, the rest follows pretty simply.
HP, not necessarily symetric hemispherical wrming. Much more ocean in the SH, so much bigger heat sink. Thanks to the Hadley cells on either side of the ITCZ, there is not a lot of cross equator atmospheric mixing.
ristvan

heat sink? you think the supposedly extra heat from the CO2 in the SH vanishes into the oceans?
I don’t believe that. I conducted an empirical experiment – and I must say that this was still in the time where I was convinced that the science on AGW was sound –
Perhaps you have an explanation for me for my particular results?
Concerned to show that man made warming (AGW ) is correct and indeed happening, I thought that here [in Pretoria, South Africa} I could easily prove that. Namely the logic following from AGW theory is that more CO2 would trap heat on earth, hence we should find minimum temperature (T) rising pushing up the mean T. Here, in the winter months, we hardly have any rain but we have many people burning fossil fuels to keep warm at night. On any particular cold winter’s day that results in the town area being covered with a greyish layer of air, viewable on a high hill outside town in the early morning.
I figured that as the population increased over the past 40 years, the results of my analysis of the data [of a Pretoria weather station] must show minimum T rising, particularly in the winter months. Much to my surprise I found that the opposite was happening: minimum T here was falling, any month….I first thought that somebody must have made a mistake: the extra CO2 was cooling the atmosphere, ‘not warming’ it. As a chemist, that made sense to me as I knew that whilst there were absorptions of CO2 in the area of the spectrum where earth emits, there are also the areas of absorption in the 1-2 um and the 4-5 um range where the sun emits. Not convinced either way by my deliberations and discussions as on a number of websites, I first looked at a number of weather stations around me, to give me an indication of what was happening:
The results puzzled me even more. Somebody [God/Nature] was throwing a ball at me…..The speed of cooling followed a certain pattern, best described by a quadratic function.
I carefully looked at my earth globe and decided on a particular sampling procedure to find out what, if any, the global result would be. Here is my final result on that:
Hence, looking at my final Rsquare on that, I figured out that there is no AGW, at least not measurable.
hp, some basic conceptual physics. You are correct (except perhaps for the micron thick evaporative surface layer) that ‘IR backradiation’ cannot heat the ocean. But this formulation of AGW completely misstates GHE. It is not about direct warming, it is about indierct cooling, No one disputes that incoming solar SWR warms the oceans—the photic zone where photosynthesis can take place is variably about 100-200 meters deep. The question is how the incoming residual heat energy is lost. That is a radiative cooling, not radiative heating, problem.
One can hypothesize about differences in land percentages, but this divergence only started happening about the beginning of this century. http://www.woodfortrees.org/plot/hadcrut4sh/plot/hadcrut4nh Or more focused http://www.woodfortrees.org/plot/hadcrut4sh/from:1980/plot/hadcrut4nh/from:1980
http://www.woodfortrees.org/graph/hadcrut4sh/from:1990/plot/hadcrut4nh/from:1990
I believe the warming in the NH is due to the increase in open water in the Arctic ocean. I draw your attention to the graph of Arctic temperatures on the WUWT sea ice page. This seems to show the change from a frozen surface, “continental” type climate to a more marine climate.
Virtually all the global positive temperature anomaly we see is North of the Arctic circle. It is due to the state of the Arctic ocean.
I believe the present relatively low extent of Arctic sea ice is probably temporary. There seems to be ample historical indication that this is a cyclical phenomenon.
We may indeed be headed for a warmer world and an ice free Arctic. This would be due to our continued ascent from the depths of the LIA and not thanks to CO2.
If the global temperature anomaly is caused by open Arctic water and it is cyclical then we have been putting the cart before the horse. Open Arctic water cannot be caused by high air temperatures . It is the other way round. Open water causes high air temperatures. Open water is most likely caused by higher ocean temperature. This is the input to the cyclical switching of the state of Arctic ice and therefore NH temperature.
The reason for this cycle is simply that in the more open water state it takes time for the ocean to cool. The decreased summer albedo slows this portion of the cycle. Once it has cooled sufficiently the ice begins to grow again, summer albedo increases and slows the warming of the water.
It seems that the Arctic climate is somewhat sensitive and precariously balanced between permanently frozen and permanently open. This shouldn’t be surprising since whatever caused the present ice age to initiate is only two million years old so our current climate paradigm is probably barely established.
This Arctic oscillation should be studied more extensively since it will probably be one of our warning signs for the onset of the next glaciation. Which will be actual Catastrophic Climate Change. Not the phony Socialist imaginary twaddle we are forced to slap down today.
For as much as I can follow this seems to be solid work by CMoB and I thank him for his efforts. Some hard science will help but this is a political creation and in the end politics will bring it down. Politics, too, is cyclical.
Also…. maybe Earth’s tilt? If zero degrees, equal warming? With tilt, unequal warming?
“Stepwise refinement of science!” That’s what you call publishing drafts that get longer and longer the more they try to “prove” a case?
What is this feedback, Monckton? You go on about it, but what’s the mechanism for a feedback at a static temperature? “feedback response that arises from the presence of emission temperature” What is “the presence of emission temperature”?
And for what reasons do climate scientists reject your ideas, and in what ways are they wrong? It doesn’t prove your case to demonstrate it with a bunch of math if the fundamental questions aren’t answered. It’s not enough to show that “official climatology’s grave error arose” by studying a 2010 climate model when the “grave error” is theoretical and fundamental.
Wow, sounds like you need to brush up on your network analysis and feedback equations:
https://archive.org/details/NetworkAnalysisFeedbackAmplifierDesign
They are only informative if they represent real interactions. I prefer not to talk in analogies. Network analysis just another kind of model, subject to erroneous assumptions. What’s the amplifier? Sorry, I just don’t get it and no amount of network analysis will help me see the feedback mechanism.
In response to Silber, I have simply used the zero-dimensional-model equation that climatology uses, with the amendment that the forms of that equation shown as the right-hand identities in eqs. (1, 2) in the head posting are not used in climatology. Silber may care to read ch. 3 of Bode (1945), and work through the slightly more complicated form of the zero-dimensional-model equation therein, where the fact that the input signal (i.e., emission temperature in the climate) must itself induce a feedback provided that feedback processes such as those in Table 1 are present will become all too apparent.
Kristi,
OK, here is a bit on feedback, now from a graduate course on Climate Modelling.
Lecture 3: Climate sensitivity and feedback
That is from:
I hope this helps 🙂
Kristi.. MB is explicitly answering the last half of your question:
“And for what reasons do climate scientists reject your ideas, and in what ways are they wrong?”
As for the first half of your question, I also would like to know what reasons “climate scientists” reject MBs work. But will they show up here? So far, crickets.
Sailboarder, ‘Kristi.. MB is explicitly answering the last half of your question:
“And for what reasons do climate scientists reject your ideas, and in what ways are they wrong?”
That makes no sense. How can he explicitly answer the criticism of the scientists without telling us what they are? Surely he knows – he must in order to “prove” them wrong.
Most grateful to Sailboarder for his timely interventions. In answer to the acerbic Silber, the zero-dimensional-model equation that demonstrates the relationship between reference temperature before accounting for feedback and emission temperature after accounting for feedback is well and clearly described in Roe (2009), considered at a more advanced level in Bates (2016) and discussed in several papers by Professor Lindzen.
Roe (2009)
“The broadest definition of a feedback is a process that, when included in the system, makes the forcing a function of the response; in other words, some fraction of the output is fed back into the input”
Feedback in Roe is clearly a function of change. So you gave me one reference that contradicts your assertion. I’m not going to waste my time with others. I asked a simple question: what is the mechanism of the feedback you hypothesize? That should be something you can answer, not something in the literature. You are responsible for your statements.
Compared to the things you’ve said about others, my tone is quite polite.
the feedback mechanism is the increase in water vapor in the atmosphere in response to warming.
climatology agrees that the temp increase since 1850 also increase the water vapor in the atmosphere. what mb has pointed out is that warming of the earth by the sun from 3K to 1850 also increase the water vapor in the atmosphere but was not accounted for because of an error in the climatology definition of feedback.
If Silber would work through the equations in ch. 3 of Bode, it would become apparent that, in a dynamical system in which feedback processes are present, a feedback response must arise in the presence of even a constant input signal, even if that signal be unamplified.
Or do it algebraically. Take an input signal of 255 K. Take a combination of feedback processes (the feedback block) that causes 8% of the output signal to be returned via the backward path to the input node. What is the output? The answer, using the simplified form of the Bode equation that is usual in climatology, is that the output signal is 255 / (1 – 0.08) = 277 K.
The feedback is the combined feedback of all known (significant) feedbacks, as reported by the IPCC.
They are mentioned in table 1 above.
I think the argument is that there is almost no feedback. That is, double CO2 and the increased forcing does not lead to any rise in any other forcings. All you have is whatever forcing CO2 itself causes.
I’m not quite sure what the evidence for this is, or how consideration of electronic feedback relates to that. Have to read it all again more carefully. It looks like an empirical question to me, but maybe I am missing something.
Michel may like to read all three articles in this series, and also ch. 3 of Bode (1945), and Roe (2009) on feedbacks in the climate. Roe gives a good historical explanation of the origin of feedback theory at Bell Labs, then in New York, in the 1920s and ’30s, and shows how the equations derived from that theory – now of universal application in what is called “control theory” – are no less applicable to temperature feedback in the climate as they are to voltage or current feedback in electronic network analysis.
Michel,
Please see my comment slightly above: https://wattsupwiththat.com/2018/03/30/game-over/comment-page-1/#comment-2778050
That links to a lecture on feedback in climate modelling, as part of a graduate course at University at Albany.
You might recognize a lot there of what has been discussed here.
Of course as to the exact total feedback, that is very much a bit of an open issue.
And many other related issues are not universally accepted (like how much of an effect CO2 doubling really has), but for the sake of the argument that is ignored here in order to stay on track (as was stated above: ‘acceptance solum ad argumentum’, i.e. just for sake of the argument).
But it does lead to negative feedback from water vapor, ie a reduction of the normal amount of feedback.
You can see the feedback changing in the net radiation response as RH rises.
Jaap, thank you for the reference, but that’s not the issue. I know about climate feedbacks. I don’t see how a given temperature can lead to a feedback. Temperature is not the output, radiation is, and “output” itself implies change.
So what possible mechanism is there for a static temperature to induce a feedback? This is the whole crux of the argument. Monckton won’t tell us what the arguments against his hypothesis are or how he addresses them, and that is essential in science.
“The key assumption in climate feedback analysis is that CHANGES in radiative flux are proportional to surface temperature changes:
ΔFTOA=λΔTs
where λ is a constant of proportionality, with units of W m −2 K −1 “.
Perhaps not really the temperature itself, but really more the corresponding energy.
For water vapor the standard climate science feedback mechanism is described as follows:
CO2 up –> temperature up –> water vapor up –> temperature up
Note that you may read energy where you see temperature (and the exchange of that energy can be via radiation).
And also note that temperature is both an input as well as an output for the water vapor feedback (hence it is named a feedback). Because input (in T) up leads to output (in T) up this is a positive feedback.
That mechanism is based on the idea that higher temperatures allow for more water vapor in the air before saturation is achieved (and before clouds and rain).
Of course a weakness in that argument is that merely increasing temperature does not necessarily mean more water vapor, it just means more room for it. But of course higher temperatures means more evaporation. But whether that immediately fills all extra available space for more water vapor … AFAIK that is rather unlikely; however it is likely that at least some extra evaporation will take place due to higher temperatures.
In any case this has diminishing returns because this should increase the chances at clouds and rain (hence in the end it is limited by ever stronger negative feedback).
Jaap, you can see in the surface data, when MinT went up from a rise in dew point, rh started to drop.
The main flaw with positive wv feedback theory of climate is there just isn’t a lot of excess water to evaporate except over water, and open water doesn’t warm all that fast so that leads to little extra evaporation from there.
Surface dew points just follow the ocean cycles as they move pools of warm water around.
Same mechanism that leads to El Nino warming.
Silber “cannot see how a given temperature can lead to a feedback”. However, the more sophisticated form of the zero-dimensional-model equation that is given in Bode, Ch. 3, has input and output values E0, ER that are defined on p. vii in such a fashion that they may serve either as entire values or as deltas. Our testing, both on our own rig and on an improved model constructed at a government laboratory, showed that even an unamplified (mu = 1) input signal (e.g. emission temperature in the climate system) must induce a feedback response as long as a nonzero feedback fraction (beta in Bode) is present.
In our paper, we describe the math behind the Bode version of what, in the climate system, is tthe zero-dimensional-model equation, and prove – as does Bode himself – that the output signal is necessarily the ratio of the product of the input signal E0 and the direct or open-loop gain factor mu to (1 minus the product of mu and the feedback fraction beta).
This elementary feedback math (which, though simple, is monstrously counterintuitive until one gets used to it) is of direct application to any dynamical system, including the climate.
I wouldn’t get too hung up in the feedback angle.
That isn’t to say Lord Monckton isn’t blowing smoke again, of course. This time he swears by electric-circuit equations, whereas last time he said climate models were wrong because they “were using a rogue equation borrowed from electronic circuitry and bolted on to the climate, where it does not fit.” He based his theory then on a ludicrous misinterpretation of the feedback-equation hyperbola, even though many of us who actually knew something about the subject had explained that error (and several others) to him. His responses were no less inapposite then than they are now.
Independently of whether he swears by electrical circuits or rejects them, though, his fanboys will gush.
That said, whether a given quantity is characterized as feedback depends too much on definitions, assumptions, and the level of abstraction. I personally favor a feedback view, but a colloquy over at Roy Spencer’s site illustrates how arbitrary those characterizations can be.
As you recognize, it doesn’t matter whether you call, say, average snow cover and the resultant albedo a forcing, a feedback, or neither. The issue is whether, as Lord Monckton contends, the climate models simply cut such effects’ responses to temperature off at an arbitrary temperature. That’s an extraordinary claim and therefore requires extraordinary proof.
And proving it is a task to which Lord Monckton has betrayed no evidence of being even remotely equal.
the is no such thing as a constant voltage except the ground/ reference. when you fist turn on the circuit this is a change in all other voltages and at that instant the feedbacks are established.
the change wirh respect to the zero (reference/ground) voltage is no different when you switch the circuit on is no different than any other voltage change. if one creates feedback all create feedback.
The correct mechanism is described as follows (approx.):
Equatorial Pacific Sea Surface Temperature up –> Equatorial Atmospheric Water Vapor up 3 months later –> Equatorial Temperature up -> Global Temperature up one month later -> Global Atmospheric dCO2/dt up (contemporaneous with Global Temperature) -> Atmospheric CO2 trends up 9 months later
What drives Equatorial Pacific Sea Surface Temperature? In sub-decadal timeframes, El Nino and La Nina (ENSO); longer term, probably the Integral of Solar Activity.
The base CO2 increase of ~2ppm/year could have many causes, including fossil fuel combustion, deforestation, etc, but it has a minor or insignificant impact on global temperatures.
Joe Born – Thank you, you’re right. It’s not worth pursuing the feedback thing, completely futile and unnecessary. It’s really nice, btw, to know there are others around that see things similarly (though I’ve no idea of your views as a whole, at least you can see the dynamic going on here). Gets pretty frustrating sometimes seeing the endless comments vilifying climate scientists while poor arguments and “evidence” get lauded.
Feedbacks are obviously an extremely important part of climate. A feedback at stasis? Uh-uh.
Mr Born, as usual, has nothing to offer but bile. Ever since he was caught out in a gross misrepresentation, he has lost no opportunity to vent his petty spite.
Joe Born
Your long standing issues with MoB is showing through, the 2 of you need to come to some resalution and leave the rest of us out of your squabble.
KS, if you believe “greenhouse gases” to function as so-called “climate science” preaches, then the real question is not “how can a static temperature induce a feedback,” but “how can it NOT induce a feedback?”
The “mechanism” for feedback from the IR emitted based on the solar insolation reaching the Earth’s surface is no different than that based on IR supposedly “re-radiated” from “greenhouse gases,” i.e., the absorption of such IR radiation by the so-called “greenhouse gases,” as it is being lost to the relative vacuum of space.
Do you suppose that the IR emitted as a result of solar insolation has a “special pass” which exempts it from being absorbed by “greenhouse gases,” while the “reradiated” IR *from* “greenhouse gases” (which would not even exist if no feedback applied to the IR emitted as a result of solar insolation) is incapable of escaping being absorbed by “greenhouse gases?!”
“special pass” = magic!
No, it’s no magic, it’s how well any antenna absorbs a photon/radiowave of a given length. Colored glass is a great visual example. Narrowband red filters, only pass red, not blue, not green, etc.
Co2 has a few bands it absorbs, 15u is the main one of interest, visible light and other wave lengths of IR pass right by unaffected (unless they are in other co2 bands such as 10u)
Feedback was invoked by Hansen et al. link The idea was that the slight warming caused by increased atmospheric CO2 would cause an increase in atmospheric water vapor which, in turn, would cause more warming. It’s the only excuse for having to worry about CAGW.
Monckton et al found a fundamental error in Hansen’s analysis. Even if everything else said by Hansen and his successors is correct, this fundamental error sinks the CAGW ship.
Note that the ‘mid-range’ estimate in the table above of f = 0.5 is in fact the theoretical maximum for a combined effective feedback in a system with equilibrium(s), because the eventual gain G=1/(1-f) becomes unlimited once f>0.5 and the system will simply ‘explode’ to infinity.
So that feedback factor f has a maximum at f=0.5 with Charney sensitivity 1.09/(1-0.5) = 2.18 K
Mr Titulaer makes a good point that dynamical systems with feedback fractions above 0.5 can (not must) become unstable owing to factors such as unreliable componentry or unforeseen ambient operating conditions.
As Table 1 in the head posting shows, IPCC’s mid-range estimate of the individual feedbacks implies a feedback fraction 0.5, implying 2.2 K Charney sensitivity. No surprise, then, that IPCC declined to state a best estimate of Charney sensitivity, since it would have to explain how it was that, after 40 years of “settled science”, it was being compelled to abandon the 3.0-3.3 K mid-range Charney-sensitivity estimate on the basis of which governments have been panicked into squandering trillions.
“let me make it plain that my approach is to accept – for the sake of argument only – that everything in official climatology is true except where we have discovered errors. By this acceptance solum ad argumentum, we minimize the scope for futile objections that avoid the main point, and we focus the discussion on the grave errors we have found.”
The statement above is exactly why sceptics have failed to bring a decisive end to the AGW conjecture. There can be no decisive victory if we keep playing in their sandbox.
I congratulate Viscount Monckton in his victory in this particular battle. However I am pointing out that this approach of accepting the foundation claims of the radiative greenhouse conjecture as true, will never win this war.
It is true that gases with three or more atoms per molecule can absorb and radiate LWIR (Tyndall 1859 -1860 via empirical experiment), but this is not the foundation claim of the AGW conjecture. The foundation claim of the AGW conjecture is that the Sun alone could only heat the surface materials of this planet to an average of -18C (255K) in the absence of radiative gases in our atmosphere. It is in this foundation claim the most egregious error in the AGW conjecture lays. This foundation claim defies known physics and empirical observation throughout the solar system. This is not the main point of Viscount Monckton’s argument, but it should be the main point of the sceptic argument.
Given that Sun is the source of almost all energy in our climate system, studying how the surface materials and atmospheric gases absorb this energy must be the first step in any climate modelling. Given that most solar energy is initially absorbed in the surface materials of this planet, correctly calculating solar thermal gain in the true surface materials of this ocean planet is the most critical step in climate modelling.
CS (climate sensitivity to a doubling of CO2) is not the critical figure in climate science. It’s not the pea, it’s just the thimble AGW promoters pray that sceptics keep focused on. The critical figure in climate science is “Surface Tav without radiative atmosphere”. If sceptics keep accepting 255K for this critical foundation figure as a priori for argument, battles may be won, but the war to save science, reason, freedom and democracy will be lost.
Game over? Not yet.
In response to Wolf, insofar as there is any merit in our argument we have proven – by a simple method that all who wish can understand – that global warming will not exceed half of the 3.0-3.3 K mid-range estimate that has prevailed for 40 years. That being the case, as far as the global-warming debate is concerned, it’s over.
Of course, there are many other fascinating aspects of the climate that are worthy of study, and Mr Wolf is encouraged to concentrate on those areas that are of particular interest to him. He will find the process easier now, because the field will no longer be dominated by fear of catastrophic global warming. There will be some warming, but it will be small, slow, harmless and net-beneficial.
I accept that using common priori for emission temperature without radiative atmosphere, and demonstrating that CS for doubling CO2 is less than half of the current mid range estimates should reduce climate alarmism, an admirable goal. Others such as David Evans have produced similar calculations.
But ending climate alarmism is not the only goal. The standing mistakes in atmospheric physics must be erased so science can advance. Any political victory that leaves CS for a doubling of CO2 above 0.0, no mater how slightly above, is not a victory for science.
We have suffered a global outbreak of Lysenkoism that has threatened the scientific foundations of our modern civilisation. How AGW sceptics seek to bring this outbreak of pseudo-science under control will have great bearing on whether we suffer similar outbreaks in the future.
The primary surface material of this planet is salt water. Empirical evidence from our solar system indicates that the “snowline” in our solar system is out in the further reaches of the asteroid belt. It is only beyond that point that worlds with frozen oceans like Europa and Ceres can exist. The foundation claim of the AGW conjecture “Surface Tav of 255K without radiative atmosphere” for an ocean planet only a third of that distance from the Sun cannot possibly be correct. Accepting this non-physical foundation claim as a priori may win a court battle, but it will not win the war against science sceptics need to end.
Wolf
The problem is that the 255K assertion cannot be empirically tested. That being the case, one ought to be rather sceptical as to the claim. The truth is that we do not know what this planet’s temperature would be absence GHGs in its atmosphere, and everyone is simply speculating on its temperature.
I have made a similar point about Mars and the so called faint sun paradox, which pardon the pun is rather illuminating.
Mars is of course considerably further from the sun, and in the early days of the solar system, the solar luminosity was perhaps only about 70% of that seen today. To visualise this, it is like considering that Mars lies in the asteroid belt and yet it is thought that, with this low amount of solar irradiance, Mars had running water.
There is no paradox if one accepts that it is atmospheric mass and pressure, and not GHGs, that are the big players in determining planetary temperature. That would be the Occam razor approach to dealing with this postulated paradox.
“The problem is that the 255K assertion cannot be empirically tested.”
Richard,
that claim is not entirely true. We can easily empirically test solar thermal gain in most surface materials of this complex planet with all atmospheric effects save surface pressure and cloud albedo removed, with vacuum insulated solar illuminated samples allowed to radiatively cool toward a 3K background. Materials we can easily empirically check in this manner –
Sand.
Rock.
Water.
Ice.
While it is very difficult to design an empirical experiment to check solar thermal gain in vegetation, this is a minor part of our planetary surface and can be ignored for an initial “sanity check” of the “Surface Tav of 255K without radiative atmosphere” claim that is the very foundation of the AGW conjecture.
It is imperative that this foundation claim be empirically checked because we have very strong reason to believe is is in error by 2 to 3 times the 33K warming claimed for the proposed atmospheric greenhouse effect. The evidence that there is likely an error so huge comes from studying the moon.
But first, where does the 255K claim come from? All that was done to derive this figure was to enter 240 w/m2 (average sunlight at the surface) into the Stefan-Boltzmann equation with emissivity and absorptivity set to unity. This yields 255K. This flawed calculation ignores the true emissivity and absorptivity of surface materials. It ignores the conductivity and specific heat capacity of surface materials. It ignores depth of solar penetration into surface materials and it ignores the diurnal cycle of solar illumination.
We know that a flawed calculation just like this was initially used to estimate average Lunar surface temperatures. Its few variables were average solar illumination, estimated albedo, estimated solar absorptivity and estimated LWIR emissivity. When this crude Tav estimate for the lunar surface is compared to empirical results from the DIVINER Lunar Radiometer Experiment, a 90K error is found. If the Stefan-Boltzmann equation cannot get it right for the simple Lunar surface, there is zero chance it can work for the far more complex surface materials of this planet.
This report on the DIVINER Lunar Radiometer Experiment:
https://www2.physics.ox.ac.uk/sites/default/files/2012-03-08/2_thomas_pdf_10647.pdf
gives some idea of the work needed to empirically determine the true solar absorptivity and LWIR emissivity of Lunar surface materials, calibrate instruments against those experiments and the modelling complexity needed to match the empirical data returned from the mission. Without empirical experiments, empirical data and quality of modelling like this presented to support the “surface Tav of 255K without radiative atmosphere” claim for our planet, that claim simple can’t be believed.
Wolf
There is considerable merit in many of the points raised. Last year, I commented on the difficulty of calculating, from a theoretical perspective, the temperature of the moon. One only has to look at the surface of the side that faces us to see the vast differences in albedo which means that one would have to slice the moon into very small sectors to even begin to get a theoretical temperature. It is no surprise that there is a substantial difference between our measurements, and our theoretical assessment. Just because it is wondrous to behold the moon in all its glory, I post a picture:
You say:
Whilst I accept that it is difficult to design an empirical experiment, I am unsure that that it is a minor part of the planetary surface. For example, tropical rain forests cover about 17% of the planet’s ice free areas, and significantly lie in the tropics, around 10degN to 10 degS. This is the band area where most solar insolation is received, and where most surface radiation occurs.
Indeed, tropical rainforests are so dense that only about 2% of incoming solar irradiation actually reaches the forest floor. This begs the question whether solar irradiance actually warms the the surface over much of the tropics since as far as tropical rainforests are concerned, the solar insolation is being absorbed more than 30 to 45 metres above the ground, and much of it is not directly reradiated but is instead absorbed and used to power photosynthesis.
Then one has the boreal and temperate forests.
According to http://www.interholco.com/Temperate-Forests.360.0.html
Then one has to consider the role of algae in the oceans, and of course, the oceans do not absorb solar irradiance at the surface, but instead at depth (typically 2 to 20 metres but some up to >100 metres,) and the solar irradiance absorbed at depth takes time to resurface, maybe some part of it in the order of up to 1000 years.
To conclude, I see the difficulties to be immense.
The conversation between Wolf and Richard Verney, though a little off topic, is interesting. It is certainly evident that the naive whole-body emission temperature of 271 K for the moon, derivable from its insolation and its mean Bond albedo, is considerably above the correct temperature, not least because of latitudinal variability in insolation.
However, Merlis et al. (2010) have done some interesting work on Earthlike tidally-locked aquaplanets with a mean albedo 0.38 (rather above the 0.30 on the current Earth). Their conclusion is that at today’s insolation the dayside would be 280 K and the nightside 250 K, mean surface temperature 265 K, 18 K above the 247 K emission temperature derived solely from the insolation and albedo.
By spherical geometry it is not difficult to integrate the mean dayside temperatures on today’s Earth without greenhouse gases or feedbacks. The mean dayside temperature would be 289 K. If the nightside temperature were 259 K, (i.e. 9 K above the nightside temperature on a Merlis aquaplanet, just as the dayside temperature would be 9 K above the dayside temperature on a Merlis planet), global mean surface temperature on Earth would not be 255.4 K, as the crude SB calculation would suggest, but more like 274 K. If so, then, particularly after allowing for feedbacks to that 274 K baseline temperature, there would be little room for either forcings or feedbacks in response to greenhouse gases.
Can we determine the temperature of the surface of the earth wit SB. I am not so sure the earth is not a black body or a gray one either, the surface of the earths radiates, but the surface of the earth is not the radiatant heat source it is an insolator between the heat source and outer space, so the earths surface is really the outer edge of an insolator between two radiating heat sources. Neither heat source is well understood nor is insolator. It is clearly not the surface of the moon.
In response to Mr Bider, I shall explain how the emission temperature in the absence of greenhouse gases or feedbacks is currently derived. It is dependent solely upon insolation and albedo (since emissivity may be assumed to be unity without great error). Insolation is currently measured at about 1364.625 Watts per square meter, but this must be divided by four to allow (crudely, one confesses) for the ratio of the area of the Earth’s great circle to that of the equidiametric rotating sphere. Albedo is about 0.293. The fundamental equation of radiative transfer is then deployed, thus: emission temperature is equal to [1364.625(1 – 0.293) / (4 x 0.000000056704)]^0.25, where the very small quantity is the Stefan-Boltzmann constant. The answer comes out at 255.4 K.
Richard,
I agree that determining true solar thermal gain in vegetation would be immensely difficult.
However for the purposes of a crude “sanity check” on the foundation calculation for the AGW conjecture, all that would be required would be to accept the figure of 255K for ~20% of the planet’s surface, and calculate for the remaining 80% using empirical results from lab tests on sand, rock, water and ice samples.
The style of experiments used before the launch of the DIVINER lunar mission can find true solar thermal gain in sand, rock, water and ice samples. Modelling very like what the DIVINER scientists used where the latitude of material distribution is accounted for could then be used to derive a crude figure for “surface Tav without radiative atmosphere”. This could then be used to check if the 255K assumption is anywhere close to correct. The results from DIVINER indicate this would be extremely unlikely.
Viscount Monckton,
In your response to Bob Bider, you have shown the simple mathematical modelling that is used to derive the figure of 255K for “Surface Tav without radiative atmosphere” that is the foundation claim for the AGW conjecture.
However you have acknowledged that this type of calculation results in a significant error compared to empirical results when used to model lunar surface Tav. The Sefan-Boltzmann calculation results in a dramatic ~90K error for Lunar surface Tav when compared to the empirical data from the DIVINER mission. If it won’t work for the simpler materials of the Lunar surface, how can we trust the S-B approach to work to determine “Surface Tav without radiative atmosphere” for the far more complex surface materials of the Earth?
Calculating “Surface Tav without radiative atmosphere” and comparing it to current surface Tav is how we are supposed to know the atmosphere is providing a 33K greenhouse effect. But as the methodology used to determine surface Tav without radiative atmosphere has been shown to fail against empirical data for the Lunar surface, we cannot claim with any confidence that a 33K atmospheric greenhouse effect even exists on this planet.
This shows 10K of GHG effect as minimum under these conditions. There is going to be some amount more, but since no one has even identified the part here exists, the theory and math are nonsense.
One of the problems is the amount of effect varies based on conditions and is nonlinear.
The basis for the calculation is simple, and is hardly climatology. After albedo, the earth can emit only about 240 W/m2 IR. A black body (as Earth is pretty much for IR) at 255 K emits that amount. A warmer body will emit more, which it does not have. You don’t explain why you think that is wrong.
There is more than one way to cause something to radiate energy away. That isn’t dependent on its actual temperature.
For instance cooling a large volume of water vapor and releasing it’s latent heat of evaporation.
It is no longer emitting as a blackbody.
No surface material or atmospheric gas on this planet can be considered a blackbody in SW, SWIR or LWIR.
You claim water can be considered a blackbody in IR. Nothing can be further from the truth for water under an atmosphere which facilitates cooling via evaporation (loss of energetic molecules (like the ones just impacted by an IR photon)). For water to be considered a blackbody in LWIR, heating of water by surface incident LWIR would need to match surface cooling by emission of LWIR.
Nick, if you have empirical evidence of surface incident LWIR heating water free to evaporatively cool, you could make a fortune. 100,000’s of food and beverage process engineers would love to ditch the hassle of cleaning and maintenance of immersion heaters. They could just hang a non contact IR lamp providing 300 w/m2 of LWIR over a tank of liquid for a 30C gain!
No immersed electrics. No difficult to clean elements. It would be marvellous. I wonder why no one is doing this?
Wolf,
“Nothing can be further from the truth for water under an atmosphere which facilitates cooling via evaporation (loss of energetic molecules (like the ones just impacted by an IR photon)). For water to be considered a blackbody in LWIR, heating of water by surface incident LWIR would need to match surface cooling by emission of LWIR.”
Emissivity is simply a property of the surface; how much does it emit at a given temperature. Evaporation fluxes have nothing to do with it. Here (from here) is a plot of measured emissivities for various surface types, including ocean. It’s pretty close to 1. Could use actual emissivities in determining temperature with little difference.
“Emissivity is simply a property of the surface; how much does it emit at a given temperature.”
Wrong. Utterly wrong.
The hemispherical LWIR emissivity of water is 0.67. (Anyone with a quantum cascade LWIR laser and detector can test this claim).
Materials don’t absorb radiation solely at their surface, nor do they emit radiation solely from their surface. In the case of water, LWIR is emitted from within the first 100 microns of the skin evaporation layer.
For water, after 55 degrees from zenith, LWIR emissivity falls of a cliff.
Say Nick, would you like to claim on the permanent Internet record that liquid water has a hemispherical LWIR emissivity above 0.9?
Wolf,
“Say Nick, would you like to claim on the permanent Internet record that liquid water has a hemispherical LWIR emissivity above 0.9?”
Emission from sea surface is effectively black body. I’ve shown a PNAS plot above. Here from here is another (U Miami)
Your sources?
No Nick, that is “apparent emissivity”. That is what you use for the emissivity setting on your IR instrument to get an effective non-contact temperature reading on textured surfaces, or materials that emit LWIR from below their surface.
“Apparent emissivity” is not the same as “effective emissivity”.
If you knew about IR observation, you would know about “cavity effect”.
True hemispherical emissivity of water is 0.67. Apparent hemispherical emissivity of water is over 0.9.
Never use “apparent emissivity” used to correct for “cavity effect” as the true ability of a material to radiate in LWIR.
“True hemispherical emissivity of water is 0.67.”
Again you give no sources. I have already given two. Wiki gives pure water as 0.96, and says, explicitly
“These emissivities are the total hemispherical emissivities from the surfaces.”
Here is one of their sources. I have not found anywhere an emissivity of 0.67 quoted.
OK, so MoB has destroyed the IPCC position yet again, now what? Who in authority gets to see this, who gets to act on it? I’m tired of the lies, the deceit, the refusal of alarmists to play ball in any way. This needs shoving in their faces without their consent. Who is going to make something positive come of this?
CheshireRed raises a point to which we have given some thought. My own belief, born of a Classical training in mathematics and science as in much else, is that, as the apocryphal text beautifully puts it, “Great is truth, and might above all things.” We submit that we have proven that global warming will not exceed half the 3.0-3.3 K that has prevailed as the mid-range estimate for the past four decades, and that our proof is simple enough for anyone sufficiently diligent to understand. That being the case, word will slowly, surely spread.
In due course, when science has had a proper opportunity to scrutinize our argument and if science agrees that we are in substance correct, then it will no longer be legitimate for the international community to pursue the inadvertently genocidal policy of denying affordable, reliable, continuous, base-load coal-fired electrical power to the 1.2 billion people worldwide who are now prevented from having it.
There will come a point when attempting to assert that global warming will prove catastrophic unless the West is shut down will come to constitute fraud. Already, fraud authorities in various jurisdictions have had their attention drawn to particular aspects of official climatology that are fraudulent. The file is open and the public authorities are watching (indeed, they are very probably watching this thread). In the end, if we have proven that global warming will be small, slow, harmless and beneficial, attempts by certain parties to mislead politicians, Press and public by trying to suggest otherwise will be at best misguided, at worst fraudulent. Only one or two prosecutions will be needed before the scientific community relearns that it is subject to just the same laws as the rest of us.
The end and object of science is not profit; it is not the destruction of capitalism; it is the objective truth.
I wonder if Mark Z Jacobson of Stanford’s withdrawl of his suit was influenced by rumours of this paper.
Will your paper be accepted in a peer reviewed journal prior to the closing date for AR6?
If it is published in time, one could seek to push the IPCC to look at the paper.
“Only one or two prosecutions will be needed…..”
Might David Keith be one of these prosecutions?
https://www.smithsonianmag.com/smart-news/proposed-test-stirs-debate-solar-geoengineering-180962745/
“The file is open and the public authorities are watching (indeed, they are very probably watching this thread).”
I expect the Prime Minister is scrutinising it closely.
No, the Prime Minister is not scrutinizing this thread closely. One of my co-authors, however, communicated an outline of our result to her face to face and, in due course, when we are ready, relevant Ministers will be briefed.
Note in passing that, as discussed earlier, the upper-bound feedback fraction works out at the absurd value 1.0.
Oh it’s not absurd at all. It tells us the seas are about to boil. But some components of sensitivity had a slow reaction time, so we have maybe a few years before the end is near. Where’s my Bible again?
Amen to that, brother! Time to reread some of the more excitable Psalms, to say nothing of the juicier bits of the Book of Revelation.
‘Well, the Book of Leviticus and Deuteronomy
The law of the jungle and the sea are your only teachers’
‘Jokerman’ which might apply to some of the commenters here.
The best biblical account comes from Genesis 1, the creation.
In slide presentation: https://lenbilen.com/2017/07/23/genesis-1/
The Hebrew word you translate as “expanse” means a solid dome, not an “expanse”.
The word “rāqîaʿ” (רָקִ֫יעַ), in Biblical Hebrew is derived from the root raqqəʿ (רָקַע), meaning “to beat or spread out thinly”, e.g., the process of making a bowl by hammering thin a lump of metal. It’s onomatopoetic from the sound of pounding on metal, similarly to English “racket”.
Like most ancient Near Easterners, the Hebrews believed the sky was a solid dome (“vault of heaven”) over the flat earth. The Greek Septuagint translated “rāqîaʿ” as “stereoma”, which St. Jerome rendered into Latin as “firmamentum”, hence English “firmament”.
The “waters above” include the “storehouses” or “treasures” of what we would call precipitation, ie rain, snow, sleet, hail, but also of the wind. The Bible doesn’t understand the hydrological cycle.
Reply to lenbilen. Sorry.
“This is not coincidental. The ‘best’ Charney sensitivity, whether calculated using the energy budget, or observed v. modeled via Bode’s feedback fraction f, is half of the ‘best estimate’ in IPCC (2007).”
And I showed here why it is not coincidental. The effect of all this rigmarole about feedback is a fantasy. As a matter of simple arithmetic, all that is done is the very most primitive calculation possible. That is to take the current degree of warming since industrial (or any other time you like, but thta is used here) and divide by the forcing difference over that time. That gives sensitivity in units of K/(W/m2); to convert to K/doubling. multiply by 3.5.
People have been doing that since forever, but it is clearly unsatisfactory, because it doesn’t take account of the time needed to settle down, and you can get radically different answers depending on time interval. It doesn’t correspond to ECS, or TCR either So Lord M’s final step is to multiply by a fudge factor 1.4, to try to allow for this. You can choose any factor you like. Rud prefers 1.25 which gives better agreement to his favourite outcome.. So yes, it isn’t a coincidence.
There is nothing new here. “Game over”. Yes, Lord M has spoken. 1.4. The end.
As Mr Stokes knows perfectly well, 1.4 is not a fudge factor: it is a value directly calculated, as explained in the head posting, from a mainstream, published estimate of the Earth’s radiative energy imbalance. If Mr Stokes does not like that value, he may choose his own.
” If Mr Stokes does not like that value, he may choose his own.”
Exactly! As Rud did. But the way it is done in the head post is by offsetting the ocean flux. This is just what Lewis and Curry did. So it isn’t some new event that says “game over”. It is just a rehash.
But the fact is that the quantities juggled here are not at all well established. Lord M says 0.59 W/m2 for ocean flux today; a day or so ago, it was 0.7 W/m2. Nic Lewis realised this, and tracked the uncertainty properly. Here is how he stated the result:
Rud likes quoting the figure of 1.6 K/doubling as ECS gospel. But when you go to source, and look at the 95% range (actually, 90%), it is, on a preindustrial base, 1.05 to 4.05 K/doubling. Or, on a more recent period, a mean of 1.72 but a range 0.9 to 9.45 K/doubling. That is Lord M’s calculation, done properly. And it obviously isn’t game over. In fact, it doesn’t dent the IPCC range at all. It is even more uncertain.
Nick I agree with you, its BS. Never thought I would say that!
Wolf has it right.
NS, you are flailing about in dispair in pseudouncertainty, Read the Lewis and Curry paper again, for their confidence intervals. Look at the table you reposted, with its absurd upper bound per Bode analysis. It really is mathematical game over, IMO.
First Army rule of holes. When in one wanting out, first stop digging, STOP DIGGING.
“Read the Lewis and Curry paper again, for their confidence intervals.”
Tell us about it, Rud. I showed the relevant table from the Lewis and Curry paper, with the confidence intervals as they showed them. Why do you say they aren’t true?
Mr Stokes’ increasingly bitter contributions do not do him credit. Our method is not a “rehash” of Lewis & Curry 2014: it identifies climatology’s failure to take due account of the feedback response to emission temperature in deriving its feedback fractions. Our empirical calculation to derive Charney sensitivity, which was carried out merely to verify that the theoretical calculation was reasonable, was done in a far simpler manner than that in Lewis & Curry.
All we did was to take the product of equilibrium temperature (i.e., observed temperature of 0.75 K since 1850 uplifted by 37.4% to allow for the mid-range estimate of the energy imbalance in Smith 2015) and the ratio of the 3.5 W/m2 CO2 forcing to the 2.29 W/m2 net anthropogenic forcing to 2011 (IPCC, 2013, table SPM.5). Answer: equilibrium sensitivity of about 1.55 K. Naturally, we also derived the feedback factor implicit in this result: namely, 1 – 2.29 / 3.2 / 0.75 / 1.374 = 0.29 (the divisor 3.2 being our way of allowing for the Planck parameter). We were interested in the feedback fraction because we wanted to see how it compared with the feedback fraction of 0.203 obtained by the pre-industrial, theoretical method. It is very much on the high side, suggesting either that the measurement of energy imbalance is inaccurate (not surprising given the sparsity of the ARGO bathythermographs) or that some fraction of the industrial-era warming arose from internal natural variability.
The wide uncertainties in Lews & Curry arise because, like the models, they do not use feedback directly at all in their calculation. It is entirely the hyperbolic feedback response curve that accounts for the very high equilibrium sensitivities (>4.5 K) that have hitherto been imagined. The method of Lewis & Curry cannot rule out such high sensitivities: our method does. That’s why we say it’s game over.
“All we did was to take the product of equilibrium temperature (i.e., observed temperature of 0.75 K since 1850 uplifted by 37.4% to allow for the mid-range estimate of the energy imbalance in Smith 2015) and the ratio of the 3.5 W/m2 CO2 forcing to the 2.29 W/m2 net anthropogenic forcing to 2011 (IPCC, 2013, table SPM.5). Answer: equilibrium sensitivity of about 1.55 K.”
And that is exactly what Lewis and Curry do. It is a rehash. Here is their equation:
Lord M’s factor of 137.4% is just 1/(1-ΔQ/ΔF). IOW, he writes
3.5*ΔT/(ΔF-ΔQ) as 3.5*(ΔT/(1-ΔQ/ΔF))/ΔF
“The method of Lewis & Curry cannot rule out such high sensitivities: our method does. That’s why we say it’s game over.”
The methods are identical.
Mr Stokes continues to fail to acknowledge that our theoretical approach to the derivation of climate sensitivities owes nothing whatever to Lewis & Curry. It is based on a correction to climatology’s large error in failing to make due allowance for the amplitude of the large feedback response to emission temperature.
Then we verify that result by an empirical method which is similar to that of Lewis & Curry to the extent that it takes note of the measured energy imbalance. However, it is manifestly distinct from that of Lewis & Curry in that, since we have already established an approximate upper bound on the feedback fraction by the theoretical method, we can rule out the extreme variances in energy balance that a few authorities try to suggest, and, therefore, we do not get the same monstrously wide sensitivity intervals that are evident in Lewis & Curry.
What on Earth would be the point of our merely regurgitating Lewis & Curry, or any other published paper, for that matter?
“However, it is manifestly distinct from that of Lewis & Curry in that, since we have already established an approximate upper bound on the feedback fraction by the theoretical method, we can rule out the extreme variances in energy balance that a few authorities try to suggest, and, therefore, we do not get the same monstrously wide sensitivity intervals that are evident in Lewis & Curry.”
No, it is manifestly identical. You kindly spelt out your calculation sequence; I put that in exact correspondence, number for number, with the formula that Lewis and Curry use. One point of showing that your method gives a result numerically independent of the feedback fraction is that putting an upper bound on that fraction can make no difference to the CS result or its uncertainty. If you perform the same calculation sequence as L&C, the result will be subject to the same uncertainty.
“What on Earth would be the point of our merely regurgitating Lewis & Curry…”
I don’t know.
Mr Stokes continues deliberately to ignore the fact that we reach our estimates of transient and equilibrium sensitivity by two distinct methods, the first of which is theoretical, applies to the pre-industrial era and corrects official climatology’s long-standing error in imagining that there is no feedback response to emission temperature. We verified our theoretical result with an empirical calculation using a standard and rather obvious method akin to, if rather simpler than, similar methods that appear in the climate-sensitivity literature.
The difference is that we can rule out the absurdly high upper bounds imagined e.g. by Lewis & Curry because those upper bounds could only arise in the presence of very large feedbacks, while our theoretical study indicates that the feedbacks are not very large.
Is the method something like this?
Figure out what the direct warming effect of 280 ppm in 1750 would be, absent any other forcings. Then assume that any excess over this to get to the 1750 temp must be feedback. Then apply this to the warming from 1750 to present as a test. If the combination of the rise in CO2ppm plus the excess gives the observed rise in temperatures, this validates the first estimate, so assume this is the effect of a rise in CO2, and project it forward.
Is that the method being used?
In answer to Michel, Mr Stokes finds it expedient to say that our method is a “rehash” of Lewis & Curry 2014. It is, of course, no such thing. One only has to look at the immense error-bars in the Lews & Curry paper to see that they have not found a way to constrain the amplitude of the feedback fraction.
Our theoretical method has nothing to do with the Lews & Curry method at all. We begin by noticing that official climatology takes little or no account of the actually substantial feedback response to emission temperature, even before accounting for the warming caused by non-condensing greenhouse gases. We show that if one allows properly for that large feedback response, the feedback fraction becomes considerably less than current estimates. From the corrected, lower value of the pre-industrial feedback fraction, we derive first a transient sensitivity and then an equilibrium sensitivity.
To verify that result, we operate a second, distinct method, this time empirical and, therefore, based on the period since 1850, for which data such as a global temperature record are available. Here, we derive transient sensitivity and then equilibrium sensitivity by a comparison between the industrial-era direct warming (before accounting for feedbacks) that corresponds to IPCC’s estimate of 2.29 Watts per square meter net anthropogenic forcing to 2011 and the observed global warming over the same period. It is really as simple as that. We wanted to keep it simple, if we could, so that as many as possible would be able to understand our argument. That element in our approach seems to be working.
There will be further pieces in this series, if strength permits (for I am very unwell at present). These pieces will explain in more depth some of the concepts that commenters here are finding difficult, and, as with the current head posting, we shall take into account any adjustments that those comments properly suggest we should make.
“Rud goes on to point out that, as several papers show, the CMIP5 models produce about half the observed rainfall, implying that the modeled water-vapor feedback is double the true value.”
I don’t thin k it is true (half), but anyway it certainly doesn’t carry that implication. There is no rule that says rainfall is proportional to humidity.
Another interesting question is whether the exponential growth in the atmospheric burden of water vapor that is found in, say, Wentz (2007) is occurring in reality. A commenter here says James Hansen shut down the GISS water-vapor monitoring project in 2009 because there was not much evidence of such growth. If such growth is not unmistakably evident, it could be that increased precipitation is a homoeostatic process tending to keep the atmospheric burden of water vapor near-constant.
Another interesting question: is the exponentiality of the feedback process offset by a logarithmicity in the radiative effect? The CO2 forcing is approximately logarithmic within the interval of interest; is the water-vapor feedback forcing likewise approximately logarithmic? I only ask because I want to know.
Water vapor generation may be dominated by wind. The relationship might be near exponential to average wind velocity. The failure of water vapor to rise with temperature, as expected, might be due to the lack of significant change in the earths winds.
Monckton of Brenchley March 30, 2018 at 6:03 am
Another interesting question is whether the exponential growth in the atmospheric burden of water vapor that is found in, say, Wentz (2007) is occurring in reality. A commenter here says James Hansen shut down the GISS water-vapor monitoring project in 2009 because there was not much evidence of such growth. If such growth is not unmistakably evident, it could be that increased precipitation is a homoeostatic process tending to keep the atmospheric burden of water vapor near-constant
You shouldn’t believe everything you read on blogs!
Here’s a link to the current NASA water-monitoring project:
https://earthobservatory.nasa.gov/GlobalMaps/view.php?d1=MYDAL2_M_SKY_WV
Phil,
That’s not GISS’ water vapor-monitoring project. NASA is still observing our planet’s water vapor, but GISS isn’t. NASA has various components. GISS itself should be shut down. I’m disappointed that Trump hasn’t done so.
“That’s not GISS’ water vapor-monitoring project”
So what is this supposed GISS project that was supposedly closed in 2007? This project linked by Phil., AFAIK, is the only one NASA has had, and as you can see, it has run from 2002 to present.
I have visited the NASA water vapor page mentioned by “Phil.” The page states not that the burden of water vapor is inexorably increasing but that “The most noticeable pattern in the time series is the influence of seasonal temperature changes and incoming sunlight on water vapor.”
Nick, over on Climate Etc I just cited three of the AR4 papers footnoted in The Arts of Truth, plus both essays in ebook Vlowing Smoke that carry those findings into AR5. You want to play hwre, at least do your literature homework like I have.
Rud,
“Nick, over on Climate Etc I just cited three of the AR4 papers footnoted”
The conventional thing is to cite details where you claim. But OK, I did some homework. And as I expected, they don’t say anything like what you claim, which was, per MoB
“Rud goes on to point out that, as several papers show, the CMIP5 models produce about half the observed rainfall, implying that the modeled water-vapor feedback is double the true value”
What Wentz says is quite different. I’ll quote (wish more people would):
“Climate models and satellite observations both indicate that the total amount of water in the
atmosphere will increase at a rate of 7% per kelvin of surface warming. However, the climate
models predict that global precipitation will increase at a much slower rate of 1 to 3% per kelvin. . A
recent analysis of satellite observations does not support this prediction of a muted response of
precipitation to global warming. Rather, the observations suggest that precipitation and total
atmospheric water have increased at about the same rate over the past two decades.
…
Earth’s surface warmed by 0.2 K decade–1 during this period,and hence the observed changes in E and P suggest an acceleration in the hydrologic cycle of about 6% K–1 , close to the C-C value. I”
So, it isn’t half the observed rainfall, which would be unbelievable. He is talking about the rate of increase, not the amount. And the paradox, if any, is that the models are underpredicting rainfall increase. But it says that they got the total water vapor about right. And that is what determines feedback.
From Wentz (2007), it seems that the observed rate of increase in precipitation is between twice and seven times the rate predicted in the models. This may be one reason why so few datasets show the model-predicted tropical mid-troposphere hot spot.
But let us suppose that the water vapor feedback and, therefore, the feedback sum is 1.6 Watts per square meter per Kelvin, as IPCC (2013) finds it to be. Then the feedback fraction is 1.6 / 3.2, or 0.5, as IPCC shows in its table of feedbacks. In that event, equilibrium sensitivity is 3.5 / 3.2 / (1 – 0.5), or 2.2 K, scarcely above the 2 K low-end estimate of the CMIP3/5 models. But is the feedback fraction really at all likely to be as high as 0.5? On our theoretical analysis based on pre-industrial temperature, we think not.
Nick says, “So, it isn’t half the observed rainfall, which would be unbelievable. He is talking about the rate of increase, not the amount. And the paradox, if any, is that the models are underpredicting rainfall increase. But it says that they got the total water vapor about right. And that is what determines feedback.”
Rainfall = precipitation
precipitation = negative forcing
If the rate of increase of precipitation is underpredicted (underprojected?) by the models does that not constitute a major problem calling the results of the models into question?
While the models may have the water vapor concentration “right” it is disingenuous to ignore the cooling effect of precipitation. Clearly a flaw which has to have a significant effect on the value of these models’ determination of feedback. If precipitation is increasing, that is an increase in a negative feedback, is it not?
Mr Stalewski makes a fair point. Since measured precipitation is increasing at up to 7 times the models’ predictions, one inevitable consequence is that the additional precipitation will tend somewhat to diminish the precipitable column water vapor and consequently to reduce the water vapor feedback. It is already apparent that the IPCC had overestimated the water vapor feedback. Indeed, there has been little net increase in column water vapor or specific humidity throughout the period of record and, in the vital mid-troposphere, where more water vapor might actually make a difference to global temperature, there has if anything been something of a decline, in stark contrast to the predicted mid-troposphere “hot spot”, which is not found to be present except in one (or perhaps two) suspect databases.
MOB, one nit:
“Emission temperature would obtain at the Earth’s surface if there were no non-condensing greenhouse gases or feedbacks present.”
Should probably be more correctly stated as follows:
“Emission temperature would obtain at the Earth’s surface if there were no greenhouse gases or feedbacks present.”
This will avoid any related circular arguments about the feedback being “baked in,” since what you are defining is the blackbody radiation temperature absent feedbacks, i.e., it does not encompass ANY “greenhouse gases” (not *just* the “non-condensing” variety) or feedbacks whatsoever.
A fairish point from AGW is not Science: my own formulation was intended to preserve the distinction between the non-condensing GHGs (which exert forcings) and water vapor (which is the agent of a feedback).
Except that there is zero difference conceptually between water vapours and CO2. COT do0es not ‘force’. It is a feedback in its own right, expressed as a forcing for mathematical convenience.
The presence of CO2 and indeed water vapour lowers the effective emission temperature of the earth as a whole, by reflecting or re-emitting radiation that would otherwise radiate to space.
The only realise to additionally call water vapour ‘positive feedback’ is on account if the erroneous and refuted hypothesis that as temperature rises, more water vapour (but not more cloud) will be present in the air.
The T^4 term is the most massive negative feedback term in global temperature. I suspect the water cycle is the next most significant.
Water feedback is not positive, its negative. Cloud tops cool and it rains or snows cold stuff. Clouds INCREASE the radiation temperature of the earth and INCREASE its albedo.
For sure the IPCC is operating on a broken model, but Christopher, with respect, I think you are, too.
I think we will find in the end that climate change as its understood by the warmistas, is in fact a localised phenomena in time and in place.
Imagine this is the atmosphere:
And like the beaker, its heated from below by sunlight falling on the surface.
What you see are chaotic circulations patterns as localised lumps of ‘hot’ are displaced by falling bits of ‘cold’ with the whole think held more or less in a constant temperature by what in this case is the massive feedback of the latent heat of evaporation, and, in the atmospheres case, is the t^4 term Plus a bit of latent heat on evaporation as well.
Now add in the complexity of geography, where oceans and currents have limited scope to operate, and mountains that divert atmospheric flows and cause precipitation, and you have more than enough complex non linear variables to account for everything observed.
Remember it is not necessary to show how and why climate varies, merely to show that the process is not dominated by man made CO2. The temperature record alone shows that.
Once that is demonstrated and becomes accepted by the political classes, all the bad consequences of climate change – renewable energy etc etc – vanish.
There remains only the case for ‘Be prepared’ for uncontrolled and uncontrollable NATURAL climate change.
If by our actions we burn coal, oil and gas and thus return to the atmosphere some of the CO2 that was present in former times, then we are forcing the climate. This is called the “CO2 forcing”.
If, on the other hand, that forces cases warming, and the warming raises the temperature of the upper or mixed stratum of the ocean, then by Henry’s Law CO2 will be outgassed from the ocean, and this is the “CO2 feedback”, though it is remarkably difficult to quantify.
I never took a physics course in college, but thank you so much for the evidence that my instincts (about CO2 alarmism) were right all along.
Dear Mr Andrews, – Many thanks for your kind comments. I did some elementary physics at school, and a lot of math since, but the value of our argument is that it is comprehensible to anyone with high-school math and a little determination.
Although “climate scientists” may have a bit of trouble with it….
With respect, no, it isn’t.
I find it muddled and not very clear, and playing fast and loose with the concept and mathematics of feedback and lacking a clear understanding of the difference between mathematical models of convenience and the reality of physical processes in so far as that has meaning anyway.
However its perfectly delightful Counter BS to go up against the IPCC BS.
Mr Smith will need to be more specific about any defects he finds in our analysis.
“Transient climate sensitivity, the warming expected to occur immediately in response to a forcing. The chief reason for the difference is the delay occasioned by the vast heat-sink that is the ocean.”
But in reality the AMO acts as a negative feedback to changes in indirect solar forcing. So does ENSO, a period of weak solar wind will drive El Nino conditions, as will major volcanic aerosol events. That puts a spanner in the works of a positive TCS.
Yogi Bear is not correct to state that ocean cycles necessarily render transient sensitivity negative.
On what basis do you assert that I am not correct, the popular assumption that ENSO and the AMO are internal variability and unforced?
Low solar increases negative AO/NAO, which drives a warm AMO, and negative AO/NAO is directly associated with slower trade winds.
Yogi Bear appears not to understand that transient and equilibrium sensitivities are derived on the basis that there is no natural variability, or that, if there is, it is canceled out. Natural variability affects the real climate, but it does not affect the derivation of climate sensitivities. We are not looking at regional events in the short term, but global events in the long.
“Yogi Bear appears not to understand that transient and equilibrium sensitivities are derived on the basis that there is no natural variability, or that, if there is, it is canceled out.”
Of course I understand that with assuming that the ocean cycles are internal variability, that they should amount to zero sum in the long term.
“Natural variability affects the real climate, but it does not affect the derivation of climate sensitivities.”
I contend that ENSO and the AMO function as negative feedbacks to solar variability. That would have a devastating effect on the perceived non-condensing ECS margins. It also gives a frame of reference for how weak rising CO2 forcing must be, as that should in theory inhibit AMO warming by increasing positive North Atlantic Oscillation conditions, like stronger solar states do.
“We are not looking at regional events in the short term, but global events in the long.”
ENSO has global impacts, the S Hem has a strong AMO signal.
Yogi Bear can “contend” anything he wants. However, the basis on which the head posting is written is that everything in official climatology is accepted except what we can prove to be erroneous. This thread, therefore, is not the place for alternative theories, however interesting. In official climatology it is a matter of definition – and a common-sense one at that – that natural variability is excluded when deriving climate sensitivities to anthropogenic influences.
“In official climatology it is a matter of definition – and a common-sense one at that – that natural variability is excluded when deriving climate sensitivities to anthropogenic influences.”
It’s a matter of deception stating that the AMO cycle is purely internal without understanding what causes it.
Yogi Bear still has not gotten the point. We have accepted all of official climatology for the sake of argument, except where we are able to demonstrate an error. If Yogi Bear wishes to write a paper on his theory and submit it to a learned journal, he is entitled to do so. But his opinions on whether the ocean oscillations ought to be treated in a manner different from their current treatment in climate-sensitivity studies is simply irrelevant here, and is beginning to acquire the characteristics of a deliberate diversion.
For the sake of a specious argument.
I hate throw a wet blanket on this “CO2 is a blanket just not a big, thick, hairy one” theory of climate, but the sensitivity of the climate to carbon dioxide is actually zero. Don’t become flummoxed by the fluxes up, down, whatever…….In a free and open convective atmosphere CO2 cannot trap heat. Read @nikolovscience
One of my favorite descriptions of this is “Attempting to “trap” heat with CO2 is like trying to “trap” mice with a chain-link fence.”
Minarchist, comments like yours are what give skeptics a bad name. Don’be ridiculous about a basic GHG fact shown experimentally by Tyndall in 1859.
Tyndall did no such thing. In his 1861 paper he confused absorption with opacity. He also held the mistaken notion of luminous ether. You are just falling for the propaganda of Spencer Weart and the revisionist history contained in his paper “The Discovery of Global Warming”.
In 1859 Tyndall empirically demonstrated that some gases could warm by absorbing LWIR. In 1860 he empirically demonstrates the same gases could cool by emitting LWIR.
These experiments while valid, say nothing about the net effect of these gases in our atmosphere. Tyndall’s work is not empirical evidence of an atmospheric radiative greenhouse effect.
To date there has been no empirical verification of Fourier’s 1820’s calculation that the Sun alone could only heat the surface materials of this planet to a temperature around 30 degrees below our current average.
No, he has a real point.
If we look at heating from below, convection carries warm air/water vapour above the level where CO2 can ‘re -radiate’ escaping heat backwards
https://andthentheresphysics.wordpress.com/2014/03/05/effective-emission-height/
gives a decent explanation of the complexities involved.
Since a large amount of heat is radiated from heights over 10,000 feet where already the atmosphere is getting much thinner, CO2 will have far less of an effect.
“The atmosphere has a mass of about 5.15×10¹⁸ kg, three quarters of which is within about 11 km” says wiki.
shows that decent thunderheads will easily match that, taking cloud top radiation well above most CO2
THis is what one fines all over ‘warmista’ science’ Facts are there, but are totally ignored, like the one I keep going on about, that thermally induced feedback MUST respond identically to increased CO2 ‘forcing’ as to major volcanic eruptions. And yet the science doesn’t treat these the same.
Come off it ristvan. Analogies are never very good. This one on parr with the greenhouse Analogy; so best not to throw stones.
Meanwhile the clouds shoot up through the chain links with lots of energy to dissipate into space. OK — Another trite remark.
Cheers.
The exchanges immediately above the present comment demonstrate why I have taken the strict approach of accepting ad argumentum everything in climate science that I cannot disprove. That allows the discussion to be focused on the errors we say we have identified. Chief among these is the failure of official climatology to accord due weight to the large feedback response to emission temperature.
Yogi Bear makes the valuable point that there are a number of thermostatic processes in the climate. It is not clear that the general-circulation models take these processes sufficiently into account. For instance, Willis Eschenbach, in his incomparable series of data studies, has found clear evidence of a thermostatic feedback in the one place that really matters – the tropics. As the equatorial zone warms, tropical afternoon convection (i.e., some of the most spectacular thunderstorms on Earth) occurs earlier in the afternoon than before, tending to keep the surface cooler. I do not know to what extent the models take account of the Eschenbach phenomenon, but I suspect they don’t represent it properly – or many others like it.
The big feedback in the tropics is the drop in cloud cover since the mid 1990’s. Which is popularly misconstrued as a positive feedback.
CMoB, they do not account for it at all. The grid cells in CMIP5 are farmto large to model convective processes. These are parameterized, then tuned to best hindcast. See my guest post here some years ago, The Trouble with Models, for details and illustrations.
Mr Istvan draws attention to one of the fundamental problems not only with the models but also with the datasets. The Argo bathythermographs from which the planetary energy imbalance is derived, for instance, each cover an area of ocean the size of Lake Superior with the equivalent of a single measurement less than once a year. Many of the processes that drive the climate are sub-grid scale. But if the grid became well-enough resolved to encompass those processes, the computation time would become excessive. That is why modeling the climate has severe limitations that the modelers themselves find it profitable seldom to discuss, except when asking for more taxpayers’ money for the next generation of supercomputer.
“and the emission temperature of 255 K that would prevail today in the absence of greenhouse gases”
You cannot have 0.3 albedo with no clouds. Your dry Earth black-body temperature is 279K.
Though that figure (394K*0.25^0.25 = 278.6K) is unphysical as the Earth is heated only on one side and not uniformly. The real forcing figure is an average 394K*0.5^0.25 = 331.3K for the sunlit side, and zero for the dark side. That’s why the Moon is such a cold mistress, nothing to do with its slow rotation as many would like to believe.
The speed of rotation plays a role whenever something is not a blackbody.
If there was perfect instantaneous response (as there is with a genuine blackbody), it would not matter how quickly the body rotates.
The issue is what impact does the speed of rotation have?
It would be interesting to look at Mars, since this rotates at a similar speed to Earth. I have not found good evidence on this, but the following is of some interest:
See: http://earthsky.org/space/temps-in-mars-atmosphere-mars-rise-and-fall-twice-a-day
But in practice the average temperature of the black body is half of 331.3K and not 279K whether it is rotating or not.
“The issue is what impact does the speed of rotation have?”
The big issue is what impact do the thermal reservoirs have? Ocean surfaces barely cool at night, the 850mb level of the atmosphere barely cools at night.
“You cannot have 0.3 albedo with no clouds. Your dry Earth black-body temperature is 279K.”
Yes ! I always like to ask, “Where did all that cooling come from?” 🙂
Apparently what Lacis does is implicitly introduces the water and a low enough temperature that he gets the albedo governed by the surface contribution of the solid phases of water. How all that solid phase appeared is an unanswered matter.
Lacis may overlooked a critical aspect of atmospheric physics, that having only 10% of current levels of atmospheric water vapour, would increase the amount of solar irradiance reaching Earth’s surface, because water vapour absorbs considerable amounts of solar near infrared.
may *have* overlooked…etc
In response to Yogi Bear, I consider the 255 K emission temperature that is standard throughout paper after paper after paper after paper in the learned literature of climatology is incorrect. probably very much on the low side. But I cannot yet quite prove it. So I am accepting this value, like many others, purely for the sake of argument. Even if that value is correct (and I think it should be some 19 K higher), then we can demonstrate that anthropogenic global warming will be small, slow, harmless and net-beneficial.
Mr Verney raises the legitimate question why 1850 is taken as the beginning of the industrial era in our calculations. The reason is that anthropogenic influence, though theoretically possible from 1750 on, was negligible before 1850, and we have a global dataset of surface temperature from 1850. As far as possible we have tried to base our result on the available data.
“then we can demonstrate that anthropogenic global warming will be small, slow, harmless and net-beneficial.”
Within that irrational frame of reference you most likely can indicate that.
As Yogi Bear will learn if he ever does any science, it is necessary to try to compare the longest possible datasets that cover the same period. That is the frame of reference within which every scientist will try to operate.
Monckton says:
“.. if he ever does any science..”
You are blind to the physics of what you are trying to model with maths. I offered you science and you talked around it and denied it. By insisting that the oceans are only heat sink and not a heat source (on your last post). By asserting that natural climate variability is internal. And you haven’t directly challenged my comment above at March 30, 2018 at 6:18 am.
Yogi Bear continues to take a regrettably intemperate and unscientific approach. I did not insist that the oceans are only a heat sink: I explained carefully, politely and on several occasions that in the head posting I had accepted all of official climatology for the sake of argument. The ocean is a heat sink to the atmosphere but is also to a far smaller extent a heat source for the atmosphere insofar as it transmits magmatic heat upward via overturning.
“Yogi Bear continues to take a regrettably intemperate and unscientific approach.”
No at all, I introduced you to the elephant in the room. Oceans are a huge heat source every night, their surfaces barely cool, due to nigh time convection in the upper ocean.
Someday I must take Yogi Bear to Earth, where he will see that the ocean surface warms during the day and cools during the night. However, elementary calculations indicate that the change in temperature of the first five meters of ocean depth, ttreated as a slab, is not that great from day to night and back again. It is simply irrelevant to the climate-sensitivity calculation. Of more interest is the extent to which the upper or “mixed” stratum of the ocean (in this case a rather thicker slab) is warming owing to the fact that the atmosphere above it has been made warmer by greenhouse-gas emissions. This warming is measured (albeit sparsely, inadequately and with very large errors) by the ARGO bathythermograph buoys, and the measured temperature change is then converted to a change in ocean heat content.
“It is simply irrelevant to the climate-sensitivity calculation.”
It’s not the atmospheric greenhouse effect which keeps the ocean surface warm at night. Keep thinking about the night time convection until the penny drops.
“Someday I must take Yogi Bear to Earth, where he will see that the ocean surface warms during the day and cools during the night.”
Maybe you should come back to Earth now and read what I wrote above.
Tropical sea surface diurnal temperature:
Yogi, and those temps are why the increase in co2 has little impact on positive feedback over the oceans, and it has little impact over land because there little free standing water to evaporate.
Whilst not joining issue with the theoretical approach that is the heart of your paper, and whilst I consider that feedbacks kick in as soon as temperature is raised above 3K, being the background temperature of space, which is essentially the non solar driven temperature of planet Earth, why take the starting point as 1850? Is using this date not simply curve fitting?
For example, why not start the empirical exercise at the peak of the Holocene, or RWP or MWP? If we did this, a different conclusion would be reached.
We are often told that the MWP was not global, but that assertion is not based upon evidence establishing that it did not exist in the Southern Hemisphere, but merely because there is an absence of evidence in the Southern Hemisphere for its existence. The drawing of conclusions from the absence of evidence is so typical of climate science
However, there is an absence of evidence in the Southern Hemisphere generally because it is largely ocean or Antarctica. This is why Phil Jones, in the Climategate emails, was spot on with his forthright comment to the effect that the Southern Hemispheres temperatures are largely made up. In his 1980 paper he was not quite so forthright and merely noted that the position with the Southern Hemisphere was uncertain, due to lack of historic data and poor spatial coverage. Hansen in his 1981 paper essentially concurred with Phil Jones with regard to the uncertainties surrounding the Southern Hemisphere.
The reality is that the data covering the Southern Hemisphere is so poor that we should be working only with the Northern Hemisphere. That being the case, why don’t we look at the position as from the MWP say using using data from the Greenland ice cores? On that basis, there would appear to be no empirical evidence that CO2 has done anything.
PS, I understand fully the solum ad argumentum point, and I am merely pointing out so much of climate science is nothing more than curve fitting and does not withstand hard scientific scrutiny. Until we can fully explain the natural climate, we cannot even begin to assess whether there is some anthropogenic factor now in operation.
“…I am merely pointing out so much of climate science is nothing more than curve fitting …” – Not so much as fitting the curve to the data, as fitting the data to the curve…
“Until we can fully explain the natural climate, we cannot even begin to assess whether there is some anthropogenic factor now in operation.”
THIS is the crux of what the “climate science” discussion should be about. We can’t explain the natural climate, and we do not have knowledge of all of the forces which impact it, nor enough information of sufficient quality over an adequate period of time to quantify the effects of all of those forces. So suggesting that with all of these open questions we can suddenly deduce a human influence, which must by definition be minuscule compared to natural forces which have caused much greater changes (and at greater rates) in the past, is ludicrous.
But that would be an unemotional discussion of science and that type of discussion does not attract very much grant money. As I suspect, no matter what the truth is, there will always be someone who declares “not it isn’t” and there will always be people ready to donate to that cause or whatever cause they believe will benefit them the most.
In response to Tom in Florida, if it can be proven – as we say we have proven – that official climatology is in formal error, and that that error is significant enough that, if corrected, it leaves no reasonably foreseeable climate crisis, then that is the end of the matter, and no amount of totalitarian bullying will change that.
R Verney, Your point is important to keep in mind. I often forget that the AGW alarmists chose it, thus setting the stage for their success until now. However, for the purposes of the subject of this article, using the 1850 starting point was necessary.
The reality is that this is a war for the soul of the industrialized West and we are discussing which of our awesome tank designs to put into production while the other side is advancing with computerized sticks and stones.
It is politics, there is no supportable science in AGW.
(Comment repeated from above, where WordPress’ eccentric thread-management software placed it): Mr Verney raises the legitimate question why 1850 is taken as the beginning of the industrial era in our calculations. The reason is that anthropogenic influence, though theoretically possible from 1750 on, was negligible before 1850, and we have a global dataset of surface temperature from 1850. As far as possible we have tried to base our result on the available data
” why take the starting point as 1850″
It doesn’t matter. The computation is basically ΔT/ΔF. It could be for any period; the longer the better (hence 1850, though I think 1880 would cut out unreliable data with little loss). The issue is whether you get the same result regardless of period. For the primitive calculation, definitely not. For the modified calculation of Effective Climate Sensitivity, where the denominator is ΔF-ΔQ, Q heat flux into the ocean, there is a better chance.
The slope of ΔT/ΔF plotted out.
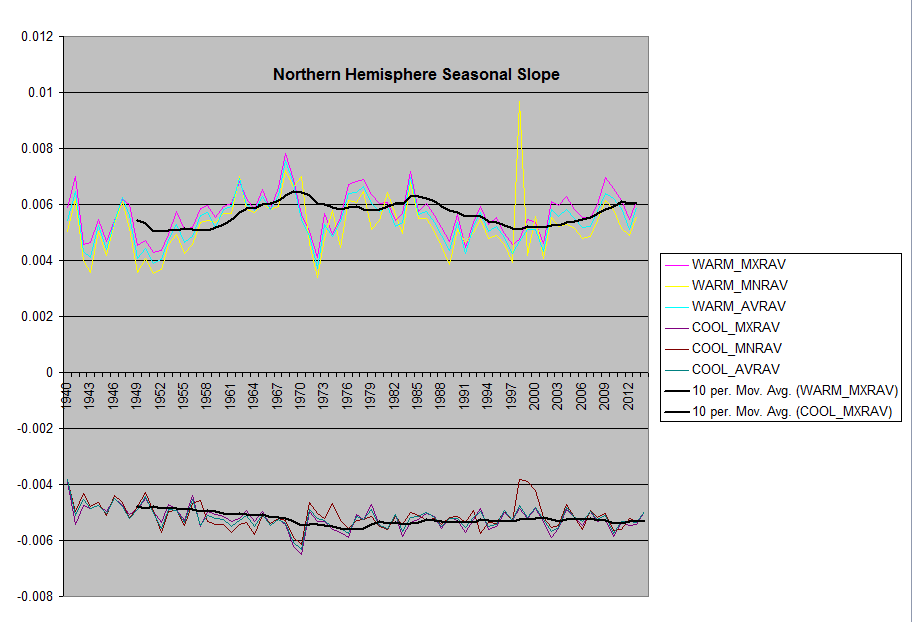


Mr Stokes continues – now, I fear, wilfully – to ignore the fact that we have reached our result by two distinct methods. The theoretical method, based on the period up to 1850, recalculates the feedback fraction, and hence transient and equilibrium sensitivities, on the basis that the large feedback response to emission temperature must not be misallocated and tacked on erroneously to the feedback response to the naturally-occurring, non-condensing greenhouse gases. The empirical method simply compares the direct warming that would be expected from the 2.29 Watts per square meter of net anthropogenic forcing to 2011 (IPCC, 2013, Fig. SPM.5) with the observed warming to 2011, adjusted for the measured energy imbalance to 2010 (Smith 2015). Knowing these two values, one may derive the feedback fraction and then compare it with the pre-1850 feedback fraction.
It is not static. One only has to look at the quiet sun, or at solar insolation variance caused by orbital changes (including tilt variations) to know that the temperature of this planet is not static.
The increase in the output of the sun over time has obviously caused whatever feedbacks to temperature existing in the system, to kick in. As soon as this planet had oceans, there was water vapour feedback since there would always have been water vapour in the atmosphere..
I consider the claims that there was a snowball Earth to be incredulous. There is huge amounts of energy going into the equatorial and tropical oceans, especially if there be less cloudiness to obscure incoming solar irradiance, such that the chance that that region would freeze over is extremely unlikely. Further, it is likely that oceanic currents would in this scenario not move as much heat content polewards rendering even less likely that there would have been a complete snowball Earth.
Mr Titulaer’s comment is most helpful. What is not generally realized is that feedback processes do not care at what point the input signal commenced: they respond to its current amplitude.
The effort required to unravel the errors woven in to the climate models as discussed above reminds me of the following line from my file of tag lines and smart remarks:
http://vps.templar.co.uk/Cartoons%20and%20Politics/NoWindTurbines_3.jpg
🙂
The image for that is http://vps.templar.co.uk/Cartoons%20and%20Politics/NoWindTurbines_3.jpg