STATE OF THE CLIMATE REPORT REVEALS 23-YEAR TEMPERATURE PAUSE IN THE STRATOSPHERE
London 27 March 2018: A new report from the Global Warming Policy Foundation (GWPF) counters media hype over recent warm global temperatures, showing that almost all of the sudden increase in temperatures in the last couple of years was caused by a record strong natural El Nino phenomenon rather than global warming.
The report’s author, Emeritus Professor Ole Humlum of the University of Oslo, also reveals that the atmosphere is still not behaving the way most climatologists say it should.
According to Professor Humlum, “It is clear that temperatures in the troposphere are continuing to diverge from surface temperatures. In other words, they are warming more slowly than global warming theory says they should. The contrast with theory is even more marked in the stratosphere, where temperatures have barely changed for 23 years. We still have much to learn about the climate.”
The GWPF’s State of the Climate 2017 report is a comprehensive review of the global climate, covering land and ocean temperatures, sea ice, sea levels, snow cover and tropical storms.
Among the key findings of the survey are:
- At the end of 2017 the average global surface temperature was dropping back toward levels before the record 2015-16 El Niño episode. This return to pre-El Niño levels underscores that the recent peak in global temperature was caused mainly by this oceanographic phenomenon in the Pacific.
- Since 2003 the average global temperature estimate based on surface weather stations has steadily diverged in the warm direction from satellite-based estimates without a convincing explanation.
- Data from tide-gauges all over the world suggest an average global sea-level rise of 1-1.5 mm/year, while the satellite-derived estimates suggest a rise of more than twice the rate of about 3.2 mm/year. The noticeable difference between the two data sets still has no broadly accepted explanation.
Full report — The State of the Climate 2017 (PDF)

Covered that here:
http://www.newclimatemodel.com/must-read-co2-or-sun-which-one-really-controls-earths-surface-temperatures/
And for the implications see here:
http://joannenova.com.au/2015/01/is-the-sun-driving-ozone-and-changing-the-climate/
I have been saying for four years that we should be looking at TLS for clues about long term change, since there is less climate “noise” and confounding variables. Glad to see it’s getting some traction.
https://climategrog.wordpress.com/uah_tls_365d/
I think the record shows it is clearly related to major volcanic events rather than Stephen Wilde’s solar hypothesis.
Greg,
The volcanic effects are just disturbances in a separate background trend.
“A trend in the opposite direction, towards higher ice extent at both poles, appears
to have begun during 2017, as was predicted in ‘State of the Climate 2016’.”
That’s a tad premature.
I wonder where the missing heat is hiding this time?
Space?
The missing heat is in Michael Mann’s “Wonder Woman” lunch box, in his HOT Spam Sandwich
Nah, it’s in the Sun.
Well, I see only two explanations
1) It deserted, Surely thought this war wasn’t its’, and slipped away at the first opportunity. Because it doesn’t stand the fire…
2) climate captains went through the quite usual practice of listing more soldiers than actually present in their company. And the general reviewing the troops is fine with that, as he, too, wants to show how formidable army this is.
…
AKA : there never was “missing heat” in the first place.
Exactly. That is the problem of adjusting data.
Now nobody knows where the heat went, In fact the heat was never there.
It will be “the deep oceans” again. A laughable claim, but it really is the best they’ve got.
The Sun.
EBAF, energy balanced and filled.
“Despite recent improvements in satellite instrument calibration and the algorithms used to
determine SW and LW outgoing top-of-atmosphere (TOA) radiative fluxes, a sizeable imbalance
persists in the average global net radiation at the TOA from CERES satellite observations. With
the most recent CERES Edition4 Instrument calibration improvements, the SYN1deg_Edition4
net imbalance is ~4.3 W m
-2, much larger than the expected observed ocean heating rate ~0.71 W
m
-2 (Johnson et al. 2016). This imbalance is problematic in applications that use Earth
Radiation Budget (ERB) data for climate model evaluation, estimations of the Earth’s annual
global mean energy budget, and studies that infer meridional heat transports. The CERES
Energy Balanced and Filled (EBAF) dataset uses an objective constrainment algorithm to
adjust SW and LW TOA fluxes within their ranges of uncertainty to remove the inconsistency
between average global net TOA flux and heat storage in the Earth-atmosphere system”
That “objective constrainment algorithm” wat dunnit. Dun buried Mr. Trenberth’s travesty in the ocean, where conveniently, the uncertainty is enormous.
Deep in the Earth.
Deep. Very deep.
That might even not be wrong.
The heat isn’t missing, it never got here. EUV is what heats the stratosphere and results in its expansion or contraction. That’s why the Tiangong space station hasn’t reentered the atmosphere as soon as they thought. The solar activity over the same time period does correlate well with low temperature in the stratosphere.
Olé Ole! a very good report.
From page 18 of the Humlum report at
https://www.thegwpf.org/content/uploads/2018/03/State-of-the-Climate2017.pdf
“It is instructive to consider the variation of the annual change rate of atmospheric CO2 together with the annual change rates for the global air temperature and global sea surface temperature (Figure 16). All three change rates clearly vary in concert, but with sea surface temperature rates leading the global temperature rates by a few months and atmospheric CO2 rates lagging 11–12 months behind the sea surface temperature rates.”
In January 2008 I published that changes in global atmospheric CO2 lag about 9 months behind changes in global atmospheric temperature. I still have the scars on my back for this “climate heresy”, which effectively disproves the myth of catastrophic humanmade global warming. [If you disagree, please show me how the future can cause the past.]
Paper at http://icecap.us/images/uploads/CO2vsTMacRae.pdf
Excel sheet at http://icecap.us/images/uploads/CO2vsTMacRaeFig5b.xls
Humlum et al reached similar conclusions in 2013 here:
http://www.sciencedirect.com/science/article/pii/S0921818112001658
“Highlights:
– Changes in global atmospheric CO2 are lagging 11–12 months behind changes in global sea surface temperature.
– Changes in global atmospheric CO2 are lagging 9.5–10 months behind changes in global air surface temperature.
– Changes in global atmospheric CO2 are lagging about 9 months behind changes in global lower troposphere temperature.
– Changes in ocean temperatures explain a substantial part of the observed changes in atmospheric CO2 since January 1980.
– Changes in atmospheric CO2 are not tracking changes in human emissions.”
Here is a version of Figure 16, from Humlum’s monthly update:
https://www.facebook.com/photo.php?fbid=1551019291642294&set=a.1012901982120697.1073741826.100002027142240&type=3&theater
Global warming alarmists could not be more wrong. These are the true facts, which are opposite to false alarmist claims:
1. CO2 is plant food, and greater atmospheric CO2 is good for natural plants and also for agriculture.
2. Earth’s atmosphere is clearly CO2-deficient and the current increase in CO2 (whatever the causes) is net beneficial to humanity and the environment.
3. Increased atmospheric CO2 does not cause significant global warming – regrettable because the world is too cold and about to get colder, imo.
Regards to all, Allan
MACRAE
Yet another good comment.
Your comments are musts reads,
in my opinion.
However
… I recommended your comments
to someone else, who read them
and complained that you seemed to be
bragging about your prior articles
and papers, and over-confident
… such as by claiming
“These are the true facts”.
I somewhat agree with the criticism.
Except for when you stated:
“the world is about to get colder”
(I don’t know that, and make no predictions
about the future climate, because I believe
it can’t be predicted),
I completely agree with
the three concluding points
in your March 27 4:24 comment …
… but I think the three points
should have be described as:
“My logical data-based conclusions are:”
… rather than the over-confident statement:
“These are the true facts”.
That may seem like nitpicking,
but I think it is important nitpicking,
and I am a professional nitpicker !
My climate change blog:
http://www.elOnionBloggle.Blogspot.com
Richard Greene
Official State of Michigan Nitpicker
since 1977
Hello Richard.
No need to ascribe your question to someone else – ask it yourself. “Am I bragging or complaining?”
Re bragging:
I would appreciate if those who subsequently publish the same allegation (CO2 lags global temperature T by ~9 months in the modern data record) would reference my January 2008 paper in their bibliographies, When they do not, I tend to mention it. My paper also mentions the causative mechanism (dCO2/dt closely tracks T, and its integral CO2 lags T by ~9 months). Here is that dCO2/dt vs T relationship:
http://www.woodfortrees.org/plot/esrl-co2/from:1979/mean:12/derivative/plot/uah5/from:1979/scale:0.22/offset:0.14
You may notice that when someone else (e.g Bill Illis, Christy and McNider) previously published analyses that I later publish, I give them credit.
Re complaining:
The fact that CO2 is proven to lag global temperature T by ~9 months in the modern data record means that climate sensitivity to CO2 can still be a positive number, but must be a very low value, far too low to cause dangerous global warming.
Temperature is probably not the only significant driver of increasing atmospheric CO2 – other drivers such as fossil fuel combustion, deforestation etc. probably also contribute and predominate, but that does not change my argument..
Even if increasing atmospheric CO2 does drive global temperature a finite amount, the clear signal (dCO2/dt vs T) in the data survives, which means that temperature (among other factors) drives CO2 much more than CO2 drives temperature. If this were not true, the aforementioned dCO2/dt vs. T relationship would not be apparent, yet it clearly is.
In summary: Until the future can cause the past, there is NO real global warming crisis. This fact was proved in 2008, and has been largely ignored for ten years, and yes, I am complaining. Why?
Tens of trillions of dollars of scarce global resources have been squandered on the global warming scam, enough money to corrupt countless politicians, government officials and academics. The result has been an avoidable huge increase in electrical costs, the destabilizing of electrical grids due to intermittent wind and solar power, and the suffering and premature deaths of millions due to dysfunctional energy policies.
In addition to the corruption of science, the many trillions of dollars misallocated in the global warming scam could have been used to alleviate enormous human suffering and save millions of lives.
It is long past time that the scientific community stopped this charade, and soundly condemned and ended the ~35-year old global warming scam.
Hi again Richard,
Re your statement re my 2002 prediction of imminent global cooling starting by 2020 to 2030:
“I don’t know that, and make no predictions about the future climate, because I believe it can’t be predicted”.
You may be correct, although I will note that some meteorologists such as Joe A and Joe B at Weatherbell are surprisingly accurate in their long-term weather (not climate) predictions. Others, such as the US National Weather Service, are not that good. Here is one such example:
https://wattsupwiththat.com/2018/02/27/study-chaos-seeding-impairs-the-interpretation-of-numerical-weather-models/#comment-2753714
My (our) 2002 prediction of imminent global cooling was derived from a conversation I had with Paleoclimatologist Tim Patterson of Carleton University, based on his lifelong research. Tim only took a few seconds to answer my question, so he should be given the-benefit-of-the-doubt.
This global cooling prediction is based on the current decline of solar activity, which is contentious because some scholars say the solar activity does not vary enough to impact climate. The empirical evidence from the Maunder Minimum and other solar minimums suggests otherwise – we will soon see.
Regards, Allan
I will confirm. Allan was the very first person to note this lag of the CO2 growth rate to temperature.
Allan, if you have such an air-tight case, why don’t you publish it in the peer-reviewed journals? What good does it do here?
You would, of course, need to show how your argument is better supported than competing arguments, so you would have to do a thorough literature review and understand the other arguments without simply dismissing them. But that is the way science is done. Anyone can say, “These are the true facts,” and list a bunch of opinions. Anyone can say, I don’t believe those arguments because they are politically motivated, and go on to reason through political motivation.
“It is long past time that the scientific community stopped this charade, and soundly condemned and ended the ~35-year old global warming scam.”
You consistently mix science with politics. You are biased, Allan. You see it all through that lens. Who are you to say what is a scam and what isn’t? I’m not attacking you, it’s a valid question. Why is it impossible that the scam lies elsewhere? To consider that question honestly would be the sign of a true skeptic.
No skeptic would assert a list of “True Facts” or dismiss other research without understanding it. That’s denial, the enemy of honest intellectual pursuit. I’m not trying to single you out, this is just something is a lot, a common habit.
“CO2 is plant food, and greater atmospheric CO2 is good for natural plants and also for agriculture”
Even this, that looks so obvious on the surface, has permutations that I don’t think you understand. What do you know about plant physiology and long-term impacts of increased CO2 on the whole diversity of plants, not just as individuals, but as part of ecosystems? That includes what eats them, pollinates them, the water table, nutrient cycling and use…interactions that can’t be boiled down to an easy answer. I don’t know much about climate, but this is something I do know about. And the answer is, no one really knows all the effects of CO2 fertilization in natural communities. They are learning, but it’s a complex issue. Nitrogen appears to play an important part. I won’t go into it here.
What alarmists are “making the opposite claim” and saying increased CO2 is bad for plants? It’s mindboggling.
Kristi – your comments are not worth addressing – you are just arm-waving and bullsh!tting.
Does this look like spurious correlation to you? It is a plot of the rate-of-change dCO2/dt versus global temperature.
http://www.woodfortrees.org/plot/esrl-co2/from:1979/mean:12/derivative/plot/uah5/from:1979/scale:0.22/offset:0.14
Then read Humlum et al 2013.
Do some real work, say something intelligent, and then maybe I’ll comment.
Allan
Is Mauna Loa recognized as the Global CO2 profile ?
The Mauna Loa CO2 profile reflects an atmospheric transport process timing, not the time of CO2 release to the atmosphere. Hence the symmetric nature of the profile.
Appreciate your comments.
Regards
ozonebust asked
“Is Mauna Loa recognized as the Global CO2 profile?”
Answer:
NO, there are many sites globally where CO2 is measured and there is a calculated global average – however , the Mauna Loa CO2 concentrations happen to be close to the global average.
In my Jan2008 icecap.us paper, I used the global CO2 concentrations back to 1980 and both surface temperatures (Hadcrut3 ST) and satellite Lower Troposphere temperatures (UAH5.2 LT).
Note the seasonal amplitude of atmospheric CO2 concentrations range from ~16ppm at Barrow Alaska down to ~2 ppm at the South Pole.
I subsequently reran the same analysis for Hadcrut3 ST’s and Mauna Loa CO2 concentrations back to 1958 and found a similar dCO2/dt vs temperature relationship.
Regards, Allan
Global CO2 – data exists back to 1980
ftp://ftp.cmdl.noaa.gov/ccg/co2/trends/co2_mm_gl.txt
Mauna Loa CO2 – data exists back to 1958
ftp://ftp.cmdl.noaa.gov/ccg/co2/trends/co2_mm_mlo.txt
________________________________
This site includes 99 datasets where CO2 is measured:
https://www.esrl.noaa.gov/gmd/dv/data/index.php?category=Greenhouse%2BGases¶meter_name=Carbon%2BDioxide&frequency=Monthly%2BAverages
“Kristi – your comments are not worth addressing – you are just arm-waving and bullsh!tting.”
No, I’m perfectly serious and my concerns are legitimate. People have no humility these days. It’s as if I thought i could do research on political effects of trade deficits after reading a couple books about Keynesian theory.
Dismissing these concerns as bullshitting only makes them more valid. Dealing with bias is a very important aspect of science. Good scientists are aware of the sources of their own bias. Admitting them is the only way to deal with them. (Unfortunately, some in the “skeptic” community see admission of bias as a bad sign, when it’s the first step to keeping it out of one’s research.)
This is not some trifling issue. It’s about groundless, erroneous assertions made about science with the result that the skeptic community is wasting enormous amounts of time exploring data that has already been explored by those better equipped to know what to do with it. It’s about pseudo-science being accepted as the real thing for political reasons – and because of decades of propaganda. (I know, you say the exact same thing about AGW “alarmists.” Where is the documentation of detailed plans to deceive the public?) .
“Does this look like spurious correlation to you? It is a plot of the rate-of-change dCO2/dt versus global temperature.”
No. So what?
I’ve seen Humlum’s work before. I wasn’t at all impressed, and his research been widely discredited for methodological reasons. Perhaps you should stick to researchers with better reputations in the field if you don’t want to be misled.
Comments from published reviews:
If these results are well-justified then they should surely compel a fundamental scientific shift in paradigms regarding both atmospheric greenhouse warming mechanism and global carbon cycle. However, the presented work suffers from serious logical deficiencies such as, 1) what could be the sink for fossil fuel CO2 emissions, if neither the atmosphere nor the ocean – as suggested by the authors – plays a role? 2) What is the alternative explanation for ocean acidification if the ocean is a net source of CO2 to the atmosphere? Probably the most provocative point of the commented study is that anthropogenic emissions have little influence on atmCO2 concentrations. The authors have obviously ignored the reconstructed and directly measured carbon isotopic trends of atmCO2 (both δ13C, and radiocarbon dilution) and the declining O2/N2 ratio, although these parameters provide solid evidence that fossil fuel combustion is the major source of atmCO2 increase throughout the Industrial Era.
(https://www.sciencedirect.com/science/article/pii/S0921818113001562)
………………………………………………….
We show that these conclusions stem from methodological errors and from not recognizing the impact of the El Niño–Southern Oscillation on inter-annual variations in atmospheric CO2.
https://www.sciencedirect.com/science/article/pii/S0921818113000891
…………………………………………….
Highlights
•
Humlum et al.’s conclusion of natural CO2 rise since 1980 not supported by the data
•
Their use of differentiated time series removes long term contributions.
•
This conclusion violates conservation of mass.
•
Further analysis shows that the natural contribution is indistinguishable from zero.
•
The calculated human contribution is sufficient to explain the entire rise.
https://www.sciencedirect.com/science/article/pii/S0921818113000908
………………………………………
Stumbled on this, too. Only read the abstract, so hard to evaluate it, but it demonstrates that researchers address lag rates and have come to different conclusions.
https://www.sciencedirect.com/science/article/pii/S0921818116301278
Why don’t you do some real work, and read the range of literature available rather than favoring contrarians and dismissing others? How can you make an informed decision? I’ve read plenty of work by contrarian scientists and others who claim to be able to judge climate research (economists, policymakers)… and that’s one reason I go with AGW.
Ozonebust,
If I may add to Allan’s response …
When you mention “the symmetric nature of the profile” I wonder if you may be referring to the annual cycle of atmospheric CO2. Allan’s woodfortrees plot appropriately removes the annual cycle so that the annual growth rate can be seen. You can check this by constructing your own version of his plot (remove the temperature data and the mean and derivative steps, which will then show the annual CO2 cycle, and then add the mean:12 step back in).
It is worth noting that the characteristics of the annual growth rate at Mauna Loa are also seen at other locations. Below I show the equivalent plots for Mauna Loa and South Pole and the synchronous nature of the two datasets is pretty remarkable. There is certainly no evidence of delay between the two, especially for the 1997-1998 El Niño, so the time lag identified by Allan applies equally to both locations.
http://i63.tinypic.com/r04a5e.jpg
Note that my derivation shown here is slightly different to Allan’s in that I use the “raw” monthly data and simply plot the difference between one month and the same month one year earlier: a bit crude but showing essentially the same thing, I believe. Note too, that I am using the Scripps data, available here: http://scrippsco2.ucsd.edu/data/atmospheric_co2/sampling_stations
Please feel free to do your own analysis of the data.
Kristi,
Thank you for your input. I just have two questions for the moment.
You state that “The authors have obviously ignored the reconstructed and directly measured carbon isotopic trends of atmCO2 (both δ13C, and radiocarbon dilution) and the declining O2/N2 ratio, although these parameters provide solid evidence that fossil fuel combustion is the major source of atmCO2 increase throughout the Industrial Era.”
Good point. Please explain why δ13C shows that the incremental CO2 has (and has had) a δ13C of -13 per mil since the LIA.
You then state: “We show that these conclusions stem from methodological errors and from not recognizing the impact of the El Niño–Southern Oscillation on inter-annual variations in atmospheric CO2”. So what am I missing here? ENSO leads to changes in global atmospheric temperatures which leads to changes in rate of growth of atmospheric CO2. I agree, been known for a long time. So what is your point?
‘the skeptic community is wasting enormous amounts of time exploring data that has already been explored by those better equipped to know what to do with it.’
Only according to them.
These are one of those presumptions I’ve asked you to question. These people are activists backing in from a predetermined conclusion. The sources that you cite so trustingly are exactly those that have been corrupted – deliberately so, with agenda in mind. Opponents of these agendas are unerringly black-balled, which is one reason why your ‘published’ and ‘peer-reviewed’ sources favor the company line. This is all documented – Climategate was in no small part about the gaming of the peer-review and publishing process. We also just finished eight years of an administration whose policy on a variety of issues was ‘if the data doesn’t support your position, change the data’ – and they did.
Stop being so afraid. I guarantee you, twenty or thirty years down the line, you’re going to realize that – just like the last twenty or thirty – NONE of these scary scenarios will have come to pass… and there will be a new generation of targeted youngsters being filled with scare stories about some vague point in the future and the real cycle – one of exploitation – will begin again.
“Kristi – your SECOND SET OF comments are not worth addressing – you are just DOING MORE arm-waving and bullsh!tting.”
It is not my job to educate you. You cannot even be bothered to read what I write before you shoot-from the hip with your latest diatribe.
BTW, the critiques that you quoted of Humlum et al from Science Direct are nonsense – the usual religious dogma from the Church of Latter-Day Global Warming.
Jim Ross, Joel Snider and Bill Illis – thank you for your excellent comments.
ALLAN MACRAE March 27, 2018 at 9:09 am [blockquote]Tens of trillions of dollars…[/blockquote]
Really? Tens of trillions? May I call your attention to Willis’ recent post entitled “Congenital Innumeracy”. Whilst I agree with the sentiment, I question whether the expenditure is really quite that high.
TomB – did you bother to check any numbers before you wrote your comment?
My understanding is that over a trillion dollars are squandered on global warming nonsense every year now, mostly on green energy schemes that are not green produce little useful (dispatchable) energy. Global warming alarmism is now over 30 years old, so tens of trillions it is.
If you have better information, please post it. Be sure to include the huge 24/7/365 direct and indirect subsidies to wind and solar power that are provided to make them appear more economic, all at public expense.
Allen, that was a very important observation that dCO2 is in phase with surface temps. However, it dues rather brush over the underlying rise in CO2 and SST which is behind the short term variations. The phase shift of circa 9mo, is just one aspect and relates to the main short term periodicity left when the annual cycle has been correctly filtered out.
There is a similar correspondence between dCO2 and SST but with a lesser scaling factor. This may be consistent with a similar effect on longer periods with a different ( lesser ) scaling. That again could be tied in to a relaxation to equilibrium which will have different scaling on different timescales.
Much more effort is needed in characterising this kind of relationship to correctly asses the amount of human emissions which are absorbed and how much remains as elevated atm CO2.
Filtering out the short term periodicity which gives rise to 9mo lag shows a similar correlation at longer timescaled.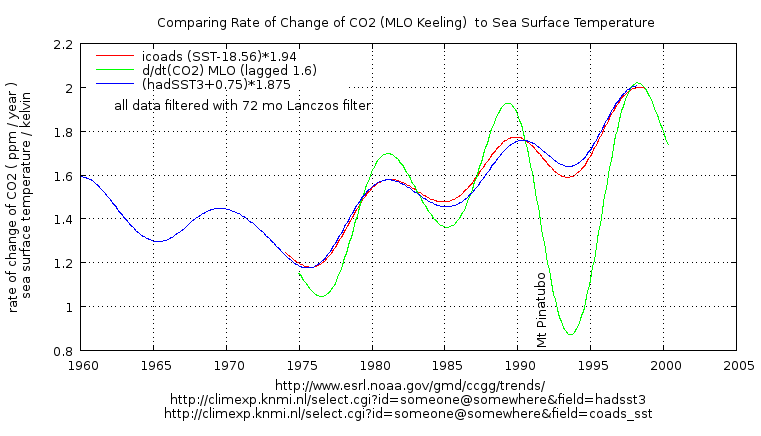
Higher derivatives gives similar information and allow estimation of the scaling for longer periods.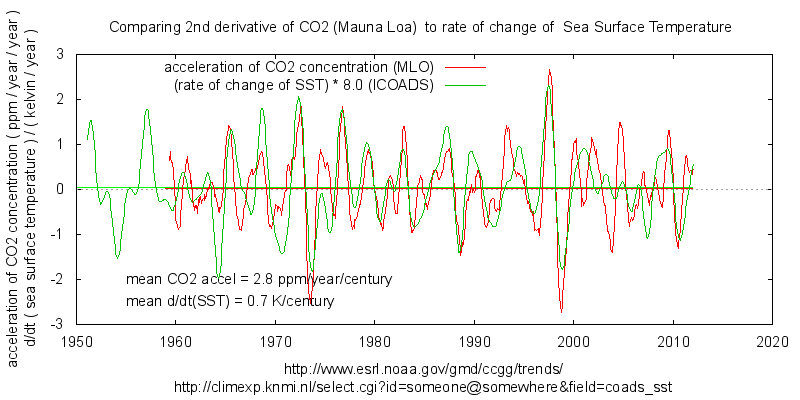 https://climategrog.wordpress.com/d2dt2_co2_ddt_sst-2/
d2/dt2(co2) vs d/dt(SST)
oops lost the graph:
Thank you Greg – I have not time now, but will try to review your comments and respond later.
One observation – maybe you are saying the same thing:
The total lag of atmospheric CO2 after tropical Pacific SST (Nino34 area) is close to 12-13 months. Global atmospheric temperatures lag Nino34 SST by ~4 months, and atm. CO2 lags LT temperatures by ~9 months.
Humlum says 11-12 months – close enough.
Hi again Greg,
It is early here – pre-coffee.
Your plots of dCO2/dt are similar to mine in my 2008 paper, with a few minor changes in details.
As I recall, Bill Illis described the initial part of the mechanism:
Tropical Pacific SST’s increase tropical humidity and increase tropical atmospheric temperatures 3 months later (and global temperatures one month thereafter).
Then my 2008 paper discusses this latter part:
The huge seasonal CO2 flux, which includes seasonal photosynthesis/decay and ocean exsolution/solution of CO2, shows dCO2/dt changing ~contemporaneously with the average global temperature anomaly, and CO2 trends changing ~9 months later.
I agree with you that this entire huge CO2 flux equation needs more study, Some parties are certain that their “mass balance argument” is correct, and that they understand all the major components of the seasonal CO2 flux to an adequate degree of accuracy. The discussions between Richard S Courtney and Ferdinand Engelbeen on wattsup and elsewhere were interesting. I am sitting back and waiting for the satellite CO2 data to be more fully analysed and understood.
I do not expect this further understanding of CO2 fluxes will make any material changes in the observed lag of atmospheric CO2 after sea surface temperatures, land surface temperatures and lower tropospheric temperatures.
Regarding your higher derivatives [d2/dt2(co2) vs d/dt(SST)], I need more time to independently recreate and review this aspect. Your wordpress link on this point did not work for me.
Regards, Allan
Refreshing to see some actual climate study based on real-world observations instead of the endless parade of hypothesized BS and models. And which confirms, rather than flies in the face of, historical climate information which shows absolutely no CO2 effect on temperature.
As I like to put it, “Observation TRUMPS theory.” 😀
Your observations of sync-lagging also seems compatible with Stephen Wilde’s UV v Ozone regulated topopause pumping —> jetstream-wander model. Interesting observations, tah.
The Global Warming Policy Foundation (GWPF) has produced a string of excellent summary reports. There is nothing comparable produced by the establishment climate alarmists, who mainly produce junk “science”.
Philip B wrote:
“The Global Warming Policy Foundation (GWPF) has produced a string of excellent summary reports. There is nothing comparable produced by the establishment climate alarmists, who mainly produce junk “science”.”
I agree with you Philip – the GWPF has produced excellent work, and the climate alarmists have produced unscientific nonsense.
Global warming alarmist hysteria has reached a fever pitch, as the world cools as it recovers after the recent huge El Nino – see my above post after it clears moderation.
My big question is whether we will see even further global cooling, not as a result of recovery from the El Nino, but as a result of declining solar activity in SC24 and SC25.
I (we) predicted this global cooling to start by 2020-2030, in an article published on September 1, 2002, and it remains my only prediction that has not yet materialized.
We wrote in another 2002 article that there was no real global warming crisis, and that the alternative energy technologies supported by the alarmists would fail to replace fossil fuels. I believe that both these predictions have now proved correct, for anyone who remains objective and adheres to the scientific method and rational economic analysis.
Tens of trillions of dollars of scarce global resources have been squandered on the global warming scam, enough money to bribe countless corrupt politicians, government officials and academics. The result has been an avoidable huge increase in electrical costs, the destabilizing of electrical grids due to intermittent wind and solar power, and the premature deaths of millions due to dysfunctional energy policies and the misallocation of trillions of dollars that could have been used to improve lives and alleviate human suffering.
Regards, Allan
“the misallocation of trillions of dollars that could have been used to improve lives and alleviate human suffering. ”
Yep , that’s worst of all this BS. the amount of important things that could have been achieved instead of being squandered on false problems based on bigotry and zealous misplaced dogma.
Agreed. And not like it’s the first time. ::cough:: DDT ban ::cough::
I detest junk science.
AGW is not Science:
You might find this post of interest – on the Ban of DDT and the related Increase of Malaria.
[excerpt]
“I want to personally recognize the radical environmental movement for the key role it played in the banning of DDT and the resulting deaths of millions of people from malaria, especially children under five years of age. After this holocaust became fully apparent, many enviros continued to oppose DDT, based on flimsy evidence and unsupported allegations.”
https://wattsupwiththat.com/2018/03/22/kim-stanley-robinson-empty-half-the-earth-to-save-the-planet/comment-page-1/#comment-2772656
Allan, DDT has not been universally banned. It is still used in malaria control.
Not before the deaths of hundreds of millions. Claims otherwise are simply apologist crap.
Kristi wrote:
Allan, DDT has not been universally banned. It is still used in malaria control.
Kristi -DDT it was effectively banned for 30 years from 1972 to 2002. You did not read my post at
https://wattsupwiththat.com/2018/03/22/kim-stanley-robinson-empty-half-the-earth-to-save-the-planet/comment-page-1/#comment-2772656
[excerpt]
Below is a graph that quantifies the number of DEATHS EACH YEAR FROM MALARIA – between one and two million.
Note how malaria deaths increased steadily since 1980 (or earlier), after the banning of DDT in 1972, and how malaria deaths declined after DDT was re-introduced.
See the red area of the graph – that is CHILDREN UNDER 5 YEARS OF AGE – FOUR AND UNDER – JUST BABIES FOR CHRIST’S SAKE! Yes I am upset. This holocaust was preventable, and easily so.
https://www.facebook.com/photo.php?fbid=1566107003466856&set=a.1012901982120697.1073741826.100002027142240&type=3&theater
[end of excerpt]
Reprise:
See the red area of the graph (above) – that is THE NEEDLESS DEATHS OF MILLIONS OF CHILDREN UNDER 5 YEARS OF AGE DUE TO THE 1972 BAN OF DDT – CHILDREN FOUR AND UNDER – JUST BABIES FOR CHRIST’S SAKE!
This holocaust was preventable, and easily so. And yes, I am still upset.
When they banned DDT, the enviro-alarmists caused the needless deaths of tens of millions of people, mostly children 4 and under.
The banning of DDT in 1972 was based on lies – false, exaggerated science and false politics – the politics of “feel good” rather than “do good”, what we now call “virtue signaling”.
And the parallels of the 30-year DDT ban to global warming alarmist falsehoods are obvious. The global warming scam is now more than 30 years old, and is starting to unravel, as it becomes more and more obvious to the average person that the world is not getting dangerously warmer, despite rising CO2.
Well-educated, objective scientists knew that global warming was a false crisis in the 1980’s, and when they spoke out against warmist lies they were persecuted in an organized attack by leftist thugs. The corruption of major scientific organizations, of major scientific journals and of science itself is unprecedented in modern times.
It is long past time to bring science back into the realm of objectivity and truth – it is long past time to restore the scientific method.
Not global, but it bears a remarkable resemblance to Lysenkoism in the old SU.
Two more actual scientists who apparently didn’t get the memo that the science is “settled.”
Science is never “settled”. When a person claims this it shows they don’t have an argument, because such a claim is merely a rearrangement of “shut up” – which always indicates the person cannot defend their position.
The Scientific Method rejects science as “settled”, only that a hypothesis has not yet been rejected.
As I have said all the basic premises AGW theory has been founded on have failed to come true from the lower tropospheric hot spot , to a more +AO/NAO, to a decrease in OLR, and now it looks like the stratospheric cooling is not happening.
When the basic premises a theory is built upon fail ,I would say the theory has failed.
Yet this lives on.
not if you are playing ‘heads you lose , tails I win’ which means everything can be take as ‘proof’ and nothing can disprove your claim . it is not science but then this is not a question of science in the first place.
Nothing fails it more than…why does it stop
Every time CO2 levels have been high…..temp and CO2 crashed
That one fact fails their entire theory
I agree. No correlation between CO2 and temperature at all on geologic time scales (Geocarb reconstructions), and temperature driving CO2 on shorter time scales (ice core reconstructions), with temperatures beginning their RISE when CO2 is at its LOW point and starting to FALL when CO2 is at its HIGH point, all of which adds up to CO2 isn’t “driving” jack sh!t. Never has, isn’t now, and never will.
Heat drives CO2
HCO3- + HEAT = OH – + CO2
First smoke from a boiling kettle.
Simple if you know that there giga tons of bicarbonates in the oceans…
Exactly, every sharp global temp plunge into the next glacial, occurs even as CO2 is holding consistently high, and CO2 falls only hundreds of years after the cold climate is already iceing up the Earth, for centuries already.
I wonder why this single damning observational fact is continually ignored?
Well, because it falsifies the whole CO2 greenhouse debarcle, at a glance.
But we’ll just all agree to ignore the obvious falsification of both AGW, and also the “CO2 as climate-driver” theories, and slog on with the hysteria and alarmism agendas instead.
Yeah? … and to what end?
Anyone pushing ‘AGW’, or “CO2 as climate-driver” theory, is a fraud, a liar, a subverter of science, politics, economy, society and civilisation.
“Yet this lives on.”
It’s a zombie.
This is why they invented “extreme weather”, and have to keep pounding on peripheral issues supposedly caused by “climate change”. Most of these “issues” are either greatly exaggerated or non-existent, except in the over-active imaginations of Warmists. With the Pause coming back longer than before, they will once again be trying to first deny that it exists, then trying to “explain” it away. Popcorn time.
Or adjust the historical temperatures once more.
The Earth constantly wants to send the heat absorbed from the Sun into outer space.. constantly. The whole climate debate is about what are the mechanisms that retard or delay this?
Unfortunately for the AGW crowd, they have their entire argument based on just one: CO2, which really doesn’t make a lot of sense anyway when you look at all the other mechanisms in place that interact with each other. Throw in the oceans and cyclic changes in the Sun and it even makes less sense.
So we get to the up is down and down is up arguments as the last gasp of the insanity is coming to an end.
I suspect that should be “Most of these “issues” are greatly exaggerated because the Warmists’ salaries depend on keeping the climate change sc@m going”.
Indeed a lot of piggies are riding on the back of AGW , like the IPCC, without it their world would ironically be a lot colder .
I suggest they re-program their models or fudge the input, However, their output won’t be any closer to reality, but, it may help them fee
l a little better about their failure.
“Major AMO peaks occurred in around 1875, 1942 and possibly also around 2010 (Figure 30).”
Major AMO peaks in 1998, 2010, and 2016, following stronger El Nino episodes.
We also had a fairly large AMO peak the last half of last year which has now significantly declined. I believe both October and December were monthly record highs.
https://www.esrl.noaa.gov/psd/data/correlation/amon.us.data
“We still have much to learn about the climate.”
True dat.
Although AGW is highly exaggerated I think it’s deceiving to say that the recent warming is only due to El Nino, it’s just wrong. The 1998 El Nino was of the same magnitude, there has been significant warming between between the El Nino peaks, 1998-2016. Denying this only shows that you are as bad as the alarmists.
I does appear that the warming ended almost immediately after the 1998-2001 ENSO activity.
http://www.woodfortrees.org/plot/hadsst3gl/from:2014/to/offset:-0.3/plot/hadsst3gl/from:2001/to:2014/offset:-0.3/plot/hadsst3gl/from:2001/to:2014/trend/offset:-0.3
Keep in mind it’s too early to tell if we will have a similar jump in temperature this time. But for now it appears there’s a long pause in SSTs when ENSO is factored out.
I will probably show my ineptitude, but if you are comparing two peaks on a chart such as UAH, to me, that’s comparing weather. If you integrate and look at areas under the curve, that’s tending toward climate as the time frame is expanded. We should wait for the latest El Nino to work itself out before determining if “significant” (and I was taught to not use the word “significant” unless in a statistical sense) warming has occurred since the the mid 90s. The wait should not last much longer.
I should add an appropriate regression analysis for determining a trend.
What warming? 1995 to about 2016 was the time of the great pause.
THE COMING COOLING.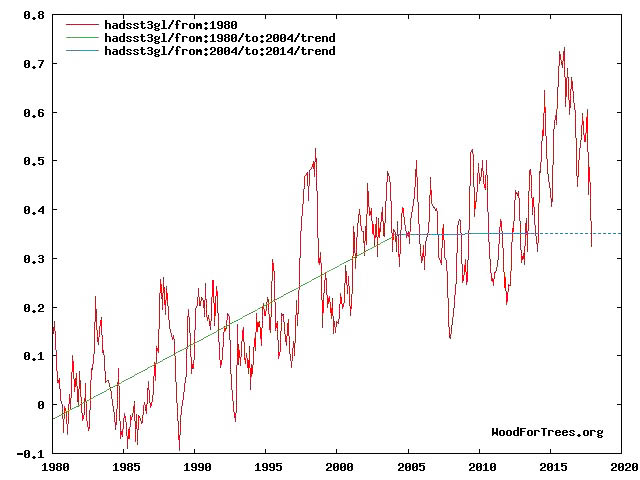

The latest hadsst3 data shows global sst temperatures are now below the pre El Nino trend.
Fig 1. RSS trends showing the millennial cycle temperature peak at about 2004 (14)
Figure 1 illustrates the working hypothesis that for this RSS time series the peak of the Millennial cycle, a very important “golden spike”, can be designated at 2003
The RSS cooling trend in Fig. 1` was truncated at 2014 because it makes no sense to start or end the analysis of a time series in the middle of major ENSO events which create ephemeral deviations from the longer term trends. By early 2018, the strong El Nino temperature anomaly had declined rapidly. The cooling trend is likely to be fully restored by the end of 2019.
Climate is controlled by natural cycles. Earth is just past the 2004+/- peak of a millennial cycle and the current cooling trend will likely continue until the next Little Ice Age minimum at about 2650.See the Energy and Environment paper at http://journals.sagepub.com/doi/full/10.1177/0958305X16686488
and an earlier accessible blog version at http://climatesense-norpag.blogspot.com/2017/02/the-coming-cooling-usefully-accurate_17.html
Here is the abstract
“ABSTRACT
This paper argues that the methods used by the establishment climate science community are not fit for purpose and that a new forecasting paradigm should be adopted. Earth’s climate is the result of resonances and beats between various quasi-cyclic processes of varying wavelengths. It is not possible to forecast the future unless we have a good understanding of where the earth is in time in relation to the current phases of those different interacting natural quasi periodicities. Evidence is presented specifying the timing and amplitude of the natural 60+/- year and, more importantly, 1,000 year periodicities (observed emergent behaviors) that are so obvious in the temperature record. Data related to the solar climate driver is discussed and the solar cycle 22 low in the neutron count (high solar activity) in 1991 is identified as a solar activity millennial peak and correlated with the millennial peak -inversion point – in the RSS temperature trend in about 2003. The cyclic trends are projected forward and predict a probable general temperature decline in the coming decades and centuries. Estimates of the timing and amplitude of the coming cooling are made. If the real climate outcomes follow a trend which approaches the near term forecasts of this working hypothesis, the divergence between the IPCC forecasts and those projected by this paper will be so large by 2021 as to make the current, supposedly actionable, level of confidence in the IPCC forecasts untenable.””
For the longer range forecast Fig 12 from the link above.
Fig. 12. Comparative Temperature Forecasts to 2100.
Fig. 12 compares the IPCC forecast with the Akasofu (31) forecast (red harmonic) and with the simple and most reasonable working hypothesis of this paper (green line) that the “Golden Spike” temperature peak at about 2003 is the most recent peak in the millennial cycle. Akasofu forecasts a further temperature increase to 2100 to be 0.5°C ± 0.2C, rather than 4.0 C +/- 2.0C predicted by the IPCC. but this interpretation ignores the Millennial inflexion point at 2004. Fig. 12 shows that the well documented 60-year temperature cycle coincidentally also peaks at about 2003.Looking at the shorter 60+/- year wavelength modulation of the millennial trend, the most straightforward hypothesis is that the cooling trends from 2003 forward will simply be a mirror image of the recent rising trends. This is illustrated by the green curve in Fig. 12, which shows cooling until 2038, slight warming to 2073 and then cooling to the end of the century, by which time almost all of the 20th century warming will have been reversed
Latest Southern Oscillation Index values
https://www.longpaddock.qld.gov.au/soi/
Dr. Page,
I must say, that line on your first chart is a truly impressive example of cherry picking. Referring to the chart, might want to compare your imagined current descent into cooling to what occurred around 2007 relative to 1998 and in the nine years that followed.
Slipstick All scientific interpretations are cherry picked to illustrate the authors hypotheses.

I pick mine to illustrate the solar driver – temperature relationships,based on the correlation between the solar activity 1991 peak ( low in the in the gamma ray count) and the 2004+/- sst trend change .There is a 12/13 year delay in the temperature change because of the thermal inertia of the oceans.
As I said above “The RSS cooling trend in Fig. 1` was truncated at 2014 because it makes no sense to start or end the analysis of a time series in the middle of major ENSO events which create ephemeral deviations from the longer term trends. ” A trend from 1998 – 2007 is meaningless.
Here is another Humlum Figure showing the millennial turning point very nicely.
It took longer to get to this level than it historically has done so. Maybe a whole year late. But then, we don’t really know what is going on with temperatures anymore. They are mucking around with it so much right now that no one knows anymore. Just look in your backyard instead.
Satellite and surface station trends diverge because the latter are cooked books.
Interesting. Coincidentally?, I have calculated from various different parameters that 1995 is the date where the sun reached its maximum output in terms of the 87 year GB cycle…
Hi Stephen!
1. I have had a look at your work at JoNova’s blog, and am impressed. However, you and Kristian disagreed in some of the Comments, and I would like to resolve those difficulties. Internal energy of a gas is basically composed of the translational and rotational kinetic energies of the individual gas molecules (quantum jumps between vibrational energy levels are high enough that at 288 K or lower, almost all gas molecules are frozen in the lowest vibrational state). This is unchanged if the gas is physically lifted up in the Earth’s gravitational field (Kristian is right on this point). By the Law of Equipartition of Energy, each degree of freedom would acquire RT/2 per mole of gas. For 3 translational and 2 rotational degrees of freedom for a linear molecule (e.g. N2, O2, CO2), this means internal energy would be 5RT/2 per mole, or 5kT/2 per molecule, where Boltzmann’s constant k is equal to the Ideal Gas Constant R divided by Avogadro’s Number (the number of particles in a mole).
2. However, as altitude increases, pressure decreases, so volume increases (Boyle’s Law). The work done in expansion means temperature of the gas would decrease. To understand this, imagine a flat plastic freezer bag containing molecules considered as point particles with a certain internal energy. As the molecules collide with the internal walls of the bag, they push outward, expanding the volume of the bag. At constant pressure P, the work done in creating a volume of dV would be PdV, and at final volume V, the work done would be PV. For an Ideal Gas, PV = RT for one mole (n=1), so the enthalpy (heat content, H) is 7RT/2 per mole, or 7kT/2 per molecule for linear molecules like N2, O2 and CO2. Enthalpy (heat content) includes the RT needed to warm up the contents of the freezer bag to temperature T at constant pressure P.
3. The heat capacity at constant pressure, Cp is the derivative of H with respect to T. I.e. Cp = 7k/2 per molecule for linear molecules. See https://en.wikipedia.org/wiki/Heat_capacity for more details.
4. In the Earth’s troposphere, gas molecules also possess gravitational potential energy U = mgh , where g is the acceleration due to gravity, and h is the altitude.
5. If no heat is added to gas molecules from an external source (i.e. change is adiabatic), then as gas molecules rise in altitude, they must decrease in enthalpy (heat content). I think this is your argument, Stephen, although you confused enthalpy with internal energy (this is the point at which second year university students taking Physical Chemistry get lost and tune out). I.e. dU/dh = – dH/dh .
6. By applying the Chain Rule for derivatives, dH/dh = (dH/dT)(dT/dh) , and when one substitutes for U=mgh and H = 7kT/2 , one can readily derive the dry adiabatic lapse rate of -9.8 K/km (we have not included water vapour). See https://en.wikipedia.org/wiki/Lapse_rate .
7. By including the heat absorbed by greenhouse gases in the troposphere, I can derive the observed lapse rate of -6.8 K/km to within 2% accuracy (email me at rtaguchi@rogers.com and I can send you pdf files).
8. Both dry adiabatic and observed lapse rates show that temperatures decrease linearly with increased altitude due to decreasing H as altitude h increases. Greenhouse gases decrease the rate of cooling, but are not the CAUSE of decreasing temperature (the global warming literature is wrong on this point).
9. Ozone molecules created by incoming Solar UV radiation in the stratosphere absorb some UV wavelengths strongly, and during inelastic collisions with air (N2 and O2) molecules, excited ozone molecules transfer energy to translational and rotational modes of the departing molecules. I.e. the stratosphere warms up.
10. BTW, this is the same mechanism by which a tiny (0.04%) concentration of CO2 molecules and water vapour molecules absorb infrared (IR) energy emitted from a warm solid and liquid surface of the Earth, and transfer energy to N2 and O2 which as non-polar molecules cannot and do not re-emit any significant IR to outer space. So the troposphere warms up (the greenhouse effect). The energy imbalance caused by net tropospheric absorption means that the same incoming Solar visible radiation warms up the solid and liquid surface of the Earth until the T^4 Stefan-Boltzmann law restores energy balance, at a slightly higher surface temperature. Yes, the CO2 and water vapour molecules also store enthalpy (heat content), but N2 and O2 outnumber CO2 by 1,000,000:400 = 2500:1, so they store 2500 times the enthalpy as CO2 (since the heat capacities per molecule are the same 7k/2).
11. As the stratosphere warms up (during your Active Sun phase), expansion downwards causes the troposphere to fall. So the rest of your theory follows. I’m not sure if more or less ozone in the mesosphere is important in explaining the greenhouse effect in the troposphere and stratosphere.
12. BTW, IMO the general circulation of major currents is explained by the centrifuge effect and the Coriolis Effect. The rotating Earth is a centrifuge, so warm, less dense surface water at the Equator is driven toward the poles. But in the Northern Hemisphere, the Coriolis Effect deflects this motion to the right. This explains the flow of the Gulf Stream and the Japan Current (Kuro Siwo). In the Southern Hemisphere, the Brazil Current flows from Equator southward, but is deflected to the left. As water is relatively incompressible, these flows must be balanced by flows of cold water in the opposite direction. This explains the southward California Current which is deflected to the right, producing an overall clockwise rotation of surface water in the Northern Pacific. Similarly in the Northern Atlantic, the Canary Current completes the clockwise circulation of surface waters. In addition, dense cold Arctic salt water is driven by the centrifuge southward toward the Equator, with the Coriolis Effect deflecting the flow until it hugs the eastern coast of North America.
13. In the Southern Hemisphere, deep cold water is driven toward the Equator by the centrifuge, creating the upwelling Peru (Humboldt) Current in the Southern Pacific and the Benguela Current in the Southern Atlantic. Both of these are deflected to the left to complete the circulations. The upwelling Humboldt Current brings up nutrients from the deep which increases the plankton and the anchovies, etc.
14. The remaining mystery is what causes the reversal of flow during El Nino events. I speculate that somehow the islands near New Zealand, Fiji, New Guinea, etc. (which represent only the high points of underwater mountains) create resistance to southward flow by the centrifuge effect (which varies as the sine of 2 times the latitude, so is zero at the Equator, and maximum at latitude 45 degrees). So the cold Humboldt current waters (which decrease the overall surface temperature of the Earth) warms up at the Equator, moves westward, but piles up near the islands. Eventually when the height is high enough, the pendulum swings back, reversing the flow of Equatorial waters during El Nino events. The damping of the cold Humboldt Current waters means the Earth’s mean temperature goes up, heralded as proof of global warming by the Climate Change activists.
15. These general principles also explain the path in Tornado Alley (low pressure cells are driven northward by the centrifuge, but deflected to the right in the flat central plains of North America where we can ignore the effect of mountains). Ditto for hurricanes, which move westward when near the Equator, but then are deflected northward and to the right in the Northern Atlantic.
Sharp-eyed critics, of course, are welcome to knock holes in any specific argument, but I hope this general overview helps.
Wow Roger, did writing this make you late for work?
Oops, in my point 11, “troposphere” should read “tropopause”.
Put simply, null hypothesis proven. CO2 up, temperature not.
rogertaguchi
If you define enthalpy as a decline in heat content then your interpretation of my point is correct. Internal energy being the sum total of KE and PE at any given height remains the same throughout
Note though that the active solar phase reduces warming of the stratosphere above the poles by increasing the ozone destruction process. That is the opposite of the consensus view but is supported by recent observations above 45km when it was seen that a less active sun caused warming in the stratosphere above that height by decreasing the ozone destruction process when the consensus expected cooling.
The so called greenhouse effect is actually created by atmospheric mass conducting and convecting and not by GHGs but there are a lot of contributors here who cannot accept that.
The opposite sign ozone response in the mesosphere is necessary to match observations of reducing polar ozone and falling stratospheric temperatures when the sun is active with more polar ozone and rising stratospheric temperatures when the sun is less active.
Consensus science expects the opposite but is therefore incompatible with observations unless one introduces an alternative hypothesis which was of course done with CFCs as the proposed cause of the decline in ozone over the poles when the sun was active.
I think that was an error and it was actually solar activity levels altering the balance of ozone creation/ destruction after all which is why the stratosphere stopped cooling as the level of solar activity declined towards the end of cycle 23.
If the recent stratospheric warmings (the most recent has been very powerful) continue to occur and/or intensify so as to push more polar air more often into middle latitudes whilst the sun remains quiet then that would serve as proof of my hypothesis.
“pause in stratospheric temperature” If the pause is recognized then we obviously acknowledge the trend itself. We have to realize that something is happening.
Indeed. Like large stratosphere injecting eruptions altering ozone based two-way radiative diffusion . Followed by tropospheric adjustment over about half a decade or so.
I wonder where the El Nino gets the heat that it releases periodically. Anyone know? Subterranean magma?
Accumulated heat from t he sun?
JimB
Texasjim
When in doubt,
global warmunists
always claims the heat
‘is hiding at the bottom of
the oceans’, suggesting
some link with CO2,
which is nonsense.
A good explanation
for El Nino’s source of heat
— maybe from
the core of the Earth,
or from underseas volcanoes,
or from the sun,
or some combination ?
Your guess is as good as mine.
The sun, obviously. Core of the Earth and volcanoes are several order of magnitude smaller than the sun (Watts versus kilowatts).
Admirable summary, Roger. However…
In your point 10, you say ” So the troposphere warms up (the greenhouse effect)”
Does this mean you predict a tropical troposphere “hot spot” that millions of radiosondes and weather balloons have somehow failed to observe?
Hi Lance! 1. No, there is no tropical “hot spot” at mid-altitudes because the net absorption/warming occurs throughout the troposphere.
2. Convection currents and winds also transport heat from hot regions to cold more efficiently than radiation (absorption followed by emission followed by absorption, etc. between greenhouse gases) alone.
3. The literature explanation of complete absorption followed by complete emission (by Kirchhoff’s Law) applies only to central CO2 frequencies (around 667 cm^-1), resulting in the “220K” emission from the stratosphere that truncates what would otherwise be a 100% net absorption (i.e. zero emission) ditch in the IR spectrum recorded by satellites looking downward. Note that the literature explanation at these central frequencies means that when CO2 is doubled, the layer of final emission to outer space occurs at higher altitudes, which in the stratosphere means at higher emission temperatures. For energy balance, this means that less emission is needed from the Earth’s surface, i.e. this would mean global cooling at the surface which is of interest to us all.
4. The reason there is a 220K emission truncation comes from the Schwarzschild Equation, which states that the Signal observed by the satellite = Io.exp(-KCL) + B[1 – exp(-KCL)] , where the first term Io.exp(-KCL) is attenuated signal after Beer-Lambert absorption and B[1 – exp(-KCL)] is the emission term.
5.(a) If attenuation is zero, exp(-KCL) = 1, and Signal = Io, the emission from the 288 K solid and liquid surface of the Earth, so all of the photons emitted by the surface escape through the atmospheric “window” to outer space.
(b) If absorption is 100%, attenuation is complete, so exp(-KCL) = 0, and Signal = B, the emission from 10 km or above, where the optical density decreases enough for the photons to escape to outer space.
(c) If exp(-KCL) is between 0 and 1 in the entire 10 km path length of the troposphere, it can be understood as transmittance, which can be replaced by (1-A), where A is the absorbance. Then the Schwarzschild Equation becomes Signal/Io = 1-A + (B/Io)A = 1 + (B/Io – 1)A . Since CO2 667 cm^-1 absorption peaks near the peak emission of 288 K Planck black body emission, B/Io can be approximated by (220/288)^4 = 0.341.
This means the Schwarzschild Equation becomes Signal = 1 – 0.659A , which is a modified form of Beer-Lambert transmittance/absorbance, with A replaced by 0.659A to account for the emission term. This is net absorption, as any competent chemist can tell you, not net emission from a layer in the troposphere (at 5 km, for example). The literature is all wrong on this point. Chemists usually ignore the emission term, because a lab spectrometer uses a hot black body to provide the initial radiation Io, and B (the emission from room temperature) is negligible. However, for the greenhouse effect, Io is the emission from a 288 K black body, and for the first few km B/Io will be close to 1 (i.e. B is not negligible). The Signal for these partially attenuated frequencies essentially escapes to outer space at 10 km, because from 10 to 20 km there is little temperature change for most of the Earth, so there is no change in transmittance or absorbance as the density steadily decreases to the point where the photons escape unmolested to outer space.
6. The net absorption at frequencies that are only partially absorbed is greater in magnitude than the extra emission from the stratosphere at central CO2 frequencies, so doubling CO2 means a net absorption overall, a throttling of IR escaping to outer space. For energy balance, the emission from the Earth’s solid and liquid surface must increase (caused by the unchanging incoming Solar visible radiation). This explains the greenhouse effect for the surface.
If the surface had actually warmed it would be inconsistent with the AGW hypothesis without the predicted water vapor rise and the upper atmosphere warming. They should not be twisting the surface data into knots until the inter-hypothesis data can be tortured to fit their paradigm first
But….
The troposphere has not warmed quite as fast as most climate models predict. Note that this problem has been reduced by the large 2015-2106 El Nino Event, and the updated version of the RSS tropospheric datasets.
http://images.remss.com/figures/climate/RSS_Model_TS_compare_globev4.png
https://climateaudit.org/2017/11/18/reconciling-model-observation-reconciliations/
The recent El Nino was not the strongest one on record according to all ways of measuring it.
https://wattsupwiththat.com/2015/11/17/is-the-current-el-nino-stronger-than-the-one-in-199798/
Much of the energy from the recent El Nino was outside the regions typically used to measure El Ninos.