From NASA Goddard:
Sea ice in the Arctic grew to its annual maximum extent last week, and joined 2015, 2016 and 2017 as the four lowest maximum extents on record, according to scientists at the NASA-supported National Snow and Ice Data Center (NSIDC) and NASA.
On March 17, the Arctic sea ice cover peaked at 5.59 million square miles (14.48 million square kilometers), making it the second lowest maximum on record, at about 23,200 square miles (60,000 square kilometers) larger than the record low maximum reached on March 7, 2017.
More significantly from a scientific perspective, the last four years reached nearly equally low maximum extents and continued the decades-long trend of diminishing sea ice in the Arctic. This year’s maximum extent was 448,000 square miles (1.16 million square kilometers) — an area larger than Texas and California combined – below the 1981 to 2010 average maximum extent.
Every year, the sea ice cover blanketing the Arctic Ocean and surrounding seas thickens and expands during the fall and winter, reaching its maximum yearly extent sometime between late February and early April. The ice then thins and shrinks during the spring and summer until it reaches its annual minimum extent in September. Arctic sea ice has been declining both during the growing and melting seasons in recent decades.
The decline of the Arctic sea ice cover has myriad effects, from changes in climate and weather patterns to impacts on the plants and animals dependent on the ice, and to the indigenous human communities that rely on them. The disappearing ice is also altering shipping routes, increasing coastal erosion and affecting ocean circulation.
“The Arctic sea ice cover continues to be in a decreasing trend and this is connected to the ongoing warming of the Arctic,” said Claire Parkinson, senior climate scientist at NASA’s Goddard Space Flight Center in Greenbelt, Maryland. “It’s a two-way street: the warming means less ice is going to form and more ice is going to melt, but also, because there’s less ice, less of the sun’s incident solar radiation is reflected off, and this contributes to the warming.”
The Arctic has gone through repeated warm episodes this winter, with temperatures climbing more than 40 degrees above average in some regions. The North Pole even experienced temperatures above the freezing point for a few days in February.

In mid-March, cooler temperatures and winds pushed out the edge of the sea ice pack and caused a late surge in ice growth that brought the maximum extent closer in line with the past few years.
In February, a large area of open water appeared in the sea ice cover north of Greenland, within the multiyear ice pack — the Arctic’s oldest and thickest ice. Most of the opening has refrozen but the new ice is expected to be thinner and more fragile, and a new opening might appear during the melt season. This could make the ice in this region more mobile and prone to exiting the Arctic this summer through either the Fram or Nares straits, ultimately melting in the warmer waters of the Atlantic Ocean.
“This old, thicker ice is what we expect to provide stability to the Arctic sea ice system, since we expect that ice not to be as vulnerable to melting out as thinner, younger ice,” said Alek Petty, a sea ice researcher at Goddard. “As ice in the Arctic becomes thinner and more mobile, it increases the likelihood for rapid ice loss in the summer.”
Despite the fact that this year’s melt season will begin with a low winter sea ice extent, this doesn’t necessarily mean that we will see another record low summertime extent.
“A lot will depend on what the wind and temperature conditions will be in the spring and summer,” Parkinson said.
Starting March 22, Operation IceBridge, NASA’s aerial survey of polar ice, is flying over the Arctic Ocean to map the distribution and thickness of sea ice. In the fall, NASA will launch a new satellite mission, the Ice, Cloud and Land Elevation Satellite-2 (ICESat-2), which will continuously monitor how sea ice thickness is changing across the Arctic.
For NSIDC’s analysis: http://nsidc.org/arcticseaicenews/2018/03/arctic-sea-ice-maximum-second-lowest/
But, they seem not to be paying attention to this:

A warmer start to the year (weather related) is now back to near normal. The Arctic ice looks like this now:

I just can’t get too worked up about a second lowest maximum extent.
I’d lay 50-50 that the maximum hasn’t yet been reached with the Arctic currently so cold with potential ice growth in far Northerly places.
Imteresting but not very ifnformative discussion of a few aspects of Arctic warning. What stands out is complete absence of any reference to my paper in 2011 that explains it all. Its title is “Arctic warming is not greenhouse warming.” To hear a true believer say that probably means instant excommunication from his source of public funds that pay his salary. Along with that fact I also notice a total avoidance of claims that Arctic warning has anything to do with the greenhouse effect, like they used to do before I wrote the paper. I would like to encourage those who have obviously read it to bring out some facts their readers are kept ignorant of. For example, fact is that for 2000 years before the start of Arctic warming there was nothing there but slow, steady cooling. And the fact that Arctic warming started at the beginning of the twentieth century when a rearrangement of north Atlantic flow systems took place. And the fact that the initial warming fluctuated and did not become a steafy warning until the late seventies. And the fact that those studying it got started in the late seventies and don’t have clue abut the previous 200 tears of Arctic history, Or the important fact that Arctic warming is caused by redirection of the Gulf Stream by the rearrangement if the north Atlantic current system to deliver more warm water into the Arctic Ocean. That’s enough. Read it and teach yourself some Arctic science.
“The decline of the Arctic sea ice cover has myriad effects, from changes in climate and weather patterns to impacts on the plants and animals dependent on the ice, …”
Hasn’t Crockford’s diminishitique taken most of the air out of this puffed-up concern?
For “diminishitique” read “critique”
Roger Knights
March 23, 2018 at 7:11 pm
Oh, I thought diminish worked quite well….
Ice, or lack thereof, observers might be interested in this. Shocking.
“On February 16, 2018 Vox.com published an article by Brian Resnick on a shocking record-breaking decline in Arctic sea ice during the last 1500 years (see above graphic).”
From http://lacoastpost.com/blog/?p=54731 “What will it take to shake the GOP disbelief in climate change?”
Graphic not up to date. This is a biologist who did good research, but may have been too long in state government. He does have some handles on problems. In 1899 Mississippi River ice made it to the Gulf. Any prognostications?
I’m getting insecure warnings on WUWT recent posts. Had an obvious scam that may have come through Science link.
It all depends how you look at graphs:
14.48 Wadhams, aka million square kilometers
When it is down to 13.5 msk, wake me.
Fascinating how the perspective changes when you ‘zoom out’. Things lose their immensity when compared to something bigger.
Kind of like how CO2 is dwarfed by H2O in the troposphere.
Why do not they map it using aerial photography and then correlate with the satellite readings and some fixed survey stations?
I believe that the Arctic is cloud-covered about 90% of the time in the winter. It would be very difficult if not impossible to do comprehensive aerial surveys.
It’s always dark, too. Rather complicates a simple approach.
Why don’t they map it using aerial photography and then correlate with the satellite readings and some fixed survey stations?
Why don’t we simply forget all about it. We’re questioning a propaganda machine posing as a “scientific consensus”. And while we discuss in detail all their outright bizare claims they screw us over ten fold.
A total waste of time and effort. Recycling claims and arguments really isn’t very helpful.
That is one of the many things that Dr Curry-Dr Perovich did during their 1997-1998 SHEBA over-winter expedition – used aerial surveys from C-130 flights and satellite surveys to compare with what the people on the ice were looking at. Couple of other expeditions since then have done it too.
But if we look at winter snow extent, it has been increasing for decades.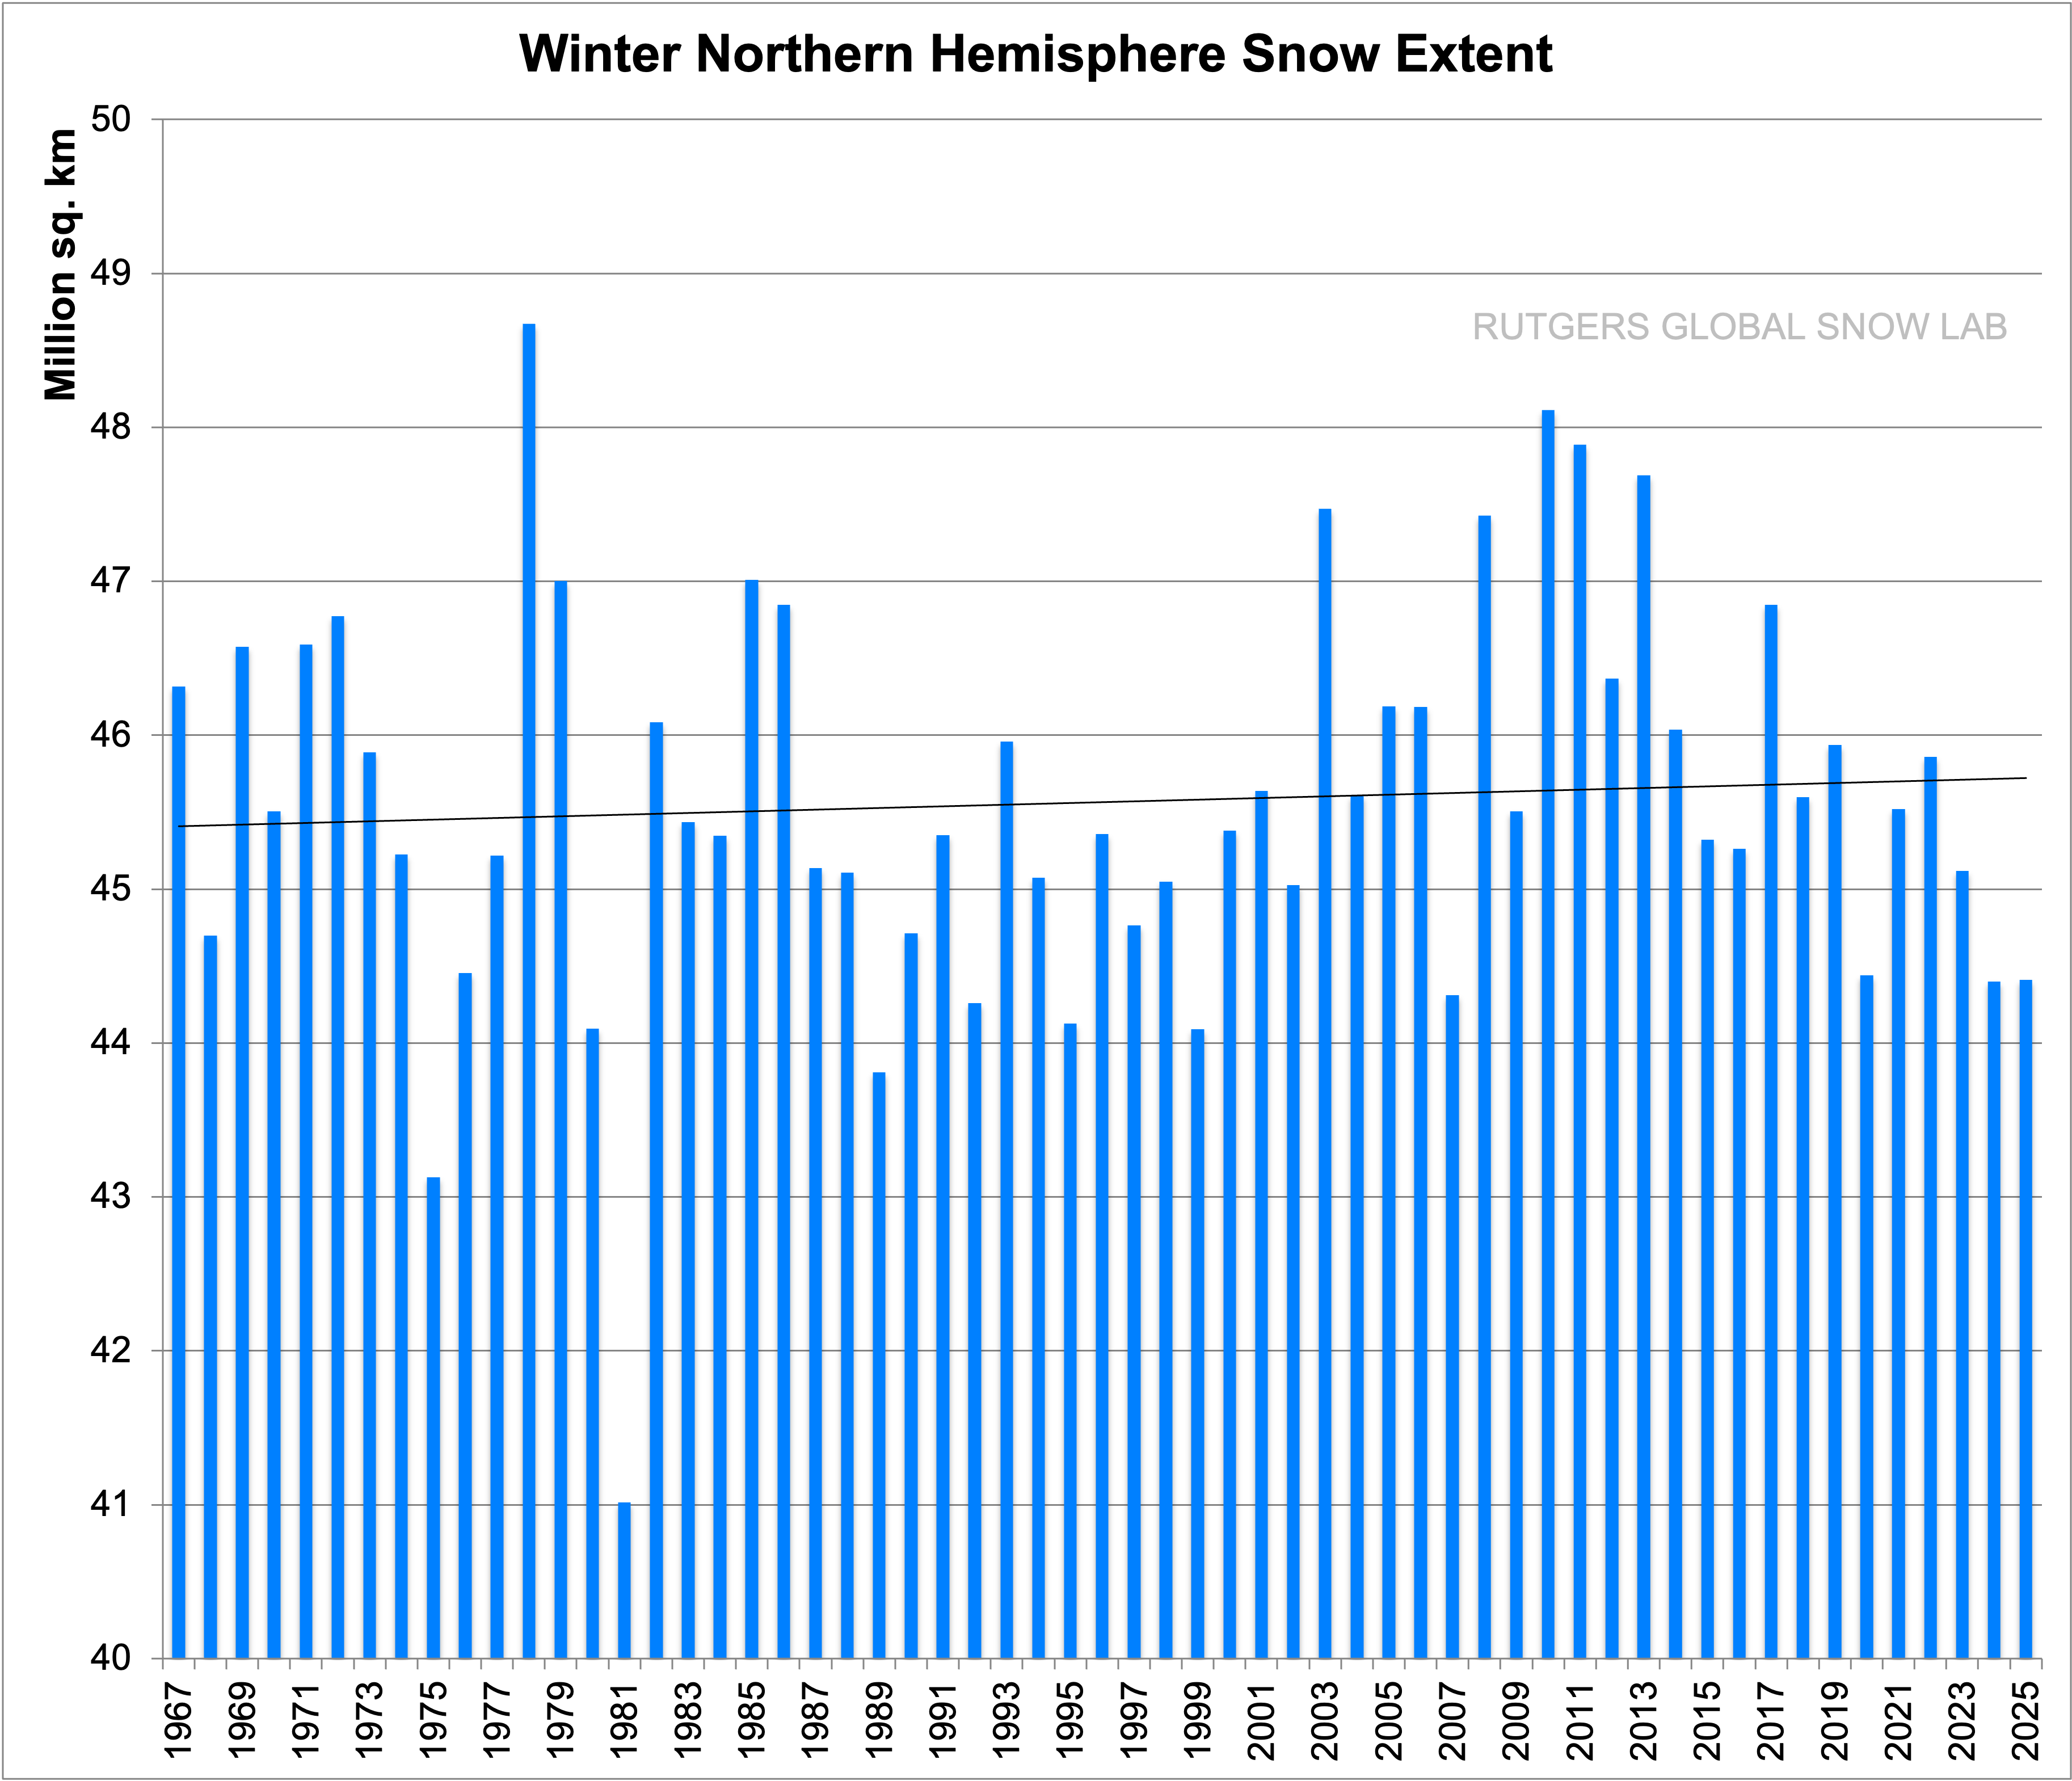
Conversely, NH spring extent has been decreasing for years. There may be a correlation here, with albedo playing its part in warming, and with Arctic ice-sheet melt. The early spring snow-melt lowers the albedo and allows much more insolation absoption and warming across Canada and Siberia, assisting in the melt of the Arctic ice sheets.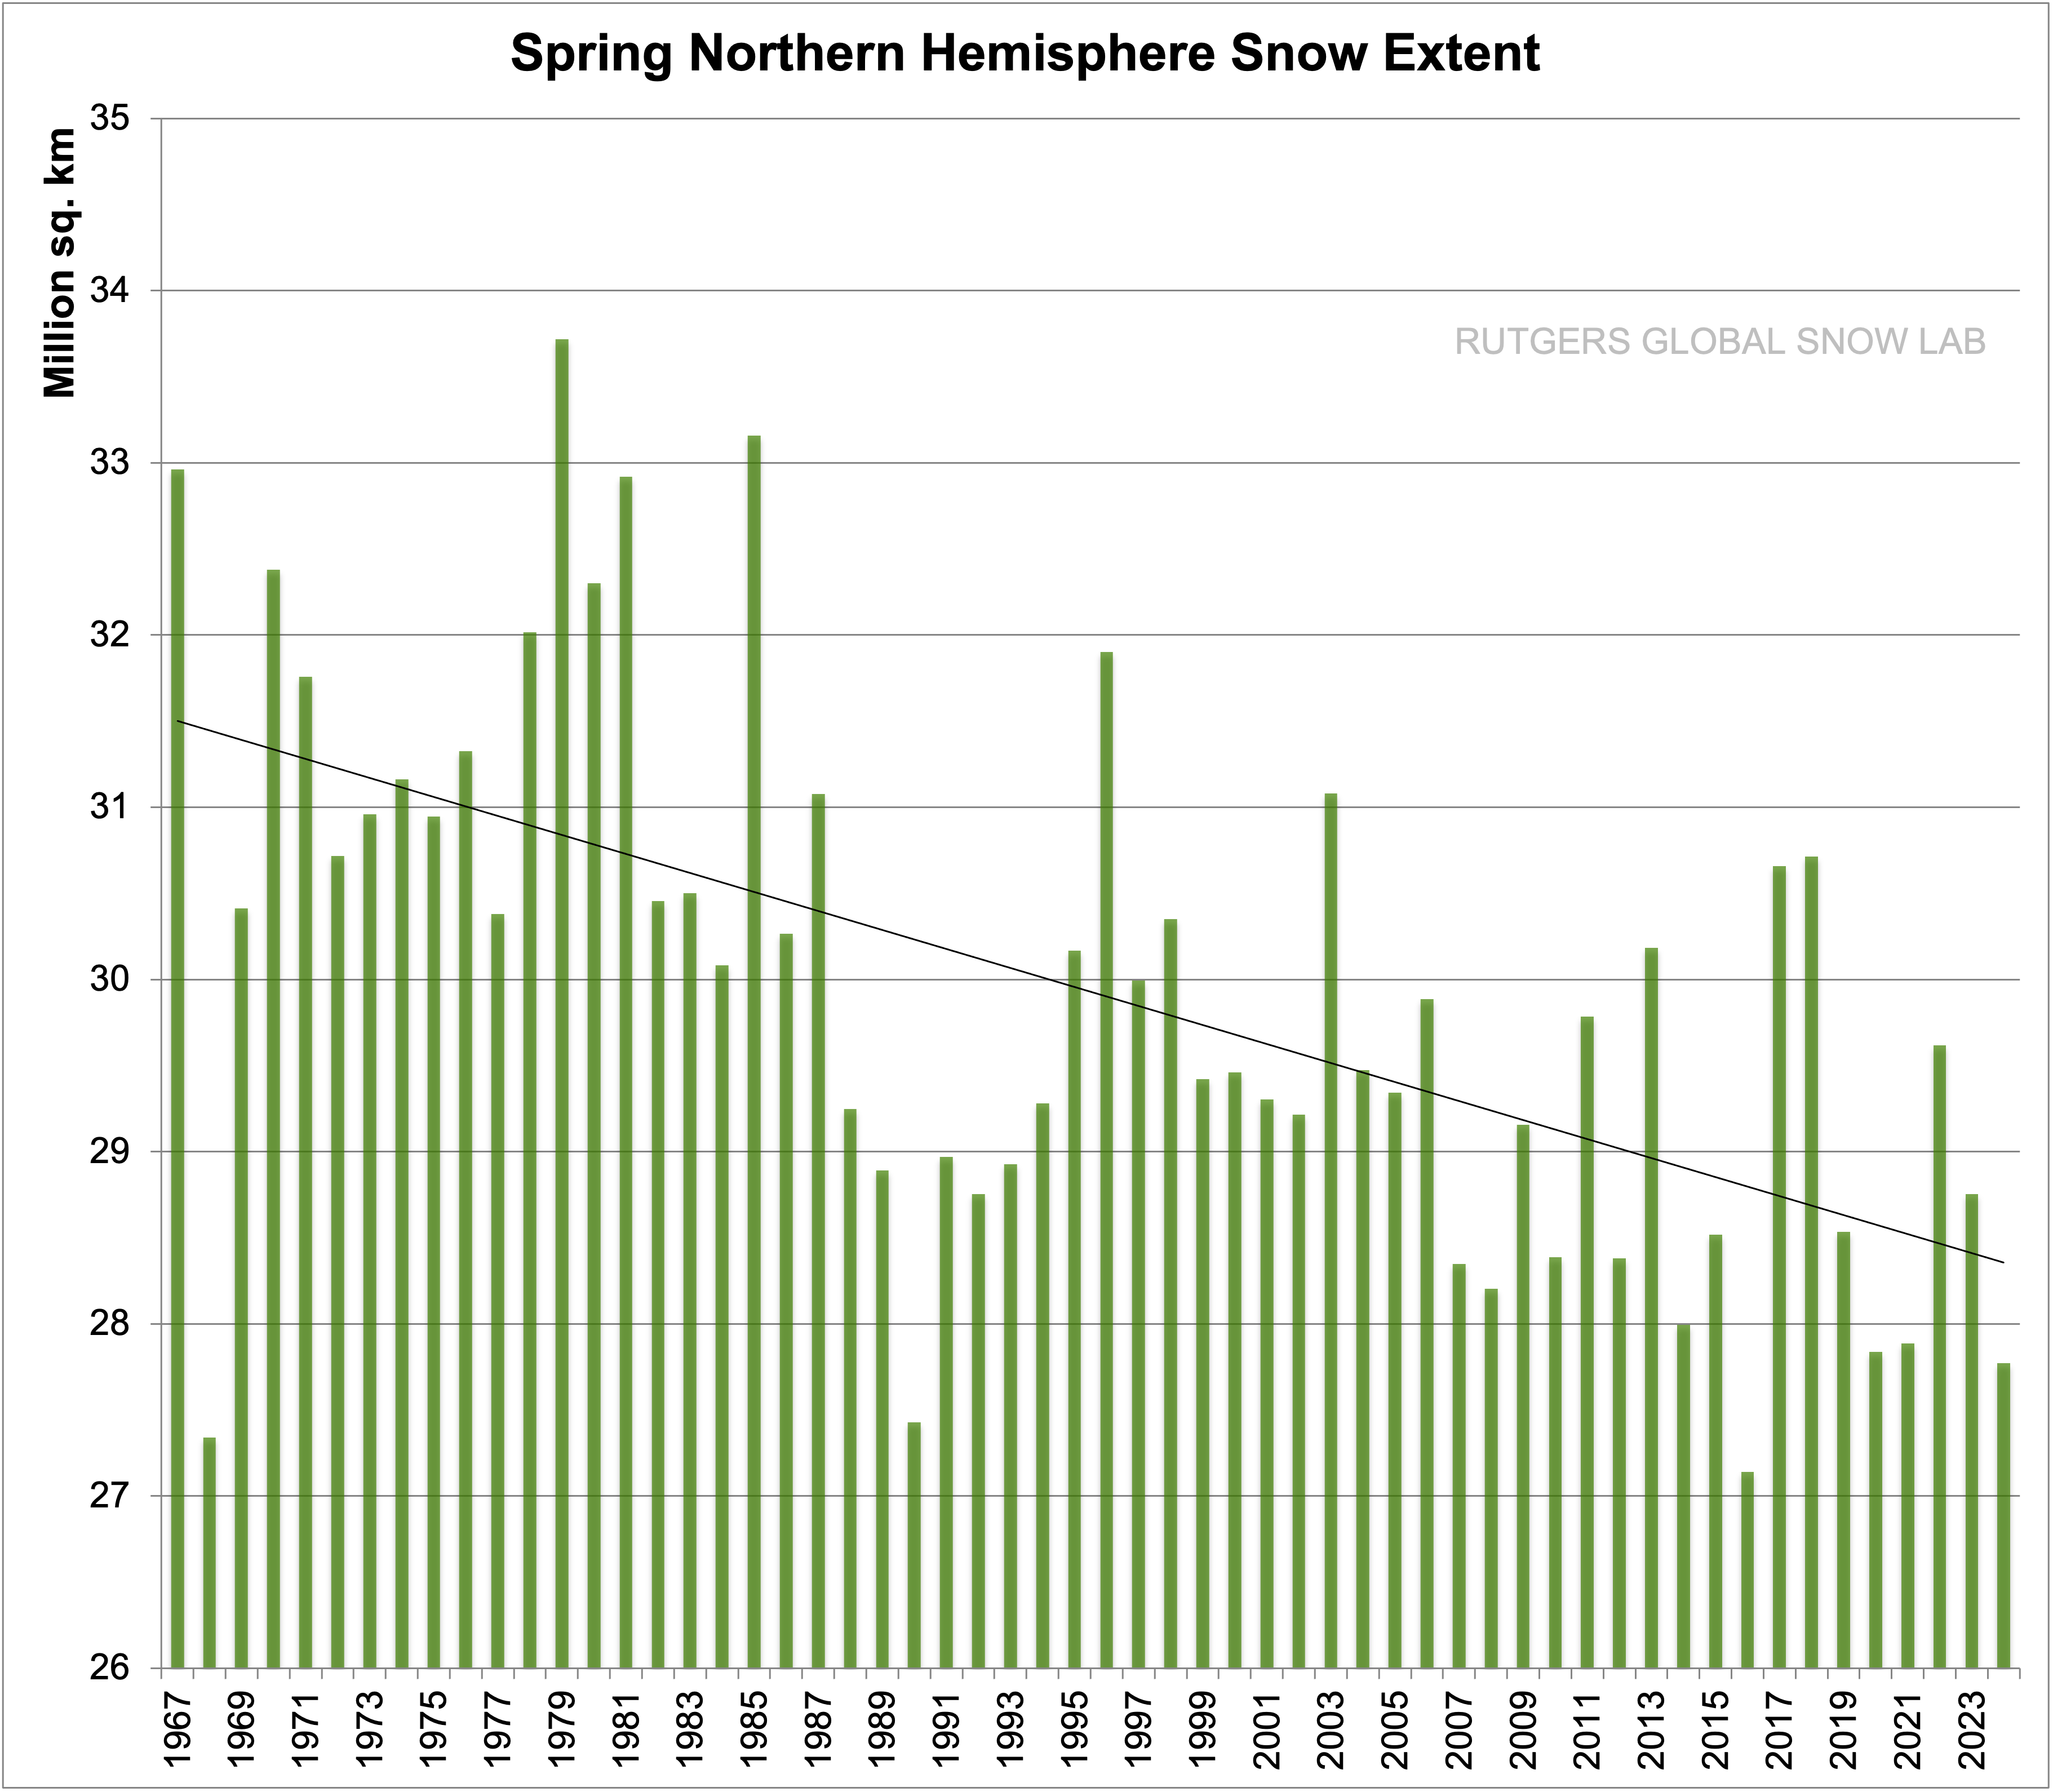
If so, the later spring snow melts of 2017 and 2018 may increase NH albedo, reflect away the spring insolation, and reduce the ice sheet melt. It is as good a theory as any….
Anyone who can’t find the major El Nino events on those graphs, I feel sorry for you, but the latest rebound is way more like 1969 than is is like 1991. If 2018 looks like 1970, we may consider a repeat of that cycle could be occurring. The AMO will have to drop more and get cooperation from the PDO and southern oscillations, but somebody needs to tell the Goracle that snow is not going away anytime soon.
The maximum arctic sea ice extent this year is no different than it was in 1974 (14.4 million square kilometers according to JOURNAL OF GEOPHYSICAL RESEARCH, VOL. 94, NO. C10, PAGES 14,499-14,523, OCTOBER 15, 1989).
Based on the historical record, this is exactly what one would expect. There is a natural, approximately 70 year, cycle to the arctic ice coverage, as obvious from the 100 years or so of Danish records of monthly Arctic sea ice extent. The late 30’s/early 40’s is a known time of peak warmth, and this period coincided with the first vessel passage through the Canadian Northwest Passage (the RCMP wooden vessel St Rock – using no modern navigational aids). Then 70 years later – now – we end up with diminished ice coverage again. However, in between, we had heavy ice conditions, especially from the mid 70’s to mid 80’s, as those working on Arctic offshore oil exploration through that time, can attest.
This paper reports a paleo proxy in the Arctic which shows that, with the exception of the LIA, Arctic sea ice extent is currently the highest that it has been in the entire Holocene.
https://onlinelibrary.wiley.com/doi/pdf/10.1002/jqs.2929
“Death spiral” is thus a very poor characterisation of current oscillating Arctic sea ice extent.
It makes good sense that temperatures in the Arctic should be elevated if the mechanism I proposed in https://wattsupwiththat.com/2015/12/22/volcanoes-and-ozone-their-interactive-effect-on-climate-change/
is correct, since the maximum effect of ozone layer depletion has been shown to occur in the polar regions (e.g., the well-known Antarctic ozone hole.)