Guest Post by Willis Eschenbach
Well, folks were complaining that my graph of the CET compared to the centennial solar minima was just one location, England. So here are the five European temperature records which start before 1815. Now, if the theory of the solar/temperature connection is correct, the temperatures should start trending downward when the solar minima start, and they shouldn’t start warming back up until the sunspots get numerous again after the end of the minima. Here are the records so you can see if they agree with the theory:


Color me unimpressed. As you can see, there is no obvious sign that the solar minima have caused any change in the temperature. Some go up, some go down, some go nowhere.
Yes, I understand that this is not a global dataset … but then, they generally don’t go back far enough to catch the Dalton Minimum, which starts in 1798. If you have a dataset you’d like me to graph up, put a LINK to the dataset in the comments.
I leave further discussion to the wisdom of the readers.
Best regards to all, another rainy night here, California needs rain so it’s all good,
w.
MY POLITE REQUEST: When you comment please QUOTE THE EXACT WORDS THAT YOU ARE REFERRING TO so that we all can understand what you are discussing. I’m serious about this, and I must warn you that I tend to get short-fused when people ignore my polite request …
DATA: I have used ECA Daily Data from here.
Have you looked at the De Built data from the Netherlands?
http://climexp.knmi.nl/data/ilabrijn.dat
Hi Willis,
your postings are one reason to come back to this site.
Thanks:
Here a lin to a 250y Data set measured in the same location where nowadys the influence in staion cahengs were investigated.
Kremsmuenster:
http://berkeleyearth.lbl.gov/stations/152543
And one more: Basel
http://berkeleyearth.lbl.gov/stations/159527
Willis and Leif are right to call time on the whole solar thing. To say that climate is “just the sun” is an error of exactly the same type as to say it’s “just CO2”.
That error is to regard the climate as passive and climate change as necessarily being forced by an external agent, CO2 or the sun. Both bodies of opinion could collectively be called “passive deterministic climate science”.
This is a profound error. I follow the views of the likes of Robert Ellison, Tsonis, Wim Rost, Marcia Wyatt (&Judith Curry) that the dominant component of climate change is internally generated within the climate system by chaotic-nonlinear processes. In timescales of hours to days, in the atmosphere and on timescales of years to millennia, in the ocean. This is self-evident when one considers the nature of the climate system – a highly complex dissipative open system containing positive and negative feedbacks. If chaotic dynamics occur anywhere on earth they must occur in the climate system. Chaos denial is the biggest problem in climate science.
On Milankovich timescales there is of course an unmistakable driving role of solar variability on climate. But it occurs with a long lag that shows that the sun influences climate via the ocean. The figure below – provided by Javier needless to say – is the most important figure I have ever seen posted on a climate blog. It shows with glaring simplicity that obliquity drives the glacial-interglacial cycle with a delay of 6500 years.
It makes perfect sense that obliquity peaks correspond to increased insolation, and the 6500 year lag is the time taken for increased insolation to warm the oceans enough to flip the climate from the glacial to the interglacial attractor, and falling obliquity back to glacial.
Yes yes before you get started, it is equally blindingly obvious that not every obliquity peak (since the MPR) has caused and interglacial, the obliquity peaks that cause interglacials are those that coincide with the combined (and causally interconnected) peaks of eccentricity, modularion amplitude of precession and insolation at 65N in the summer.
That figure is the Rosetta stone of solat forcing of climate via ocean circulation.
A chaotic nonlinear oscillator such as earth’s climate system can br periodically forced from outside. Just like the classic Belousov- Zhabotinsky chemical nonlinear oscillator can be either internal or periodically forced, for instance by light flashes. So chaotic internal dynamics and astrophysical forcing of climate are not mutually exclusive. It can be both-and, not just either-or.
While it is really hard not to take your graph seriously, I think this applies to the millennial cycles.
We are looking at centennial cycles, which are the little squiggles up and down in your graph. The highs and lows between the much bigger highs and lows. It ultimately all plays out, but the question here does solar cycles play a part in the ups and downs over the centuries.
I’m not sure if it is truly chaotic, but I am coming to believe that such complex, non-linear systems may not be in equilibrium very often, if at all. That means that they are constantly changing in ways that are currently impossible to predict, partly because we do not know the initial conditions we are using to begin our predictions. We are being, in common with much of science at the moment, far too reductionist. We need to understand the whole before we can remotely say whether small changes have any effect, and if is, in what direction.
My expertise really lies in human biology and economics, but both are beginning to understand that the current models of our bodies and our economies are hopelessly simplistic. I can’t see that the climate is less complex!
“On Milankovich timescales there is of course an unmistakable driving role of solar variability on climate. But it occurs with a long lag that shows that the sun influences climate via the ocean. The figure below – provided by Javier needless to say – is the most important figure I have ever seen posted on a climate blog. It shows with glaring simplicity that obliquity drives the glacial-interglacial cycle with a delay of 6500 years.”
But any climate changes caused by obliquity cycles is not due to solar variability, it is due to insolation variability. The Sun does not vary it’s output due to any changing Earth conditions. It is important not to confuse those terms.
You are right to point out that Milankovich cycles such as obliquity are about orbital variations, not changes in the luminosity of the sun 🌞 ; however both of these have the same effect of causing changes in sunlight received at earth. I was just making the point that the obliquity cycle in particular, in relation to the glacial-interglacial cycle, shows how variation in total solar irradiation (TSI) affects climate – i.e. via ocean heat, with a lag.
philsalmon March 19, 2018 at 3:56 pm
And you know this how? I’ve never heard this theory. The theory I’ve always heard is that low insolation in the NHem summers lead to growth of ice, which in turn reflected more sunshine. This positive feedback led to the glacial episodes.
So … where did you get your claim that it is “via ocean heat, with a lag”?
Regards,
w.
Phil, you might enjoy my two posts on the subject:
Into and Out of the Icebox 2015-01-23
Inspired by a random comment by Steve McIntyre over at his marvelous blog Climate Audit, I got to thinking about the ice ages. I’ve long heard that the ice ages are caused by the changes in summer insolation in the northern hemisphere. As the story goes, the Milankovitch cycles of…
The Icebox Heats Up 2015-01-24
Well, either it’s a genetic defect or I’m just a glutton for punishment, but I’m going to delve some more into the ice ages. This is a followup to my previous post, Into and Out Of The Icebox. Let me start by looking at the cycles in the insolation and…
Best regards,
w.
“You are right to point out that Milankovich cycles such as obliquity are about orbital variations, not changes in the luminosity of the sun 🌞 ; however both of these have the same effect of causing changes in sunlight received at earth. I was just making the point that the obliquity cycle in particular, in relation to the glacial-interglacial cycle, shows how variation in total solar irradiation (TSI) affects climate”
The difference between the temperature changes due to the very small changes in TSI and the difference in the temperature caused by obliquity is more than huge. It is not the TSI changes that bring the SST of the Gulf of Mexico from the high 80s F down to the low 50s F each winter nor is it the reason for the increase in those temperatures back into the high 80s F in summer. That is 100% obliquity. And that is for a latitude of only 28N.
Willis
Thanks for the links to your posts – I’ll take a look.
To answer your question, this figure posted originally by Javier shows that every interglacial (in the last million years) coincides with an obliquity peak lagged by 6500 years:
Now like you I’m no fan of wiggle-matching but this one seems unusually compelling. It’s well established how obliquity causes insolation heating of the oceans. And it’s also clear why not every obliquity peak – but every second or third – makes an interglacial since it has to coincide with maximal eccentricity/precession modulation/65N summer insolation.
However – why the 6500 year lag?? That’s the fascinating part. For me, it has to be the ocean – the time taken to warm it’s depths appreciably. To quote the writer of the book of Job, “if it is not He then who is it?”
Tom
You’re right – the effect of obliquity is the big seasonal swings. But these must warm the whole ocean indirectly. Sediment 18O data indicate that oceanic warming prior to Holocene inception started around Antarctica – probably due to the way the THC works:
http://home.sandiego.edu/~sgray/MARS350/deglaciation.pdf
See figure 5.
“Well, either it’s a genetic defect or I’m just a glutton for punishment, but I’m going to delve some more into the ice ages. This is a followup to my previous post, Into and Out Of The Icebox. Let me start by looking at the cycles in the insolation and…”
Your genetic defect is a boon to the rest of us.
John Finn
Although you are right about the warm years it is also a fact that CET Has been declining all this century
https://wattsupwiththat.com/2018/03/04/the-rise-and-fall-of-central-england-temperatures-help-needed-to-find-missing-data/
It must be sad that this is from a notably warm period In the 1990’s and hasn’t yet been gong on long enough to be a climatic trend.
Nevertheless it is intriguing and is noticeable enough to suggest we need to have a plan B for cooling as well as a plan A for warming
This might have ensured the authorities had actually bought grit for the roads during the two recent cold snaps and might have meant the shops had restocked quicker after the cold weather delayed deliveries.
Tonyb
Although you are right about the warm years it is also a fact that CET Has been declining all this century
Hmm – possibly a slight downward trend since 2000 but given the variability of the data (applies to most regional records) 18 years is far too short a time.
John
Yes, I do make that point in the article.
Nevertheless, it does have consequences in our just in time society and where we rely on an extended season to maximise farming and where expensive energy from unreliable sources impacts much more quickly when temperatures are headed down, rather than up.
We are unprepared for cold weather as we have been told not to expect it.
tonyb
“Color me unimpressed. As you can see, there is no obvious sign that the solar minima have caused any change in the temperature. Some go up, some go down, some go nowhere.”
And that is the point temperatures like climate itself IS a local phenomena. There is not a global effect, there are only many, many local effects going on.
During the last LIA some places had anomalous droughts and heatwaves (especially during the start of the LIA), while other areas had anomalous floods, and/or long periods of frost, and/or persistent snow cover. Local weather factors and local topography rule.
Quoting the author:
But, but, but, …… the parameters that determine “changes” in/of near-surface temperature for the aforesaid “five European temperature records” are not equal, thus potentially negating any comparisons of said. To wit:
Stockholm, ————————- Sweden, —————- 59.32° N latitude, —— 0 feet elevation
Praha-Klementinum, — Prague, Czech Republic, —- 50.07° N latitude, — 1,309 feet elevation
Hohenpeissenberg, —– Bavaria, Germany, ———– 47.79° N latitude — 2,528.7 feet elevation
Milan, ——————————- Italy, ——————— 45.46° N latitude, —– 394 feet elevation
Bologna, —————————- Italy, ——————– 44.49° N latitude, —– 177 feet elevation
That’s why anyone who claims the average global temperature has any real climate meaning (other than for grant money) is stacking the deck.
Samuel C Cogar March 19, 2018 at 10:11 am
Two things. First, I’m not making any “comparisons”. I’m looking at each record in isolation.
Second, this is supposed to be some global effect … but if so, we should see it in individual records … sorry, not seeing it.
w.
But, but, but, …… the parameters that determine “changes” in/of near-surface temperature for the aforesaid “five European temperature records” are not equal, thus potentially negating any comparisons of said
Who is doing a comparison? My understanding is that Willis is inviting us to find a solar signal in ANY of the temperature records.
Willis Eschenbach – March 19, 2018 at 4:11 pm
First, I don’t think anyone mentioned anything about you personally “making any comparisons”,
Secondly, my post was simply pointing out the “geographical reasons” why no one, ….. yourself included, ….. should be “Colored impressed” by the plotted data of the five (5) different temperature record graphs that were posted.
And thirdly, the reason for my stated comment of, …. “thus potentially negating any comparisons of said”, ….. was simply because I apparently made a serious mistake in/of my reading comprehension ability when I apparently assumed that the author was “suggesting” or “inferring” that his reading audience should “compare the plotted temperature data of the 5 different graphs” via this quoted statement, to wit:
Now I don’t know what anyone else did, …. but apparently I acted foolishly and irresponsibly when I “flipped” back n’ forth to visually compare the plotted temperature data of the 5 different graphs in an attempt to appease my “curiosity” as to how great those “differences” actually were.
My humble apology iffen my posting inadvertently caused any emotional grief.
A large increase in the magnetic activity of the Sun in 2015 (latitudinal circulation) made it possible to release energy accumulated in the oceans (El Niño). However, the atmosphere does not accumulate heat, as evidenced by the large amount of snow in the northern hemisphere. ?time=1520212803000
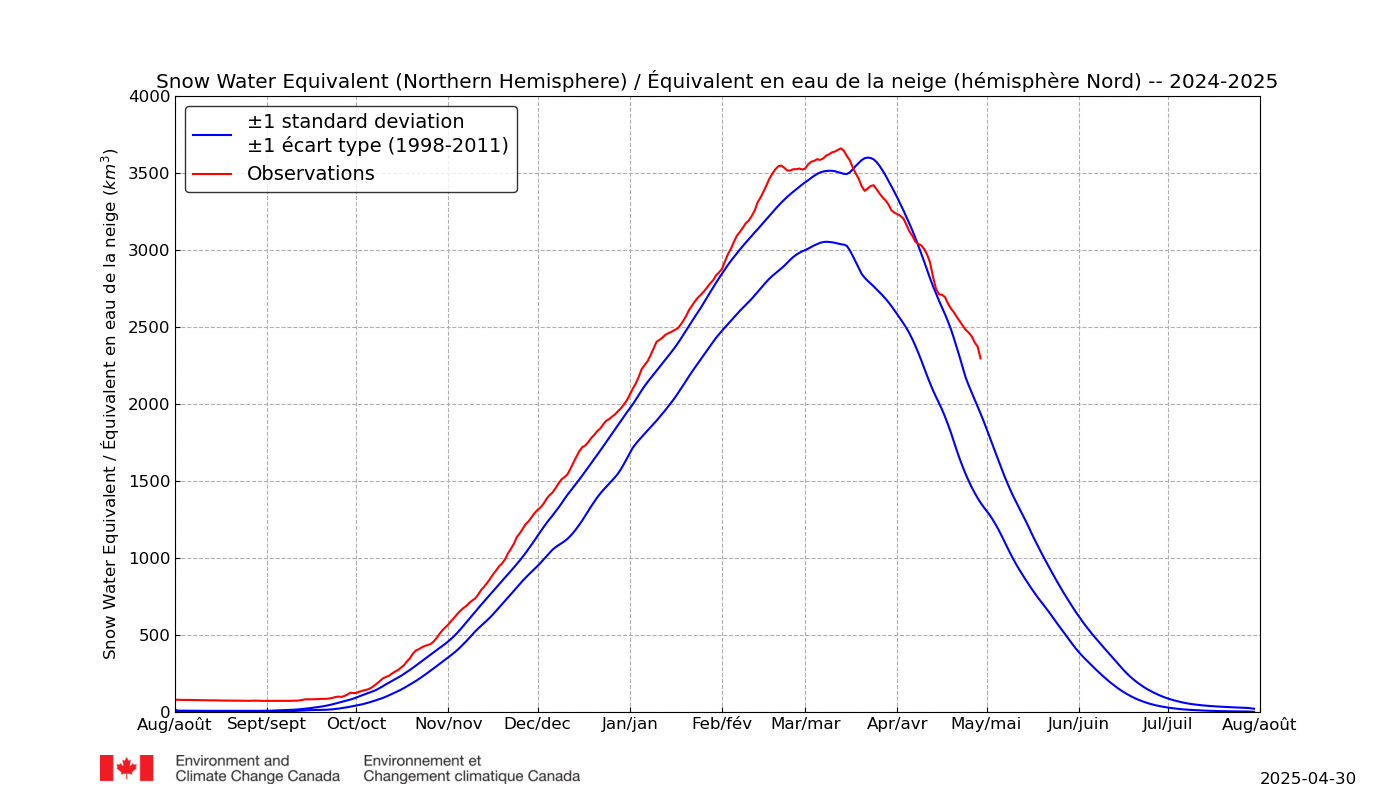
Ren, I don’t understand your claim. Your link to the Ap Index shows that it has been increasing since 2010, and that prior to 2005, it was higher than it has been since.
What is the causative chain that you propose connects those facts with the snow levels?
w.
“if the theory of the solar/temperature connection is correct, the temperatures should start trending downward when the solar minima start, and they shouldn’t start warming back up until the sunspots get numerous again after the end of the minima. ”
I don’t think that is right.
The temperatures start trending downward as soon as one passes a peak of solar activity but modulated somewhat erratically by the thermal inertia of multiple ocean oscillations that sometimes supplement and sometimes offset one another so that the time lag is itself variable.
The temperatures then start trending upward as soon as one passes the lowest trough of solar activity subject to such oceanic interference.
That is pretty much what the charts do show.
The low magnetic activity of the Sun to 2015 (meridional circulation) was delaying El Niño. The decline in solar magnetic activity (as it is now) will continue to disrupt the ENSO cycle.
ren March 19, 2018 at 11:08 am
Is there some memo I missed saying that science by assertion is just fine now?
How on earth would you know if the meridional circulation of the sun is “delaying” El Nino? How can you tell a “delayed” El Nino from an average El Nino.
Sorry, but those kinds of claims with absolutely no citation or support and no theoretical, logical, or other justification gets no traction on WUWT …
w.
The dry air in the north causes the temperature drop above the 80th parallel below the average from 1958-2002.
http://images.tinypic.pl/i/00961/v9zmh0f50xf3.png
El Niño could have already developed in 2015.
http://climexp.knmi.nl/data/ihadisst1_nino3.4a_2009:2018.png
The highest magnetic activity of the Sun in this cycle is visible in 2015.
http://images.tinypic.pl/i/00961/c4j4f4a8ifsd.gif
This is also visible in the strong polar vortex in 2015 in the south. The strong polar vortex caused an increase in the ozone hole in of 2015.
http://www.cpc.ncep.noaa.gov/products/stratosphere/polar/gif_files/ozone_hole_plot.png
Meridinal circulation disturbs the constant winds constants flowing along the equator.
Sorry.
Meridional circulation disturbs the constant winds flowing along the equator.
Solar Dipole from WSO.
Abstract
The association between solar activity and Asian monsoon (AM) remains unclear. Here we evaluate the possible connection between them based on a precisely-dated, high-resolution speleothem oxygen isotope record from Dongge Cave, southwest China during the past 4.2 thousand years (ka). Without being adjusted chronologically to the solar signal, our record shows a distinct peak-to-peak correlation with cosmogenic nuclide 14C, total solar irradiance (TSI), and sunspot number (SN) at multi-decadal to centennial timescales. Further cross-wavelet analyses between our calcite δ18O and atmospheric 14C show statistically strong coherence at three typical periodicities of ~80, 200 and 340 years, suggesting important roles of solar activities in modulating AM changes at those timescales. Our result has further indicated a better correlation between our calcite δ18O record and atmospheric 14C than between our record and TSI. This better correlation may imply that the Sun–monsoon connection is dominated most likely by cosmic rays and oceanic circulation (both associated to atmospheric 14C), instead of the direct solar heating (TSI).
https://www.ncbi.nlm.nih.gov/pmc/articles/PMC4044623/
The Nino1,2 index shows that El Niño could have developed earlier. This index fluctuates the most.
http://climexp.knmi.nl/data/inino2_2014:2018.png
My take is the overall temperature of the earth stays about the same. Where and when temperatures are changing is the big problem. By that I mean you get more unpredictable weather during the minimums, due to their effects on the jet stream. I really don’t care about the temperature in the Arctic I care what it is where we grow food. Also changes in rainfall patterns are more concerning than temperature as general rule.
Also I would say the sun is just one piece of the puzzle the AMO and PDO are big players as well. If all the cycles are stuck in warm phase we get hot and if all the cycles are in cold phase we get cold. If they are in different phases we are probably more neutral.
What is so great about this point in time in the climate is now we are going to have a test.
The test is going to show if low solar/geomagnetic fields first have more influence over the climate then CO2 ,which I think has zero influence by the way.
Secondly we might be able to find out the degree and duration of time the weaker magnetic fields are needed in order to show a stronger climate connection.
The signs will be an increase in silica explosive volcanic activity, an increase in global cloud cover and snow cover and a decrease in overall sea surface temperatures. In addition a more meridional atmospheric circulation evolving even further from what we have currently. The global electrical field strength will also have to be monitored.
(NOTE – A decrease in overall albedo of 1/2 of 1% just about or will wipe out all of the global warming since the Little Ice Age ended around 1830 which coincides with when the Dalton Solar Minimum ended.
The sun went from a very active mode from that time until year 2005. Now we are in an inactive mode.)
The culprits involved in the above will be less EUV, UV light, an increase in galactic cosmic rays ,and a shifting of where the galactic cosmic rays are directed(due to the geo magnetic poles moving toward lower latitudes currently).
As of now the latest alarming information shows the geo magnetic field is decreasing by 5% per decade.
The weaker this field gets the more it will compound given solar activity both in regards of allowing more galactic cosmic rays to enter our atmosphere and by allowing lower intensity solar flairs to have a greater impact than they would if the geo magnetic field was stronger.
All the terrestrial items that govern the climate are controlled themselves by the sun and the geo magnetic field strengths in my opinion.
I am not alone in this thinking as the study I sent earlier showed and a video I am going to send now will also show.
I say year 2018 is the turn point
Salvatore Del Prete March 19, 2018 at 12:58 pm Edit
As I showed in my graph in the previous post on the subject, the test has been going on since 1980, and your theory is in splinters. Here’s the graph again:
Best regards,
w.
No the test has been going on since 2006. Up to 2006 solar should have had a net warming according to my studies.
I will say this, if the temperatures do not turn this year and thereafter then I will reconsider.
One can have no confidence in any of the temperature records which are simply not fit for purpose, and therein lies the problem when seeking to look for correlation (still less causation).
There are many good reasons (frequently rehearsed on this blog and others) to suspect that if only temperatures were ascertained properly, and a true like for like comparison made, the temperatures of today would be no warmer than were seen in the late 1930s/early 1940s.
If that is the case, your plot would look somewhat different.
richard verney March 20, 2018 at 6:05 am
Thanks, Richard. Back In Javier’s thread I pointed out that HadCRUT, the temperature record I used, is very close overall to the UAH MSU record, viz:
This strongly supports the idea that the divergence of temperatures and sunspots post 1980 is a real and unexplained phenomenon for those claiming that sunspots have a significant effect on temperature.
Regards,
w.
We can always rely on Willis and Leif to drag us back to the data (or even lack of data, especially the supportive type). They are right, of course.
Yet, there are historical and scientific suggestions, lots of them, that the solar cycles do affect our climate. The earth is subjected to changes in magnetic field strength and direction, changes in solar wind, changes in total irradiance and particularly UV, changes in the microwave flux and then there are the consequential effects such as modulation of incoming cosmic charged particles and cosmic dust.
Some of these have effects on cloud seeding, ozone, luminescent clouds and atmospheric chemistry. Some of these things are well understood, some are not and I suspect that there are some that have not yet been discovered.
Correlation or lack of correlation is always important in seeking relationships but not essential. Combinations of several influences could produce a cumulative effect whilst each is ineffective on its own. Furthermore, small differences in timing can blur the overall temporal relationship. IR downwelling has a problem warming oceans but solar shortwave radiation does not. Ocean warming introduces a whole new timescale when it comes to tropospheric warming that registers in the records
We owe a great deal to Svensmark. He has pioneered a particular mechanism that demonstrates a solar effect. It is probably not enough but it is a start.
We need more constructive thinking. Great scientists are known for their innovative and creative insight, less so for their ability to shut down ideas.
This is well worth viewing in my opinion.
Clyde Spencer March 19, 2018 at 10:00 am
People conflate the fact that “virtually all of the energy that the Earth receives comes from the sun” with the question at hand, which is, does a change of a tenth of one measly percent in the strength of the total solar irradiation between sunspot peaks to troughs cause corresponding changes at the surface?
Despite looking in dozens of places I can’t find such an effect … and given the minuscule size of the change, I find that totally unsurprising. I had hoped when Svensmark came up with the cosmic ray theory that I’d be able to find something there … but I find no effect in the clouds, the temperatures, the river flows or anything else I’ve looked at. I’ve used all the analysis tools I know about, Fourier analysis, CEEMD analysis, scatterplots, cross-correlation analysis to see if there is a lagged effect … nothing.
Regards.
w.
I think average global temperature is the average temperature of the ocean – which is about 3.5 C.
It takes centuries to increase the average temperature of the ocean by fractions of a degree.
What reflects average global temperature is global surface temperatures, which is about 17 C.
What we tend to care about is land surface air temperature and over a period of years into the future – and that is related changing ocean surface temperatures.
So for human needs of future forecasts, one needs to be able to predict things like El Ninos and basically it’s weather and global weather.
And I also think solar activity is related to weather and global weather.
But people want to know about global average temperature hundred years or more in the future, and basically, we are in a icebox climate and we will be in icebox climate a 1000 years from now, just as been in this global climate for millions of years. So in 100 years the ocean might be a bit closer to
4 C. And the oceans at 4 C, will have a significant affect upon the average ocean surface temperatures which cause land surface temperature to be warmer. So continental US is currently at sat 12.5 C and if Ocean were at 4 C , US would closer to 15 C.
And the US at 15 C isn’t hotter summers or More heat waves, nor does mean it doesn’t snow anymore and mountains might get more snow.
And such change is similar to the change we have already had over the last century or two – which despite news reports hasn’t been much change, it appears mostly to have had been improving condition.
OOPS! When I read this post some hours ago, all of the charts appeared within the article.
But now, only one shows and the four Dropbox-hosted charts do not appear. The error from Dropbox is:
This link is temporarily disabled. The person who shared it hit their daily limit of traffic or downloads. Learn about traffic limits.
Perhaps the charts can be hosted elsewhere?
Grrr … I was having trouble uploading these to WordPress so I put them on Dropbox … didn’t think that of course WUWT would lead to big traffic.
Hang on, lemme see if I can upload them to WordPress today … OK, WordPress seems to be back in gear, or maybe it’s my computer, but in either case it’s fixed.
Thanks for the heads-up, Paul,
w.
Don’t look a gift horse in the mouth Willis, high traffic means you’re getting through to folks here.
My wish is that you would become an iconic scientist/journalist widely known for your clarity of thought.
Thanks, Pop. My wish is that my ideas take root …
w.
Somehow, an optimistic quest for climate truth must replace the continually repeated propaganda of “worse than we thought” and “we must act now, no matter the cost – just to stay safe”.
You are a luminary in that quest. In St. Louis Mo slang- “You go boy!”
There is a lag of 50-70 years between sunspots and temperature, don’t know why. Maybe heat is stored in oceans.
Peter Langlee March 19, 2018 at 1:35 pm
And you know this how? Science by assertion gets no traction here, sorry.
w.
Just going with the temperature records I would have eyeballed the “low” as an ~century long 1830 – 1920 or so with some warm years. The Stockholm record seems to show the best fit to to the Dalton and Gleissberg. The Italian ones may have been changed by Mediterranean/North African weather, but of course, that doesn’t support the sunspot cooling theory either.
If there is an effect of cooling and low SSN that can be overwhelmed or exacerbated by other factors, we will have better data going forward if we are getting an extended quiet sun. Certainly something big happened to freeze the Thames, the Bosphorus, New York Harbour and down the New Jersey coast, etc.
Gary, I think that in our panic over climate, we are missing the chance to appreciate this opportunity to study and enlighten ourselves on the effects of deep solar minima across the entire spectrum of recently acquired technologies in the satellite era. There is much to learn in the next few decades- F*ck “settled science”!
We are doing the snow dance here in northern Vermont with three Nor’easters in two weeks which saved our ski season. We received only 2-3 feet of snow for the entire month of February and we just picked up 3-4 feet from 1 to 18 March. Love playing in the stuff though the commute is slower!
The temperature at Hudson Bay is still very low.
http://images.tinypic.pl/i/00961/kdmspdsfvkl3.png
I can see this becoming the new battleground on this site. Is it coincidental that the Sun’s magnetosphere is weakening and we’ve just had an epic winter? I’m with Svensmark. The sun goes quiet and emires fall.
Willis etal…this contains some science behind “cycles” and SSN. Also notes periods align with “cold” history. https://arxiv.org/abs/0903.5009
“The most precise resonance – between Earth and Venus, which not only stabilizes orbits of both planets, locks planet Venus rotation in tidal locking, but also affects the Sun:
This resonance group (E+V) also influences Sunspot cycles – the position of syzygy between Earth and Venus, when the barycenter of the resonance group most closely approaches the Sun and stops for some time, relative to Jupiter planet, well matches the Sunspot cycle of 11 years, not only for the last 400 years of measured Sunspot cycles, but also in 1000 years of historical record of “severe winters”. We show, how cycles in angular momentum of Earth and Venus planets match with the Sunspot cycle and how the main cycle in angular momentum of the whole Solar system (854-year cycle of Jupiter/Saturn) matches with climatologic data, assumed to show connection with Solar output power and insolation. We show the possible connections between E+V events and Solar global p-Mode frequency changes. ”
In addition, this was written some time ago so contains amount of predictiveness – we are in essence in the future as far as the article is concerned. The points I see are: Figure 94 shows extrapolation of angular momentum of Emb relative to Sun, with a prediction of next
Sunspot cycle maxima arround 2013,2022,2036 and minima arround 2020 and 2032, (with still a large level
of uncertainty – since the cycle depends on more variables, among others by damping and exciting by
angular momentum changes (with a main cycle of 934* years in case of Jupiter/Saturn), by Uranus/Neptune
cycle (178.5 year cycle corresponding with the Gleissberg cycle) and possibly other cycles and
interferences).
And
Figure 81 – Compared scalar sum of angular momentum of 9 planets and Sun with the climatologic data
(Moberg at al. 2005, average temperature (light blue line), with gaussian filtering applied (bold blue line))
Reference for the climatologic data:
Moberg, A., D.M. Sonechkin, K. Holmgren, N.M. Datsenko and W. Karlén. 2005.
Highly variable Northern Hemisphere temperatures reconstructed from low- and high-resolution
proxy data.
Nature, Vol. 433, No. 7026, pp. 613-617, 10 February 2005.
According to this connection, the current warming rate should slow down a little now, but will grow to local
maximum arround year 2040, from which point it should drop to next little ice age arround year 2430 and to
next warming arround year 2900.
Food for thought but I think Javier will like it.
Macha
Eschenbach,
listen up !
The trick with minimums is to
focus on one of them.
If you look at two, or even all four
during the Little Ice Age, you
get four different stories.
Thatsa no good !
If you look only at the Maunder Minimum,
you CAN say it was cold during the minimum
… but …
you’d also expect falling temperatures
during a minimum, with the average
temperature declining from the beginning,
to the end.
But even the Maunder Minimum
doesn’t do that,
per temperature reconstructions,
that I’ve seen.
Anecdotal written evidence strongly suggests
the Maunder Minimum cold was broadly
recognized, and hated, but not the same
for the three other Little Ice Age minimums.
So the trick is to focus on the Maunder Minimum,
develop a solar theory based on that,
and ignore the rest of the Little Ice Age !
Just like the temperature rise in the 1990s
was extrapolated 100 years into the future
by the global warmunists.
You must seize the data that support
your theory, and ignore everything else
— that’s how “modern” climate science works!
My climate change blog.
Common sense — no climate predictions:
http://www.elOnionBloggle.Blogspot.com
Willis,
“As you can see, there is no obvious sign that the solar minima have caused any change in the temperature. Some go up, some go down, some go nowhere.”
That is the sane problem the IPCC has, just assuming CO2 is the main cause. Seems to me you have to consider all the causes at once in order to sort out how much is due to the sun. For example see Prof Akasofu.
aashfield March 20, 2018 at 11:29 am
Hey, aashfield, I’m not the one making the claims like “It’s the sun, stupid” and claiming that the solar variations make visible, significant changes in the temperature record.
That would be Javier et al. Please direct your complaints at them.
w.
I was talking to someone today about the recent snow we have had in Lincoln UK and he told me that in the winter of 1947 they had snowdrifts 14ft deep just outside Lincoln and that he remembered walking along the tops of double decker busses covered by the snow, those trying to free the busses bought a snow blower from the USA to try and free them but it did not work the wind blew the snow back as fast as the blower moved it away. the years :1947, 1963 , 2010 and 2018 were all around the time of solar minimums this seems to be more than coincidence here.
Donald, “science by anecdote” is no better than “science by assertion”. Making such a claim based on 4 anecdotal observations is … well … let me call it unsupported and leave it there.
If you’re interested, there’s a good analysis of the level of UK snowfalls since 1875 here.
And because I’m someone who actually does the hard yards, finds the data and runs the various analyses, I can tell you that the correlation of British winters with sunspots is abysmally low, R^2 = 0.006, p-value = 0.34.
In other words, sorry, but what you saw IS coincidence.
w.
The incidences of arctic SSW correlating with a quiescent sun is pronounced. SSW events are a significant precursor to European and North American cold and snow. There is nothing anecdotal about the correlation.
willybamboo March 20, 2018 at 2:34 pm
Sorry, Willy, but until you provide a link to a study it is absolutely anecdotal.
w.
The lack of correlation of UK winters with sun spots could be caused by the fact that the UK and northern Europe plus Eastern USA has warm periods and cold periods, we have had a warm period from the eighties to the beginning of this century roughly and now we seem to be entering another cold period which seems to be linked to the decline and stabilisation and perhaps future increase in Arctic sea ice extent. During a very cold period a long time ago the place where I live was covered by glaciers so you have to take these changes into account.
https://www.weatherbell.com/images/imguploader/files/Hurd_Willett.pdf
Good luck willis – if you aren’t a subscriber to weatherbell you may not get to the Willett paper. Call Joe D’Aleo if you need help
willybamboo March 20, 2018 at 6:01 pm
Sorry, but I find that paper totally unconvincing. It’s from 1974, which is not a bad thing but is likely why it is totally innocent of any mention of autocorrelation. That means his statistics are garbage, particularly because of his chosen analysis method which actively increases autocorrelation.
There is also no mention of the Bonferroni correction, which means that his statistics are double garbage.
Finally it is using a totally outdated sunspot dataset. Now to be fair at the time it was state of the art … but then that was nearly half a century ago.
Now, if you don’t know how to correct statistics for autocorrelation and you have never heard of the Bonferroni correction … well, perhaps some further study might be indicated before you comment on the subject or recommend such studies.
And if you do know how to correct statistics for autocorrelation and you have heard of the Bonferroni correction … then why on earth would you recommend this study?
My best regards to you,
w.
Denying the forest because you think someone miscounted the trees is myopic. The spectacular arctic SSW event that has driven the recent nor’easters and the “beast from the east” in Britain was forecast with uncanny accuracy by weatherbell analytics (Joe D’Aleo & Joe Bastardi) Key to the SSW forecast was low solar and an east QBO. NOTHING validates a correlation better than its efficacy in forecasting.
Oh, yeah, Willy, one final thing. You made a claim about “SSW”, sudden stratospheric warming … but the link you put up to support the SSW hypothesis says exactly zero about SSW …
w.
willybamboo March 22, 2018 at 3:35 am
Provide a link to their “uncanny” forecast and I’m glad to discuss it. Or not, up to you, but I’m not going on a snipe hunt based on your vague handwaving.
w.
willybamboo March 20, 2018 at 2:34 pm
As I mentioned, I’m the guy who does the hard yards, gathers the data, does the analysis, and writes it up. I don’t believe a study until I’ve run the numbers myself. Interested by Willy’s anecdote, I went and got the data on all of the large Sudden Stratospheric Warming (SSW) events from January 1958 to January 2013. It’s available here. There have been 41 such events, which was an immediate red flag due to the small number of warming events.
Undeterred, I compared the distribution of the sunspots at the time of the 41 events with the distribution of all sunspots for the whole period. Here’s that result:
As I had feared, with only 41 events, the 95% confidence intervals are far too large for any conclusions to be drawn. (Confidence intervals have been adjusted with the Bonferroni correction because we are looking at more than one trial.) In any case, it is clear that there is no sign of “SSW correlating with a quiescent sun” as Willy claimed.
Anyhow, once again a beautiful theory has run aground on a reef of hard facts …
w.
As I have said lag times have to be factored in along with countless other factors such as the strength of the geo magnetic field, the given state of the climate, the degree of magnitude change and duration of time of the weak geo/solar magnetic fields, the locations of the south and north magnetic poles, the surrounding space environment (super nova in vicinity which would increase galactic cosmic rays) when magnetic fields are weak, Milankovitch Cycles ,where we are in respect to them, land elevation and land and ocean arrangements.
Then you have the threshold argument which is what combination, what degree of magnitude change and duration of time is needed to bring the climate to that threshold of change against the back drop of Milankovitch Cycles , land and ocean arrangements , the given state of the climate (how close or far is it from the interglacial/glacial tipping point . This meaning the closer the climate is to this intersection the less forcing would be needed to bring the climate to a threshold.
Then you have had at times the rogue asteroid impact which would upset the whole climatic system and put things into chaos and have climate correlations at these times be thrown out the window.
I will say it again IF solar/geo magnetic fields weaken enough in tandem and for a sufficient duration there is going to be a climatic impact.
I think we may have it at tis point of time. We will see.
So trying to show x change in x something is going to give an x climate result does not work unless all the factors I have mentioned are incorporated into the picture, and even then the degrees of magnitude change and duration of time needed to change the climate at a given point in time will always be different due to the other factors I mentioned.
I am positive it has to be the combination of all the things I have mentioned that must impact the climate because if it is not these items what is it????
When I say I think we may have it in this point in time ,what am I saying is I think this year and the succeeding few years is going to put AGW theory under pressure because at best for them temperatures will stay where they are, much less decline from here which is what I believe.
Going out a few years later say to 2025 it is going to depend on how weak the solar/geo magnetic fields have been and are at that time. I do not have the answer other than the trends are weakening for both fields with the geo magnetic field fading rapidly but still not that weak by historical standards but the decline has been dramatic and continues as of now. It will become weak by historical standards if this continues and the [N. MAGNETIC] POLE is now racing toward Siberia, while the South Magnetic pole now in the Indian ocean is moving North.