UPDATE: 3/13/18 After review of comments, data sources, and the article itself, I have concluded that because some old and faulty data was used in the article, the premise and conclusions are not accurate, and therefore this article should be ignored due to the use of the faulty data. If at such time the article is revised by the author (Archibald) to include updated data, this article will be deleted, and a new one put in its place.
– Anthony Watts, publisher, WUWT
Guest essay by David Archibald
This recent post discussed the end of the Modern Warm Period and the year that global cooling began. That post was inspired by a comment to a post on WUWT six to eight years ago to the effect that climate is controlled by the Sun’s magnetic flux – no need to worry about much else. The comment seemed to come from a warmer scientist – they are well funded, have plenty of time on their hands, some are smart and idle curiosity would get a few looking into what controls climate. The results would not be published of course. To paraphrase Mussolini, everything within the narrative, nothing outside the narrative, nothing against the narrative. If the Sun’s magnetic flux controls climate, you don’t have to worry about what goes on under the hood – the effect of EUV on the NAO, the GCR flux, the F10.7 flux, any other flux apart from the magnetic flux.
A comment by Bellman on that recent post inspired me to process the aa Index data a bit further. This is what the aa Index looks like from the beginning of recording in 1868:

Figure 1: aa Index 1868 – 2018
The end of the Modern Warm Period remains December 2008 which is the month of the Solar Cycle 24/25 minimum. The beginning of the Modern Warm Period is now September 1933 which is the month of the Solar Cycle 16/17 minimum. That is the true beginning of the Modern Warm Period because of what is evident from this graph:

Figure 2: Cumulative aa Index against long term average 1868 – 2017
It is evident from Figure 2 that 1933 marked the reversal in the trend of the cumulative aa Index plotted against its average. The Sun was running a lot hotter from 1933.
That interpretation is supported by the longer term Open Solar Flux data set by Lockwood:

Figure 3: Open Solar Flux 1676 – 2011
The Maunder Minimum, the Dalton Minimum and the 1970s cooling period are evident from Figure 3. The lows in Lockwood’s flux during the Modern Warm Period remained higher than the average of the period from the Dalton Minimum that preceded it. Once again, plotting up the cumulative data of this series makes the break in trend evident:

Figure 4: Cumulative Open Solar Flux 1676 – 2011
Confirmation that 1933 is the beginning of the Modern Warm Period comes from the climatic response, starting with glaciers:

Figure 5: Curves showing the variations of glacier termini
Figure 5 is from page 15 of Ahlmann’s 1953 report to the American Geographical Society entitled Glacier Variations and Climatic Fluctuations. Glaciers in Sweden, Norway and Iceland started retreating a lot faster from about 1933. So did glaciers on the opposite side of the planet:

Figure 6: Glacier length South Island of New Zealand
Figure 6 shows that three of the four glaciers on New Zealand’s South Island started retreating about 1933. If a lot of glaciers started retreating around 1933 that should be evident in the rate of sea level change. And so it is:

Figure 7: Global Sea Level 1700 – 2002
Figure 7 shows that sea level was effectively flat from around 1900 to 1933 then took off from 1933. Now that the Modern Warm Period is over, glaciers should have stopped retreating and should now be bulking up. There is evidence for that starting with the Greenland Ice Sheet:

Figure 8: Accumulated Surface Mass Balance for the Greenland Ice Sheet
The blue line is the 2016 – 2017 season which was at the upper bound of accumulation from 1981 to 2010. The Greenland Ice Sheet is back to putting on weight and that is coming out of the oceans. Figure 9 shows where the weight went on, all 544 billion tonnes of it:

Figure 9: Map of accumulated anomaly since September 1, 2016.
The readouts are in the blue – Greenland, on balance, is now a story of ice accumulation. Other climatic evidence for the end of the Modern Warm Period is the plethora of cold temperature records set in the United State and Europe in early 2018, including sharks freezing to death.
David Archibald’s latest book is American Gripen: The Solution to the F-35 Nightmare
I think that the current Warm Period has another several centuries to run its course. I do think that we are in a cool trend now, but that is a 30+ year trend, which ends in the mid to late 2030s, from my perspective. Then there is this very interesting correlation between the Southern Magnetic Anomaly, and major quakes on the Cascadia Fault Zone.
A new study places sudden magnetic field directional shifts at 400/450, 750/800, and 1250/1500 AD. Cascadia major quakes for the same timeline are 400, 810, and 1310 AD. Is this what causes the Cascadia quakes, sudden directional shifts in the magnetic field? Lastly, the spacing between events is the same spacing as exists between Warm Periods, and Cool Periods/Dark Ages. That is one big stack of coincidences.
The last Cascadia quake was in 1700. That is the date which I would regard as the end of the 400 yr cool period. That means that there should be approximately 500+ years of a warm period. That is why I place the end of this current warm period at 2200 AD +/- 50. The fact that we are still in a warm period would mitigate the cooling power of a solar cycle induced cooling, imo.
An interesting note to this is that in reading further regarding magnetic field sudden directional shifts the data states that there was also a shift which started around 1650. So here is another correlating fact in this picture. The magnetic fields starts to shift. Shortly after, in terms of multiple decades, the Cascadia Fault unleashes a 9 +/- magnitude quake. Thirdly the climate is now shifted either to a warm or cool trend.
The warm trends look to be 500+ years in length vs around 400 for cool trends, but is this due to the time it takes for the warm trend to give way fully to the cool trend? What effects does the 9+ quake in the eastern Pacific have, which comes after the change in the magnetic field?
“The end of the Modern Warm Period remains December 2008 which is the month of the Solar Cycle 24/25 minimum. ”
David,
You need a correction:
December 2008 was SC23/24 minimum. Not 24/25, which is in about 2 years from now.
Hard to get past the rest of what you wrote after that.
Joel, I don’t know if you have read Schopenhauer on Buddhist philosophy, but what you found was the deliberate mistake in the piece. Because sometimes things that are too perfect are an affront to God. We show our humility by including them.
Please leave the religious gobble-d-gook out of a science post. That is, if it is a science post.
Furthermore, I take it peer review is not one your strong points. Try that line on a peer review critical comment on a manuscript and see how far that goes with the editors.
You don’t need to do it every paragraph.
I find the use of one year’s data to show net ice accumulation in Greenland annoying. How does it compare with other years? As it is presented it’s natural variability.
SARA:
“If it’s too wet for hard red winter wheat to ripen and dry properly, it won’t be harvested until weather conditions have allowed it to dry properly. If that goes into August, it delays planting the next crop.”
Would like to correct you here. If it is too wet, the crop rot in the field or be too poor in quality or yield and will not be harvested. Harvest in Kansas typically starts in late May or early June and is done by mid July. Planting winter wheat is done in October or early November. The range of winter wheat is from Texas to the Dakotas. Further north into Canada, they plant “spring wheat” ie. plant in spring and harvest in fall. Winter wheat will also winter kill if the it is too cold without snow cover to protect it. The region (in the USA) where it is typically planted is large enough that weather variations would not destroy the whole crop, though Kansas has had the bulk of the crop.
Not sure where you are located, so your local experience may vary.
If tsi changes are not relevant to climate then diurnal cloud changes might explain heat storage over time, particulary in the oceans. More clouds in daytime, less clouds at night should=heat dissipation and vice versa. One small sample study, over Hawian Islands shows just that. Anyone aware of a compendium of data on diurnal cloud cover on a larger area longer term basis? Long term diurnal variation could give a partial answer though the ocean’s storage and later dispersal mechanism would additionally explain more.
“Nighttime cloud cover frequency was lower than afternoon cloud cover throughout the year and lower than morning cloud cover frequency for most of the year.”
AMS
An Assessment of Diurnal and Seasonal Cloud Cover Changes over the Hawaiian Islands Using Terra and Aqua MODIS
Mallory L. Barnes+ and Tomoaki Miura
Department of Natural Resource and Environmental Management, University of Hawai‘i at Mānoa, Honolulu, Hawaii
Thomas W. Giambelluca
Department of Geography, University of Hawai‘i at Mānoa, Honolulu, Hawaii
* Supplemental information related to this paper is available at the Journals Online website: http://dx.doi.org/10.1175/JCLI-D-15-0088.s1.
+ Current affiliation: School of Natural Resources and the Environment, The University of Arizona, Tucson, Arizona.
Corresponding author address: Mallory L. Barnes, School of Natural Resources and the Environment, The University of Arizona, 1064 East Lowell Street, Tucson, AZ 85721. E-mail: mallorybarnes@email.arizona.edu
Journal of Climate
Vol. 29: , Issue. 1, : Pages. 77-90
(Issue publication date: January 2016)
Received Date: February 2, 2015
Final Form: October 1, 2015
https://doi.org/10.1175/JCLI-D-15-0088.1
Since the beginning of your post uses the term Aa Index without defining what that might be I looked it up on Google and got Amino Acid Index. Huh? Excuse m for being ignorant.
The aa-index is a simple global geomagnetic activity index. It is derived from the K indices from two approximately antipodal observatories and has units of 1 nT. Current observatories used are Hartland in the UK, operated by BGS and Canberra in Australia, operated by Geoscience Australia.
Since it is based on data from only two observatories, it is the simplest of all the 3 hourly planetary indices. However, provided averages over 12 hours or longer are used, the index strongly correlates with the ap and am indices, which are derived using data from more extensive observatory networks.
The main advantages of using aa indices are that the time series spans further back (to 1868) than any of the other planetary index time series; and also up-to-date values are produced and made available on a weekly basis.
http://www.geomag.bgs.ac.uk/data_service/data/magnetic_indices/aaindex.html
These plots present time series (updated daily) of the current amount of water stored by the seasonal snowpack (cubic km) over (a) Northern Hemisphere land areas (excluding Greenland), (b) North America, and (c) Eurasia. Snow depth from the CMC analysis is converted to snow water equivalent using a density climatology obtained from snow survey data. The time series average and range between ±1 standard deviation (calculated for 1998/99 to 2011/12) shows how current conditions compare to historical variability.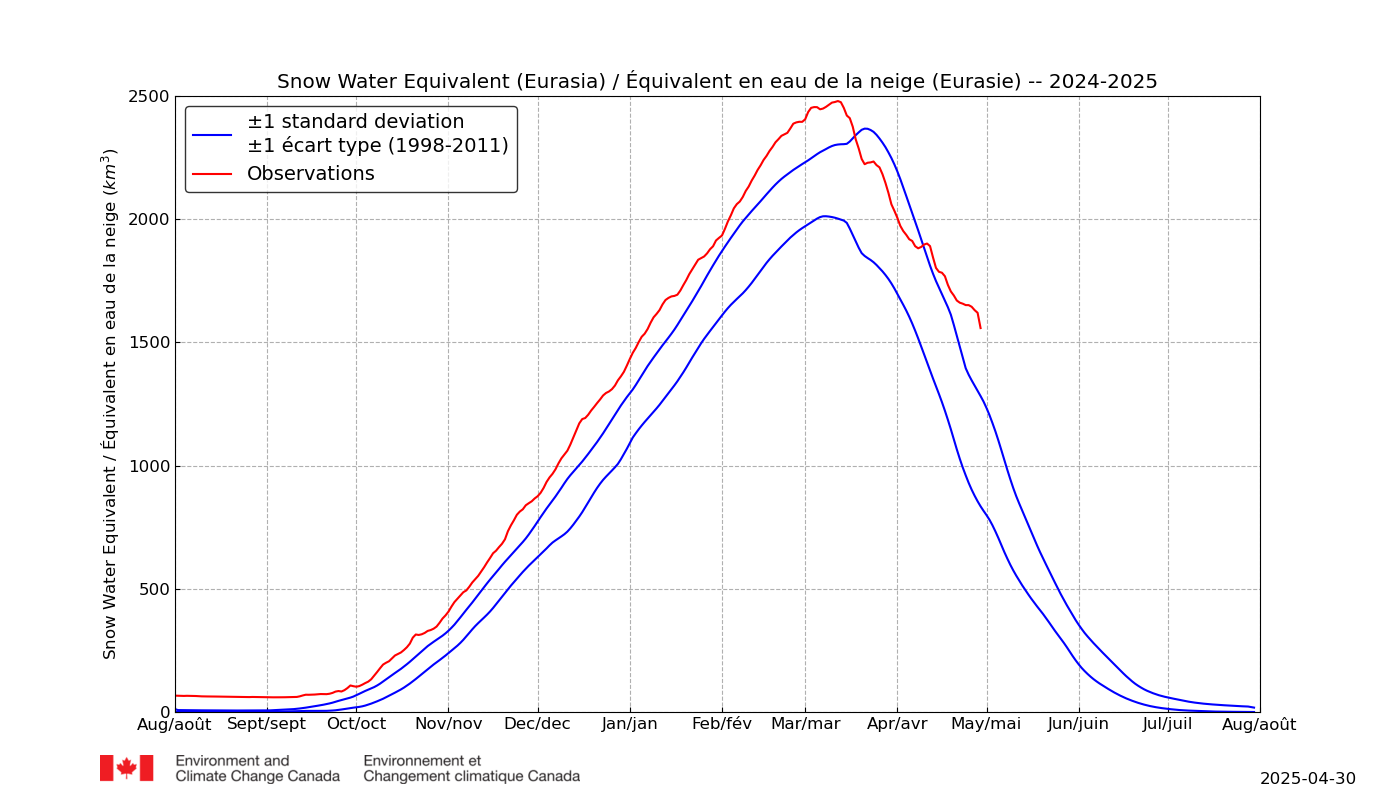
Sorry.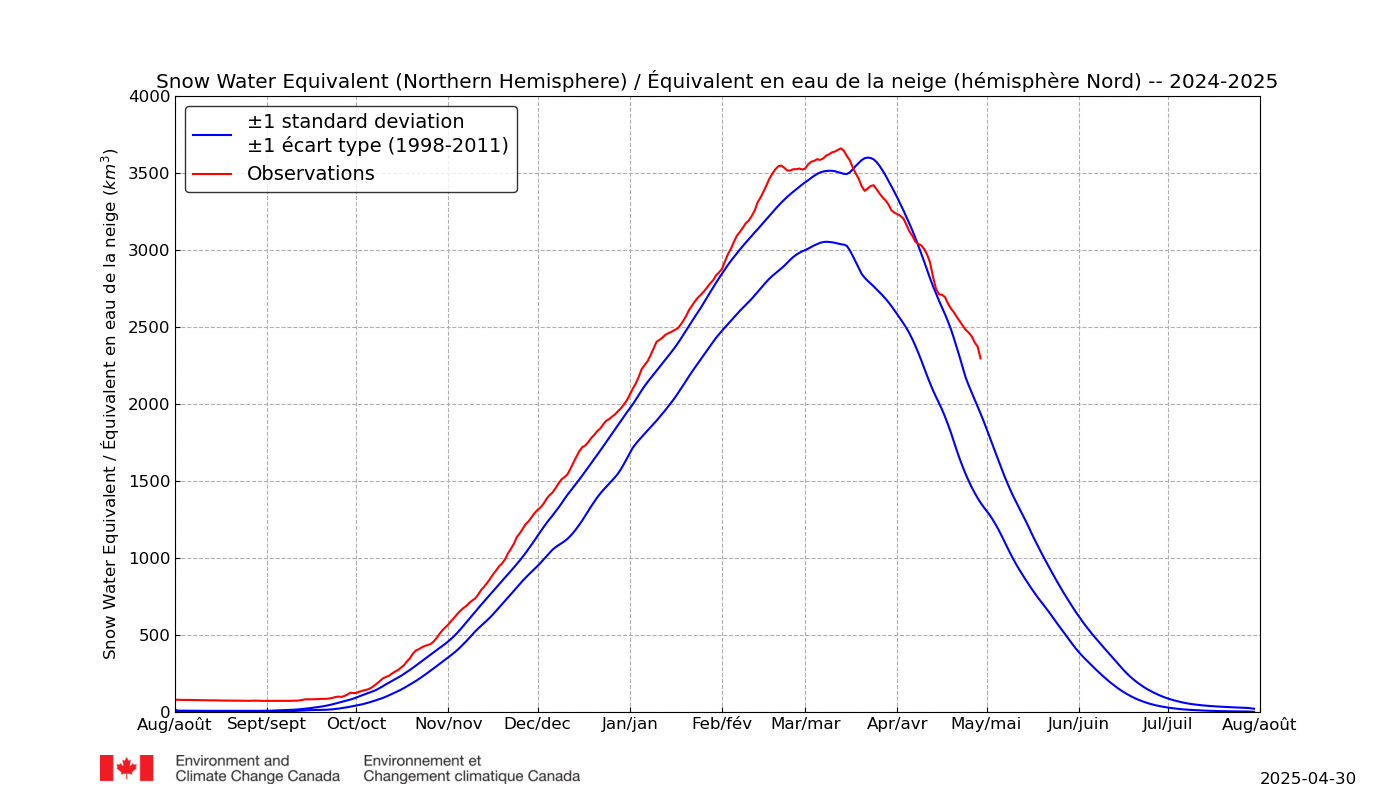
These plot present time series (updated daily) of the current amount of water stored by the seasonal snowpack (cubic km) over North America.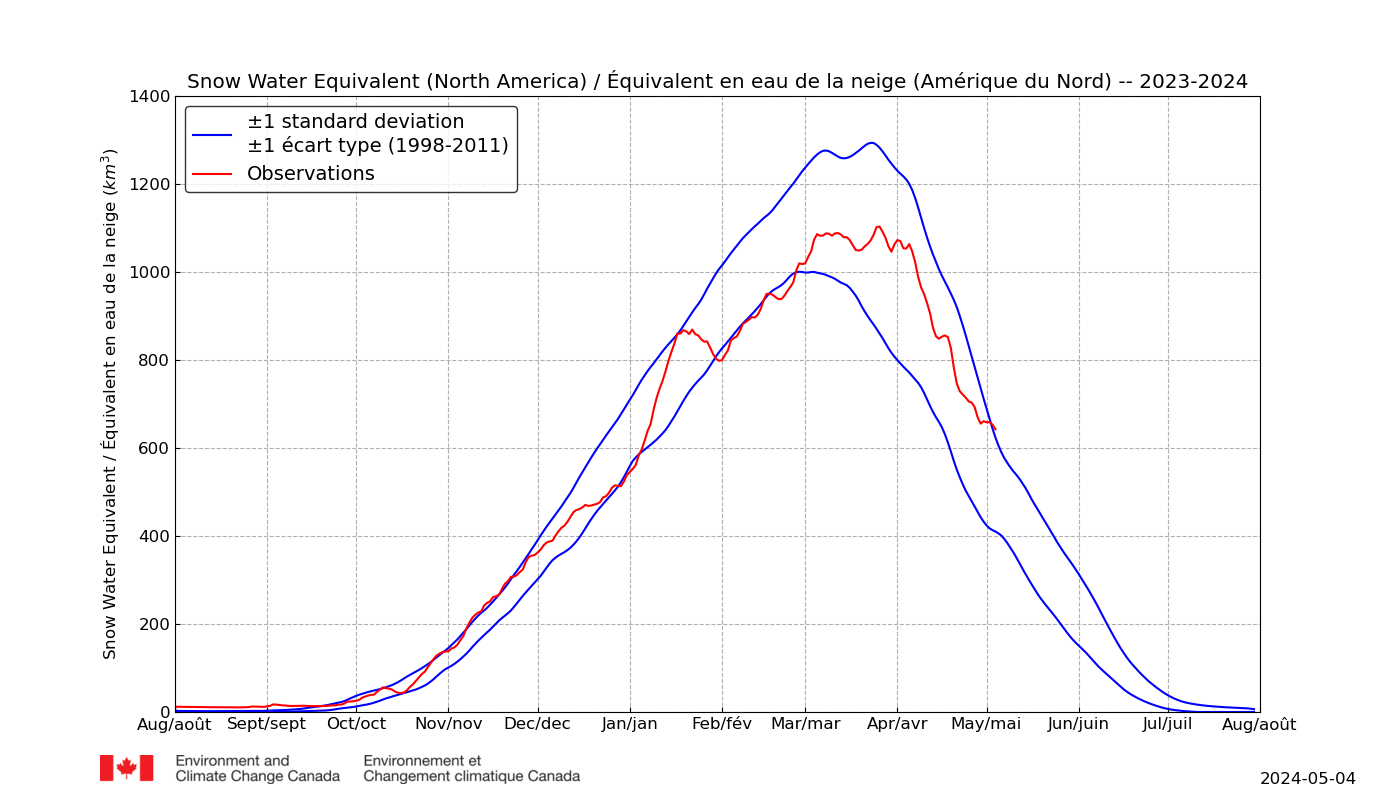
looks like they may have to make the snow water equivalent charts bigger to accommodate all the warming ren 😉
Ren, What is the web address for these charts please? I sought but did not find.
This is the address of the page: https://www.ccin.ca/ccw/snow/current
Snowstorm in Kentucky and West Virginia.
http://files.tinypic.pl/i/00960/kkjti4rkvwfl.png
The extent of sea ice in the Arctic has increased.
Still frost and snow over the Great Lakes. This is shown by the height of the tropopause (lowest temperature between the troposphere and the stratosphere).
http://pics.tinypic.pl/i/00960/4hi4pr6as3ri.png
Actually Newton did not suggest a mechanism [https://en.wikipedia.org/wiki/Hypotheses_non_fingo]. That had to wait for Einstein.
NOTE: After review of comments, data sources, and the article itself, I have concluded that because some old and faulty data was used in the article, the premise and conclusions are not accurate, and therefore this article should be ignored due to the use of the faulty data. If at such time the article is revised by the author (Archibald) to include updated data, this article will be deleted, and a new one put in its place.
– Anthony Watts, publisher, WUWT
The right choice.