Guest essay by David Archibald’
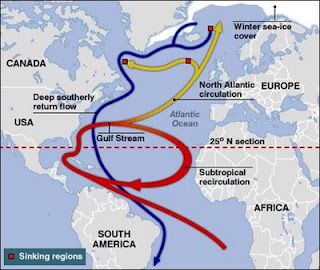
Many good things come to an end and that includes the Modern Warm Period. Mild winters and early springs are now spoken of in the past tense. The peak of the Modern Warm Period was 2006 as shown by the oceanic lead indicator, the Gulf Stream, also called the North Atlantic Current. From Professor Humlum’s site, Figure 1 following shows the Argo data from a transect south of Iceland from 2004:

Figure 1: North Atlantic Current temperature 0 – 800 metres depth 2004 – 2018
The North Atlantic Current has cooled by 1.0°C to date since the peak in 2006. Figure 2 following incorporates data from the same region back to 1955:

Figure 2: North Atlantic Heat Content Anomaly 1955 – 2017
This figure shows that the North Atlantic Current has to date lost half the heat content it gained from the early 1980s.

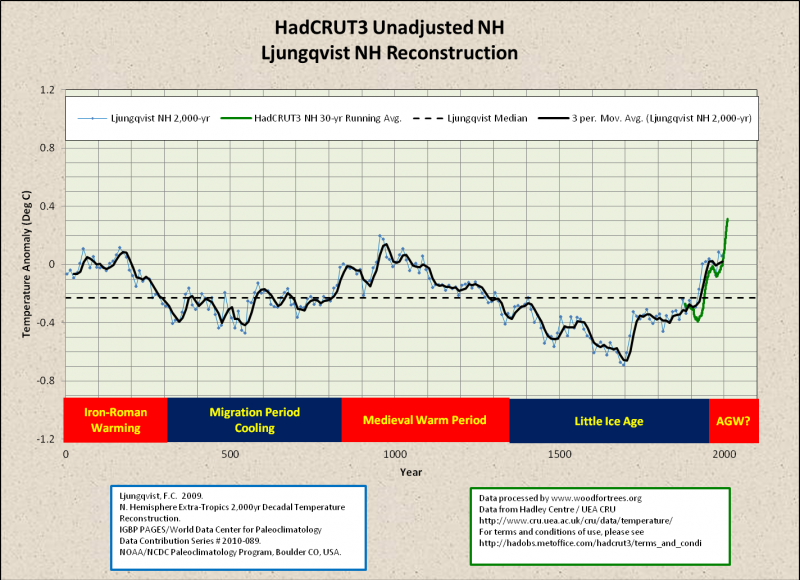
Figure 3: Central England Temperature 1659 – 2017
This is the longest thermometer record on the planet with nearly 360 years of data. There is not much evidence for the Modern Warm Period on this graph with temperatures of the late 20th century only slightly above those of early 18th century, 300 years ago. The running average from Figure 2 is plotted in red (data courtesy of Professor Humlum). It is evident that the heat content from the North Atlantic Current caused the milder winters of recent memory. The R2 of the relationship is 0.3935.
What caused the Modern Warm Period to begin with? Cliver noted in the 1998 that “During the past ~120 years, Earth’s surface temperature is correlated with both decadal averages and solar cycle minimum values of the geomagnetic aa index. The correlation with aa minimum values suggests the existence of a long-term (low-frequency) component of solar irradiance that underlies the 11-year cyclic component.”
The aa Index starts in 1868 as shown by Figure 4:

Figure 4: aa Index 1868 – 2018
The end of the Little Ice Age is evident in 1900 as that was the year that aa Index started rising until the 1950s. From the 1950s there was a slight uptrend culminating in the peak of 2003. The aa Index then plunged back to levels characteristic of the Little Ice Age. The end of the Modern Warm Period was in 2009 at the Solar Cycle 24/25 minimum.
There is a lag between the aa Index and temperature of the atmosphere due to the damping effect of the thermal inertia of the oceans. Plotting the aa Index against the NOAA Northern Hemisphere temperature anomaly, peak correlation occurs with a lag of six years as shown by Figure 5:

Figure 5: aa Index plotted against Northern Hemisphere temperature anomaly lagged six years 1880 – 1995
The aa Index during the first half of Solar Cycle 24 averaged 13.1. The three years up to 2018 were higher at an average of 20.6. According to the relationship shown by Figure 5, the pulse of heat from the higher aa Index of the last three years will cause higher temperatures out to 2023.
So far in 2018 the aa Index has averaged 13.0 and should continue to weaken into the Solar Cycle 24/24 minimum expected in 2020. From the beginning of the aa Index record in 1868 to the end of the Little Ice Age in 1900, the aa Index averaged 15.4. It averaged 20.9 for the Modern Warm Period. For the Modern Warm Period not to be over, the aa Index would have to average over 20.0. That eventuality has a low probability given the way the Sun is behaving.
David Archibald’s latest book is American Gripen: The Solution to the F-35 Nightmare
“The R2 of the relationship is 0.3935.”
Four significant figures for something that, at best, explains less than 40% of the variance in the independent-variable is unwarranted. It looks impressive, but doesn’t really mean much. A bit like carrying pi out to 4 significant figures to calculate the circumference of a bicycle tire when the diameter is only known to the nearest foot.
I meant to say “dependent” variable.
Almost as bad as NOAA reporting CO2 concentration to hundredths of a ppm. https://www.esrl.noaa.gov/gmd/ccgg/trends/
Or NOAA’s use of joules instead of celsius for ocean temperatures.
We shouldn’t count our chickens before they are hatched – the previous warm period lasted about 400 years whereas this present period has not even 300 years behind it. Wait and see – we simply don’t know.
Agreed.
Damn the warmists, I’m not rooting for colder climate , I think the current “optimum” is rather nice.
No, fig 5 does not show that peak correlation occurs with a lag of six years. Fig 5 shows a scatter plot assuming a lag of a six months. Try plotting cross-correlation fn. to show where the peak actually lies.
David, please contact Josh Willis, he will quickly identify the “defective” ARGO floats and have them removed from the record. He was the first to detect a global lowering in ocean temperatures in 2006 but was then told to ‘get with the program’ and selected a batch of XBTs that were giving the “wrong” answers. There was not attempt to detect whether any other series was also giving abnormally high readings and also needed removing, neither was there any analysis of the geographic range of the “defective” instruments to see whether the anomalously warm water may be a regional warmth.
We’re about 400 years into this warm period.


The Holocene has exhibited a pervasive millennial quasi-periodic fluctuation: 500-yr alternating periods of warming and cooling.
You’re right- sometimes the correct answer is “we simply don’t know”. Unfortunately the warmers just say anything bad or unusual is positively the result of climate change with no proof or even evidence.
Trying to forestall complaints from people who say there is not enough precision. Three significant figures might be the optimum.
Excellent!
This article is a keeper..
I count 20 significant cooling trends in the 250 years graphed in Figure 2.
I remain unconvinced (and I’m a skeptic).
…358 years…
As a true sceptic you should remain unconvinced. We are the ones who are interested in what is not certain.
Both the aa-index [which by the way is wrongly calibrated by being 2 to 3 units too low before 1957] and solar activity have generally declined the last half century while temperatures have risen, so the relationship that is claimed has not held up the last half century. Therefore the conclusion is likely spurious.
Maybe even a 30-year average is too short for climate trends. 30 years is close to a “generation”, or a short-time memory span in the illiterate.
Your conclusion is spurious. A warm AMO is normal during a solar minimum.
A warm AMO is normal during a solar minimum.
Solar minimum occurs every 11 years. The AMO has a [quasi-] period of 60-70 years…
So your claim cannot be correct.
Centennial solar minimum, not sunspot cycle minimum.
Centennial solar minimum, not sunspot cycle minimum.
Nonsense. The centennial solar minimum was in the first few cycles of the 20th century when the AMO was in a cold phase:
There is no relationship between long-term solar activity and AMO as everybody can see.
Drivel. The Gleissberg Minimum was mostly in the late 1800’s while the AMO was warm. Solar cycles 12 and 13 were not in the 20th century.
The Gleissberg Minimum was mostly in the late 1800’s while the AMO was warm.
The Gleissberg Minimum consisted of the five cycles 12-16 with cycle 14 {max in 1905] being the lowest. The AMO was generally cold [blue] during that time:
http://www.leif.org/research/AMO-SN-Not.png
but more precisely: there is no correlation between the AMO and the sunspot number that should be evident to everybody.
That’s the second time I seen someone blag that the Gleissberg Minimum was only in the 20th century, Javier tried that on too. But this is the very first time I have seen the claim that it was five solar cycles long. It’s nonsense, it ended at SC 14, and the weather and climatic influence of the minimum was only apparent in cycles 12 and 13. You just make stuff up as you please. And you never once admit where you have been proved wrong.
“but more precisely: there is no correlation between the AMO and the sunspot number that should be evident to everybody.”
Because it’s to do with solar wind conditions and not sunspot number.
Because it’s to do with solar wind conditions and not sunspot number.
The solar wind varies with the solar cycle. Here is the variation of the solar wind magnetic field [and the sunspot number] over the past 300+ years. The Gleissberg minimum in SC14 [1905] is clearly defined.
http://www.leif.org/research/HMF-B-Floor-45-SSN.png
“The solar wind varies with the solar cycle.”
More drivel, the solar wind strength was anti-phase with solar cycles during the last cold AMO phase. The solar wind was very fast and high pressure through the early to mid 1970’s. You don’t debate honestly, you engage in continual obfuscations.
the solar wind strength was anti-phase with solar cycles during the last cold AMO phase.
The solar wind speed [your ‘strength’ is undefined] is always high during the declining phase of every solar cycle. Magnetic field is high at solar maximum. No ‘antiphase’ anywhere.
last cold AMO phase
More correct would be that there is no cuasal correlation between solar wind and AMO.
I couldn’t agree more with this comment. the relationship between the sun and the temperatures appear to be inversely correlated, as temps have increased in the last decade, at the time when the Gulf Stream has decreased. There are other factors going on that need to be considered, my opinion is that the heat is being stored for much longer and then released.
The Gulf stream has not decreased, North Atlantic and Arctic warming is normal during a solar minimum.
Figure 2 appears to indicate Central England temperature accurate to (at least) tenths of a degree. Ridiculous.
Those look like annual averages to me. Would you have them rounded to the nearest degree?
As so many others have asked on this site (which is probably more scientifically rigorous than most other general sites), I would at least like to see error bars.
Hypothetically, a +/- 1 degree error bar makes Figure 2 look somewhat less interesting.
Using 12 years of data to claim “cooling started in 2006” is just silly (and, again I’m a severe skeptic of CAGW, or whatever we’re calling it this week).
They are averages, not individual measurements. You can’t ‘measure’ temperature on an annual basis with a thermometer. As such, the avg temp to a 10th of a degree is not an indication of either accuracy or precision, it is a byproduct of the math.
ex – average 10 whole numbers [ 25,30,75, 83, 14, 97, 105, 46, 51, 21]/10 = 54.7
One can carry the decimal point out as far as one wants, but the calibration of the instrument determines the precision of the measurement, and its error. In this case, since the temps are given as whole numbers, the average would be 54.7°C ±0.5°C.
yes DC. very few people here at wuwt get that simple point.
In order to determine the total potential error, wouldn’t we need to also know the error of each reading?
is the 25 actually 25 or is it 25+/-5 ?
is the 30 actually 30 or is it 30+/-2 ?
etc.
DC Cowboy:
I actually have 4 problems, including 1 self-inflicted:
1) I misidentified the chart I’m concerned about as Fig 2; it’s actually fig 3 – Central England Temperatures 1659-2017 (my bad)
2) The chart starts in 1659 – my understanding is mercury & alcohol thermometers were not invented until the early 1700’s (ie different technology concatenated to make a continuous temperature record?)
3) I understand Mosher’s point about “averages” of individual numbers; however, unless there was one and only one temperature measurement for each period (highly unlikely), we’re really talking averages of averages. That’s a problem.
4) Just by eyeball, 90%+ of the roughly 4,296 data points (358 years x 12 months = 4,296) fall within the 8-10 degree band – each 1/10th degree may represent a 5% error (larger in narrower-band periods).
Error bars, error bars, error bars: not a silver bullet answer, but the reader at least has an idea what they’re working with, and yea, error bars can be difficult to produce, especially with different technologies & presumably, many different thermometers.
Well yes, the warming of the late 20th century was so slight (but got so many people upset) that if we didn’t have instruments we wouldn’t have been aware of it at all. The UAH temperature is only 0.2 degrees C higher than its long term average. And that is over 40 years. Thankfully the MET office provides the CET data to 0.1 degree. If we didn’t have that precision, we would not have known that the warming had happened.
Ignoring, of course, that precision without accuracy is useless.
Which is one reason Javert,above, asks for error bounds. Of what use is 0.1° precision when accuracy is plus or minus 1.0° to 2.0°, at best.
The Northern Atlantic and Europe is just one part of the world. I know you guys have just had a very cold winter, but in NZ where I live we’ve just had a really hot summer; so what makes recent trends in your part of the world more significant than recent trends in mine. To me at least so far it all just looks like weather.
As for the solar minimum stuff, I remain sceptical about the proposed mechanism. It’ll be very interesting to watch what happens over the next decade as the minimum progresses; assuming that the sun doesn’t change its mind about having a minimum and unexpectedly burst back into activity. But right now I think it is too early to be drawing conclusions.
Here in Western Australia it has been a cool summer.
We just experienced the coolest summer I can remember in at least three decades in north Queensland, and lower than ‘normal’ humidity.
March-April 2016 and summer 2017 were terrible, but 1998 was worse.
It isn’t only there. All of the Southern Hemipshere land masses have been mainly average to slightly below average through the entire summer. With the exception of NZ benefitting from warmed ocean waters and favorable surface winds.
My tomato crop has been non-existant. Nothing. Nada. No tomatoes. Did I say there were no tomatoes? No tomatoes at all. Nothing in the way of a tomato crop. The tomato plants themselves look healthy enough. They stare at me and I stare at them. Doesn’t make any difference. No tomatoes. Tomorrow I will go off in seach of clays to add to my too-sandy soil. I have hear rumours of a deposit of black montmorillic clays 150 km south of Perth. A desperate man will go to any lengths. Otherwise I am contemplating mounting an expedition to an iron ore mining region 500 km northeast of here to get some nice high-iron clays.
http://www.bom.gov.au/web03/ncc/www/awap/temperature/meananom/month/colour/latest.gif
archibaldperth – March 4, 2018 at 3:40 am
Archibald, a “healthy” looking tomato plant doesn’t mean it will produce tomatoes.
1st of all, it has to be a “blooming” tomato plant to do that, ….. and 2nd’ly, the “bloom” of the “blooming” tomato plant has to be cross-pollinated before the fruit will develop.
Then, of course, there’s also Miracle Gro at most gardening centers
https://www.miraclegro.com/en-us/products/plant-food-care/miracle-gro-water-soluble-tomato-plant-food
@ur momisugly archibaldperth…try using grow bags, and countersink the growbags partway into the ground. That way you can build the entire soil so that everything is there at the beginning, just add water. Grow bags are highly efficient water users when used as described.
archibaldperth,
If you haven’t add calcium (garden lime, egg shells, oyster shells, etc., whatever you have available).
David,
Plant a fish head with you tomatoes and they will soon bloom!
@ur momisugly zazove, temp is but part of the picture, the real story was low humidity and deep blue sky. I was getting cracked lips and bleading nose in Dec, Jan and Feb, due to dry cooler air from blocking highs.
This NEVER happens in summer in NQ during my lifetime, except for this 2017-2018 summer. This is memorable.
With March we finally got persistent humid northerly and rain … thank goodness.
@ur momisugly archibaldperth, …. plant a couple rocks at the roots of your tomatoes and they will keep the roots “warm” during those cool/cold nights in Australia.
You have to jiggle tomato plants. Did you jiggle them?
The reason why NZ warmed is readily apparent though. …https://earth.nullschool.net/#current/wind/surface/level/overlay=temp/orthographic=176.42,-41.98,1107/loc=50.927,-79.800
It’s only one city in New Zealand, but the GHCN records for Christchurch the past three Februaries say that 2016 was on average warmer than 2017 or 2018 (77°F/25°C vs. 73°F/23°C and 73°F/23°C)
Sounds like a lovely summer to me; a bit cool for my tastes, though.
I grew up in San Francisco, cool was the norm. I suppose that is partly why I like living in the mountains. NZ looks like beautiful country, parts of it at least.
“The coldest winter I ever experienced was a summer in San Francico” (Mark Twain)
The not so fun part of that was when you got out of school in early June the fog would typically roll in for most of the summer. I think that it was the summer of 1959 where the Sun shone for the entire summer. That was the only summer like that, until the mid 1970s, when the warming trend took off.
Leif, Apparently Mark Twain did not say it, but said something similar about a time he was in Paris and he was paraphrasing someone else’s joke. I swear I saw it in something William Saroyan wrote but he did not originate it.
https://www.anchorbrewing.com/blog/the-coldest-winter-i-ever-spent-was-a-summer-in-san-francisco-say-what-says-who/
https://quoteinvestigator.com/2011/11/30/coldest-winter/
since I live about there, I’ll say it without trying to give credit to somebody else.
Instead of spring here in the Mojave Desert of Palmdale, CA we are now having winter, which was supposed to be in December. Freezing temps to 25 F when normally that is Nov-Dec temps. Little higher elevations all had snow yesterday. Temps depend on the ocean cycle here. In El Nino years, rains come in September, and in this La Nina winter we got rains starting in mid February. It looks like the temp minima shifted by 3 months as well.
‘But right now I think it is too early to be drawing conclusions.’
The land of the long white cloud has had summer snow two years in a row, doesn’t sound normal.
The collapse of the subtropical ridge is the root cause of this anomaly, a meandering jet stream is playing havoc with the weather in midlatitude through blocking highs. This is a global cooling signal.
Because we’re ‘eurocentric’ dang it.
As far as the solar minimum ‘stuff’, it is pure conjecture on David’s part. Hopefully Leif will come on the thread and offer an opinion. Not sure if he will tho
Ian – Jan was a record high in NZ but Feb is back to normal average. I am expecting March to be average also. We had a hot blob in the Tasman Sea. Its all but gone. NZ temperatures are about SST and wind direction. Global SST looks very cool right now.
Regards
M
David I fear that without links to the actual data used, this is interesting but merely anecdotal … and the plural of “anecdote” is not “data”.
Not too late to cure this and turn your analysis into something worthwhile by posting links to each of the datasets so we can determine if you’ve made any errors.
Best to you,
w.
The aa data and the northern hemisphere data are from NOAA. Annual aa data:ftp://ftp.ngdc.noaa.gov/STP/SOLAR_DATA/RELATED_INDICES/AA_INDEX/AA_YEAR
Northern hemisphere data is from GISTEMP. CET data is from the MET office. Professor Humlum cited as the source of the North Atlantic data.
I remember error bars when I was a kid. I miss them. And adverbs. I miss adverbs. Bad.
Badly.
/s a r c l y. See?
My bad as they say now in the U.S.
I remember when people gave references in their articles
+1
As was noted on another board, the stratosphere hasn’t cooled since 1995, as AGW says it should:
Interesting graph Bartemis. However, there clearly are two different populations visible in the data, one ending in 1994, characterized by large swings in the data, and the later one which is much smoother data. Probably shouldn’t run a trend line through two separate populations unless there is clear idea why.
Indeed. Make that three populations interspersed by two (one and a pair) significant events.
TLS stands for lower stratosphere which is strongly effected by O3 concentration (Clough & Iacono). If you go to the same source that you used and look at the higher stratosphere data you’ll see it shows a fairly steady decline of ~0.5K/decade.
Sounds like a play on the Groucho Marx routine:
Cherry pick much?
If the solar minimum that to all intents and purposes caused the L.I.A. it would be foolish to ignore the solar minimum that seems to be paralleling its progress and ignoring it as irrelevant. I do feel sorry for all those that think that warming and cooling periods are not caused by the sun. Interruptions to our climate are occasionally caused by volcanoes and major interruptions by large meteorites and comets striking the Earth, but normal climate variation is by our only heater the sun.
The Maunder Minimum was a 75-year period of very low sunspot activity, from 1645 to 1715.

 ?zoom=2
The period of the Little Ice Age is much larger. There is disagreement on the exact starting date (because thermometers didn’t exist before the 16th century), but ice-core proxies suggest dates between 1300 and 1500.
So there is really not much correlation to make assertions that the Maunder minimum caused the LIA.
OTOH, there is a HUGE correlation between LIA (1645-1715) and the lifetime of Sir Isaac Newton (1643-1726).
There’s apparently a grand conspiracy to keep this quiet. 😐
“OTOH, there is a HUGE correlation between LIA (1645-1715)…”
The almost perfect correlation is with the reign of Louis XIV (1643-1715). But he was the Sun King. That ruins a few theories.
Central England Temp..
I recorded the film ‘The Land Girls’ just t’other day.
Not watched properly yet, just edited it to take out the adverts, but one scene said soooo much.
The Farmer in the film had previously bemoaned ‘The Ministry’ (now called DEFRA) and then scene was of his son and one of the girls ploughing a green pasture field.
The guy was a picture of pure broken-hearted sadness.
And we all know what native North Americans think/thought about ploughs.
See your temp graph at the top here – see it ramp up after WW2?
CET encompasses THE most intensively farmed bit of dirt on this planet.
Hence 10 tonnes per acre wheat yield.
(Why does anyone else bother with their paltry 1 or 2 tons per acre – not because they are Starving Hungry perchance?)
There is your twitching thermometer.
It is, with a bit of thought and a clear eye, possible and easy to see the damage…
Look at a landscape. Look at lots of different landscapes.
What do you see?
Asses the one you’re currently looking at, is it Male or Female?
With practice you’ll know exactly what I mean.
Which one would you prefer to live in? Which one will sustain you?
math fail – doncha just love acre feet, specially when driving a keyboard.
Make that 10 tonnes per *hectare*
Gee, Peta, I don’t get to Central England all that often.
How ’bout answering some (lots) of those questions…
There are different tribes across North America, before Columbus, there were many tribes.
Just as a number of tribes focused nearly exclusively on hunting-gathering, quite a few tribes included substantive agriculture.
While ploughs/plows were not used by Native Americans, digging sticks were common.
• East Coast tribes raised the three sisters, squash, corn, beans; and shared their produce with early settlers in New England and Virginia.
• The three sisters were raised by tribes across America; e.g. ancient Anastasi occupants of the cliff dwellings grew these crops.
• Even the fearsome Apaches were well known for their orchards and sheep herds before being driven off of their lands.
Native Americans burned grasslands to drive small game into nets, and controlling woodlands. They also control burned portions of woodlands to form meadows, pastures and croplands; along with transplanting berry bushes and preferred food plants into suitable environments.
Native Americans were/are disgusted with the allegedly civilized man’s wanton destruction of forests, land and wildlife.
Western immigrants seized lands and cleared those lands, but only utilized a portion of the timber; selling what they didn’t use or burning it. Western man treated wildlife the same, slaughtering all wildlife, eating some and selling or wasting the rest.
Americans did the same to the bison, all to crush the Lakota, Cheyenne and other plains tribes.
In spite of misstated quotes taken out of context, Native Americans were not against shaping the land to their needs.
16 degrees cooler here this year than last year for the same time. (Just got the gas bill) I should go through all my bills to see what it’s been doing since 2006.
Storm of the century 1993???
https://www.weatherbell.com/
Saturday summery
So what’s the “climate sensitivity” of CO2 on global cooling?
Certainly in the UK annual temps have been tracking sidewards since 2006. After a steady rise between 1975-2005. Since 2006 winters have slightly warmed but this has been balanced out with slightly cooler summers. During the months of August and November mean temps have fallen since 2006.
A further note.
Since 2002 the date for the first snow of winter has been trending earlier in my local area in N Lincs England. Which ties in with the slight cooling been seen in November.
Global cooling since 2006? Oh, come on. Is that cooling hiding in the oceans too?
Global cooling has been predicted by some skeptics since the early 2000’s. We have to be skeptical of skeptics too.
Anyone who is absolutely positive they know what the future will be like is almost always wrong. They could get lucky, but it’s on the same level as guessing all six lottery numbers. It does happen, but don’t bet on it.
We are talking about a natural system which appears chaotic.
There are three choices: global warming, global cooling, or perhaps the plateau in temperatures will never end.
My money is on global cooling because the signs are everywhere and if you don’t believe me then go back to the early 13th century and see for yourself.
Oh, I agree. But I won’t bet on it.
Some knowledge about the future can be inferred from the past. Forecasting, as any other activity, is the subject of studies, and a golden rule has been established, that can be resumed in “be conservative.” Predictions of important cooling or important warming are likely to be wrong, and the most probable outcome is that the moderate warming observed for the past 120 years (with periods of warming and cooling) is likely to continue for the next few decades.
We can also say that sooner or later global warming will end, and that sooner or later the interglacial will come to an end, but the uncertainty about the timing is really high. The probability is higher that we won’t live when any of that happens.
What makes the 13th century a good analog of the 21st century? I would think the 11th century makes a better analog because of the ~ 1000-year cycle, but even then it might not be a good analog as we know some conditions are very different.
As I said “I agree, but I won’t bet on it”. Chaos is chaotic.
Oh, I would bet a modest amount that climate and temperatures will not stay static for the rest of the century. Oops, forgot that I won’t be alive to see that. Does anyone know a seer that can consistently predict the temperate, within a degree or two, a few hours from now?
Just shows that sometimes bunkum can be useful. Alternative facts: they don’t need to be true they just need to exist to create doubt amongst the ill-educated.
No doubt we don’t need facts, when we have ‘ensemble models runs’.
What about the phrase “data suggests” did you not understand? What I’m seeing isn’t skepticism, but rather more a knee-jerk reaction.
What about “cherry picked data suggests”?
The world has not cooled since 2006. Quite the contrary, the 2015-2016 was its warmest recorded.
You are obviously very emotional about this, and it shows. And your 2015-2016 cherry-pick is noted.
Javiar, only because they include the Ocean surface temperatrures.
There are other indicators that say the Land is Cooling, for instance there is this one
http://notrickszone.com/2018/03/03/latest-data-show-central-europe-winters-cooling-over-past-30-years-germanys-february-almost-3c-below-normal/#sthash.I7sEXwla.dpbs
Here we go again. The old anyone who disagrees with those I believe to be right, is uneducated.
2015-16 was only the warmest by a few thousandths of a degree.
Given that we don’t know the actual temperature to even a tenth of a degree, your proclamation regarding the record is taken with a sizable grain of salt.
No Javier. We just cover up any inconvenient cooling with “wormholes” /sarc
Solar activity and especially solar wind speed is controlling AMOC flow speed. Gulf stream is part of AMOC : ?itok=lfpfdcbb
 ?itok=6QzdBMES
Moon lunar stand still cycles are controlling Gulf stream position :
http://www.ices.dk/sites/pub/CM%20Doccuments/2006/C/C0206.pdf
Sun is controlling arctic regions warm ocean currents at all too :
http://static-sls.smf.aws.sanomacloud.net/tiede.fi/s3fs-public/styles/medium_main_image_no_upscale/public/discussion_comment_image/pilkut.png
http://static-sls.smf.aws.sanomacloud.net/tiede.fi/s3fs-public/styles/medium_main_image_no_upscale/public/discussion_comment_image/ap_index.png
But in 45N moon lunar standstills are important.
There wasn’t a “1970s Cooling Period”. Any mid 20th century cooling ENDED in the 1970s.
“Some data suggests Global Cooling started in 2006”
Well done Watts – promoting another pile of tosh from Archibald.
Piled on top of this from 2014. SMFH.
And earlier still
““My prediction is that this rate of cooling will accelerate to 0.2 degrees per annum following the month of solar minimum sometime in
2009.”
Is this some kind of WUWT joke?
Hey if you don’t like the fact that we present articles here that you disagree with, then stay away. If we presented articles that only fit your worldview, the place would be boring, much like RealClimate’s echo-chamber of a few commenters. Presenting articles for criticism is just as important as presenting articles for accolades.
+1 It’s why your site and Judith Curry’s are so popular.
Kudos to you for putting your name above it but do you need to be such a willing lighting rod for this kind of stuff?
There are plenty of interesting, informative posts, but some that drag it down and well out of the realms of credibility and the “end of the Modern Warm Period” meme is one of them. It seems nothing more than speculation based of hope.
What do you think about it?
And I thank Anthony for puttting this post up. Six to eight years ago a comment on WUWT was to the effect that climate is controlled by the Sun’s magnetic flux – no need to worry about much else. It seemed to come from a warmer scientist – they are well funded, have plenty of time on their hands, some are smart and idle curiosity would get a few looking into what controls climate. The results would not be published of course. To paraphrase Mussolini, everything within the narrative, nothing outside the narrative, nothing against the narrative. So I finally got around to doing something about it. If the Sun’s magnetic flux controls climate, you don’t have to worry about what goes on under the hood – the effect of EUV on the NAO, the GCR flux, the F10.7 flux, any other flux apart from the magnetic flux. One thing I didn’t get to was the retreat of the glaciers which started in 1860 at about the time the aa Index started rising. The glaciers were responding to something. The graph of the North Atlantic Current temperature picks the Modern Warm Period pretty well – a multidecadal trend up, the peak and now what looks like a multidecadal trend down. The end of the Modern Warm Period is defined by going back to the sort of magnetic flux of the 19th century. Solar Cycle 24 hasn’t been weak. It started out with a lot of promise but the second half was a lot stronger. The way the solar polar field strength is going, Solar Cycle 25 will be a similar amplitude and thus much the same as the cycles of the 19th century. The major commercial and perhaps societal impact of this would be late spring frosts that kill of a crop and don’t allow time for replanting.
that climate is controlled by the Sun’s magnetic flux
Except that the Sun’s magnetic flux does not show a variation consistent with the way the climate has varied, so that idea has [sadly] been falsified by the data.
What do you think about it?
Crickets…..Says it all.
I prefer a joke to a tragedy.
10+2009=2019. So what’s the point of your quote? You make no sense.
Care to offer a counter argument? For once.
This correllation is most important … AMOC strenght vs. Solar magnetic activity strenght :

AMOC means how fast in this picture red ring flows to clockwise direction :
Of course if flow speed is stroger, then more heat transports to northern hemisphere. AMO-index is controlled by AMOC flow speed(solar controlled) and Gulf stream path / Gulf stream position (moon lunar standstill controlled)
AMO is most important climate system in earth. Because it’s controlling UAH temperature :
A small question (being under fire of some warmists) : who determined the aa-index ?
See Mayaud, P. N. (1972) – The aa indices: A 100-year series characterizing the magnetic activity.
J. Geophys. Res., 77(34), 6870-6874.
http://isgi.unistra.fr/Documents/References/Mayaud_JGR_1972.pdf
The 2006 date is the approximate end of the warm phase of the PDO. When it went negative is when the pause got serious. This has not led to overall cooling because we still have the warm AMO. The AMO should turn cool around 2023. Until then, I expect the pause to continue outside of El Nino events. After that time we should see cooling for about 15 years until the PDO goes positive again.
All of this assumes ~60 year cycles for both the PDO and AMO. I did not mention anything about the sun because that connection is yet to be determined. All we, as skeptics, need to point out is these are natural cycles that seem to have a strong influence on global temperature.
It should be noted that a small difference in the length of the AMO and PDO cycles of 4-5 years is all that is needed to explain a millennial-ish cycle. This cycle seems to be driven by SSTs and changes in the salinity of the oceans. Why these might correlate is anyone’s guess.
Forgot the link to paper for salinity to SST connection.
https://www.nature.com/articles/s41467-018-02846-4
Thank you Richard M for your interesting comments.
UAH LT temperature has continued to decline as I predicted, down to 0.20C in Feb2018 from 0.36C in Nov2017. UAH LT temperature is still 0.20C higher than predicted by my formula, which only employs two variables – Nino34 equatorial Pacific surface temperature and the aerosol index (which has not been updated since ~2012). I have not bothered to post the latest updated plot, since Nov2017 is adequate until the Nino34 Index is updated for Feb2018.
I am unsure of the cause of this 0.20C delta – maybe it is just a natural delay, or maybe is it because of the Atlantic Ocean temperatures are still in warm mode – we will soon see.
On 1Sept2002 I (we) predicted in an article published in the Calgary Herald that natural global cooling would return, starting by 2020 to 2030. That prediction is still looking good.
You predict that the AMO will turn cool circa 2023 and global cooling will commence then for ~15 years, based on ~60-year cycles of the PDO and AMO. Does that accurately summarize your position?
Regards, Allan
https://wattsupwiththat.com/2018/01/01/salmost-half-of-the-contiguous-usa-still-covered-in-snow/comment-page-1/#comment-2707499
[excerpt]
Global Lower Troposphere (LT) temperatures can be accurately predicted ~4 months in the future using the Nino34 temperature anomaly, and ~6 months using the Equatorial Upper Ocean temperature anomaly.
The atmospheric cooling I predicted (4 months in advance) using the Nino34 anomaly has started to materialize in November 2017 – with more cooling to follow. I expect the UAH LT temperature anomaly to decline further to ~0.0C in the next few months.
https://www.facebook.com/photo.php?fbid=1527601687317388&set=a.1012901982120697.1073741826.100002027142240&type=3&theater
“You predict that the AMO will turn cool circa 2023 and global cooling will commence then for ~15 years, based on ~60-year cycles of the PDO and AMO. Does that accurately summarize your position?”
Yes, It will be the only time both the AMO and PDO are in their negative phases at the same time. This corresponds to ~1963-1978.
I should point out the AMO index should start dropping soon as the switch over isn’t instantaneous. And, the biggest impact on global temperatures isn’t the warmer N. Atlantic waters but is the effect of those warm waters on Arctic sea ice.
Thank you Richard M. Sounds credible,
In my many conversations with Joe d’Aleo he has mentioned something similar – in passing I think he said that the AMO has to go negative (along with the PDO) for global cooling to commence – I may be misquoting him though – lots of talks over the past decade.
ALLAN, I agree with Joe. In addition, I don’t see any warming occurring before the AMO goes negative. The pause will just continue.
And that folks is why it is not called “Global Warming”, it is called “Climate Change”.
Is there a proofreading problem? Under Figure 4 it refers to solar cycle 24/25 minimum of 2009. Wouldn’t that be 23/24? Under Figure 5 it refers to solar cycle 24/24 minimum expected in 2020. How many other typos and errors are there?
Last winter (2016-2017) was warmish, with one bitter cold spell in December. That was fun, walking to the bank and the bus stop in winds that were strong enough to knock you off your feet.
This winter (2017-2018) has been relatively normal, one or two snows and only one was really bad, but it’s all melted away now and I’ve heard the robins warbling. We’re supposed to have one last slap from Old Man Winter between now and Tuesday, so I’ll wait and see, but the chives in my pot on the front steps are already coming up and the hardware store put up its spring seed racks about two weeks ago.
None of this matched any of the almanacs’ forecasts for mild, wet winters in this part of the continent or world. They do produce nice calendars, however.
Wild swings in weather (short term) may or may not be indicators that a trend is underway, but they require a longer period than the 12 years between the start of this solar minimum and now to be accurately monitored and termed ‘cooling period’.
Owing to modern farming methods, as opposed to 10th century through the 19th century methods of producing crops, I’m only concerned about food stocks. Yes, I can make my own bread, but I have no cows and can’t churn my own butter, or make my own cheeses. I have to rely on commercial dairies for that, unfortunately.
This prognostication of a prolonged cooling period may hold up, once the records are completed. It will not surprise me if this does become a prolonged cold period. It only means thinking ahead by XXX growing seasons and possibly becoming somewhat more self-sufficient.
However, the only way to find out if the forecast is correct is to live long enough to see the results to the end, and unless you are one of Methuselah’s children, that is unlikely.
I think I want to come live in Mayberry!
Can you really call it another Little Ice Age if the snow line isn’t creeping south?
If there’s no new growth of glaciers in mountain ranges in general, but rather, the ice fields remain static, doesn’t that signify that it is not yet a cooling period?
It isn’t about how much snow we get in winter. It’s about whether or not the snow melts back and replenishes ground water levels that counts. If by the end of May in the Midwest, the snow hasn’t melted back and nothing has been planted because of it, that would be a significant factor in regard to real change in the direction the climate is taking. It has to be specific signs like the snow line creeping further and further south in the northern hemisphere, for example, that signify a real and probably prolonged change \.