From the “Arctic is screaming louder thanks to Mark Serreze and his adjustment shenanigans” department, I don’t think this is going to fly. Some of the adjustments are as much as 1.2 million square kilometers of sea ice, which is as much as some yearly variations. -Anthony
Guest essay Tom Wiita
I came across this month’s page posted at the NSIDC web site detailing the sea ice findings for the current month. It mentioned a revision to the way NSIDC calculates the sea ice area which was made last month. Curious, I went to last month’s page to check it out.
As a veteran NSIDC-watcher, before reading the page I made a falsifiable prediction bet with myself. I bet that this change in computation method increased the rate of decline of arctic sea ice compared to the rate of decline calculated under the old method. If the rate was greater, I win. If the rate of decline was lower, I lose and my prediction is falsified. You know, like in real science. This time I’m applying it to a social science study, of the behavior of NSIDC.
Would you believe it, I won my bet!
Here’s the link to the page:
https://nsidc.org/arcticseaicenews/2017/11/freezing-in-the-dark/
And here’s the relevant section describing the change copied straight off their public web site:
“Revised computation of the monthly mean extent

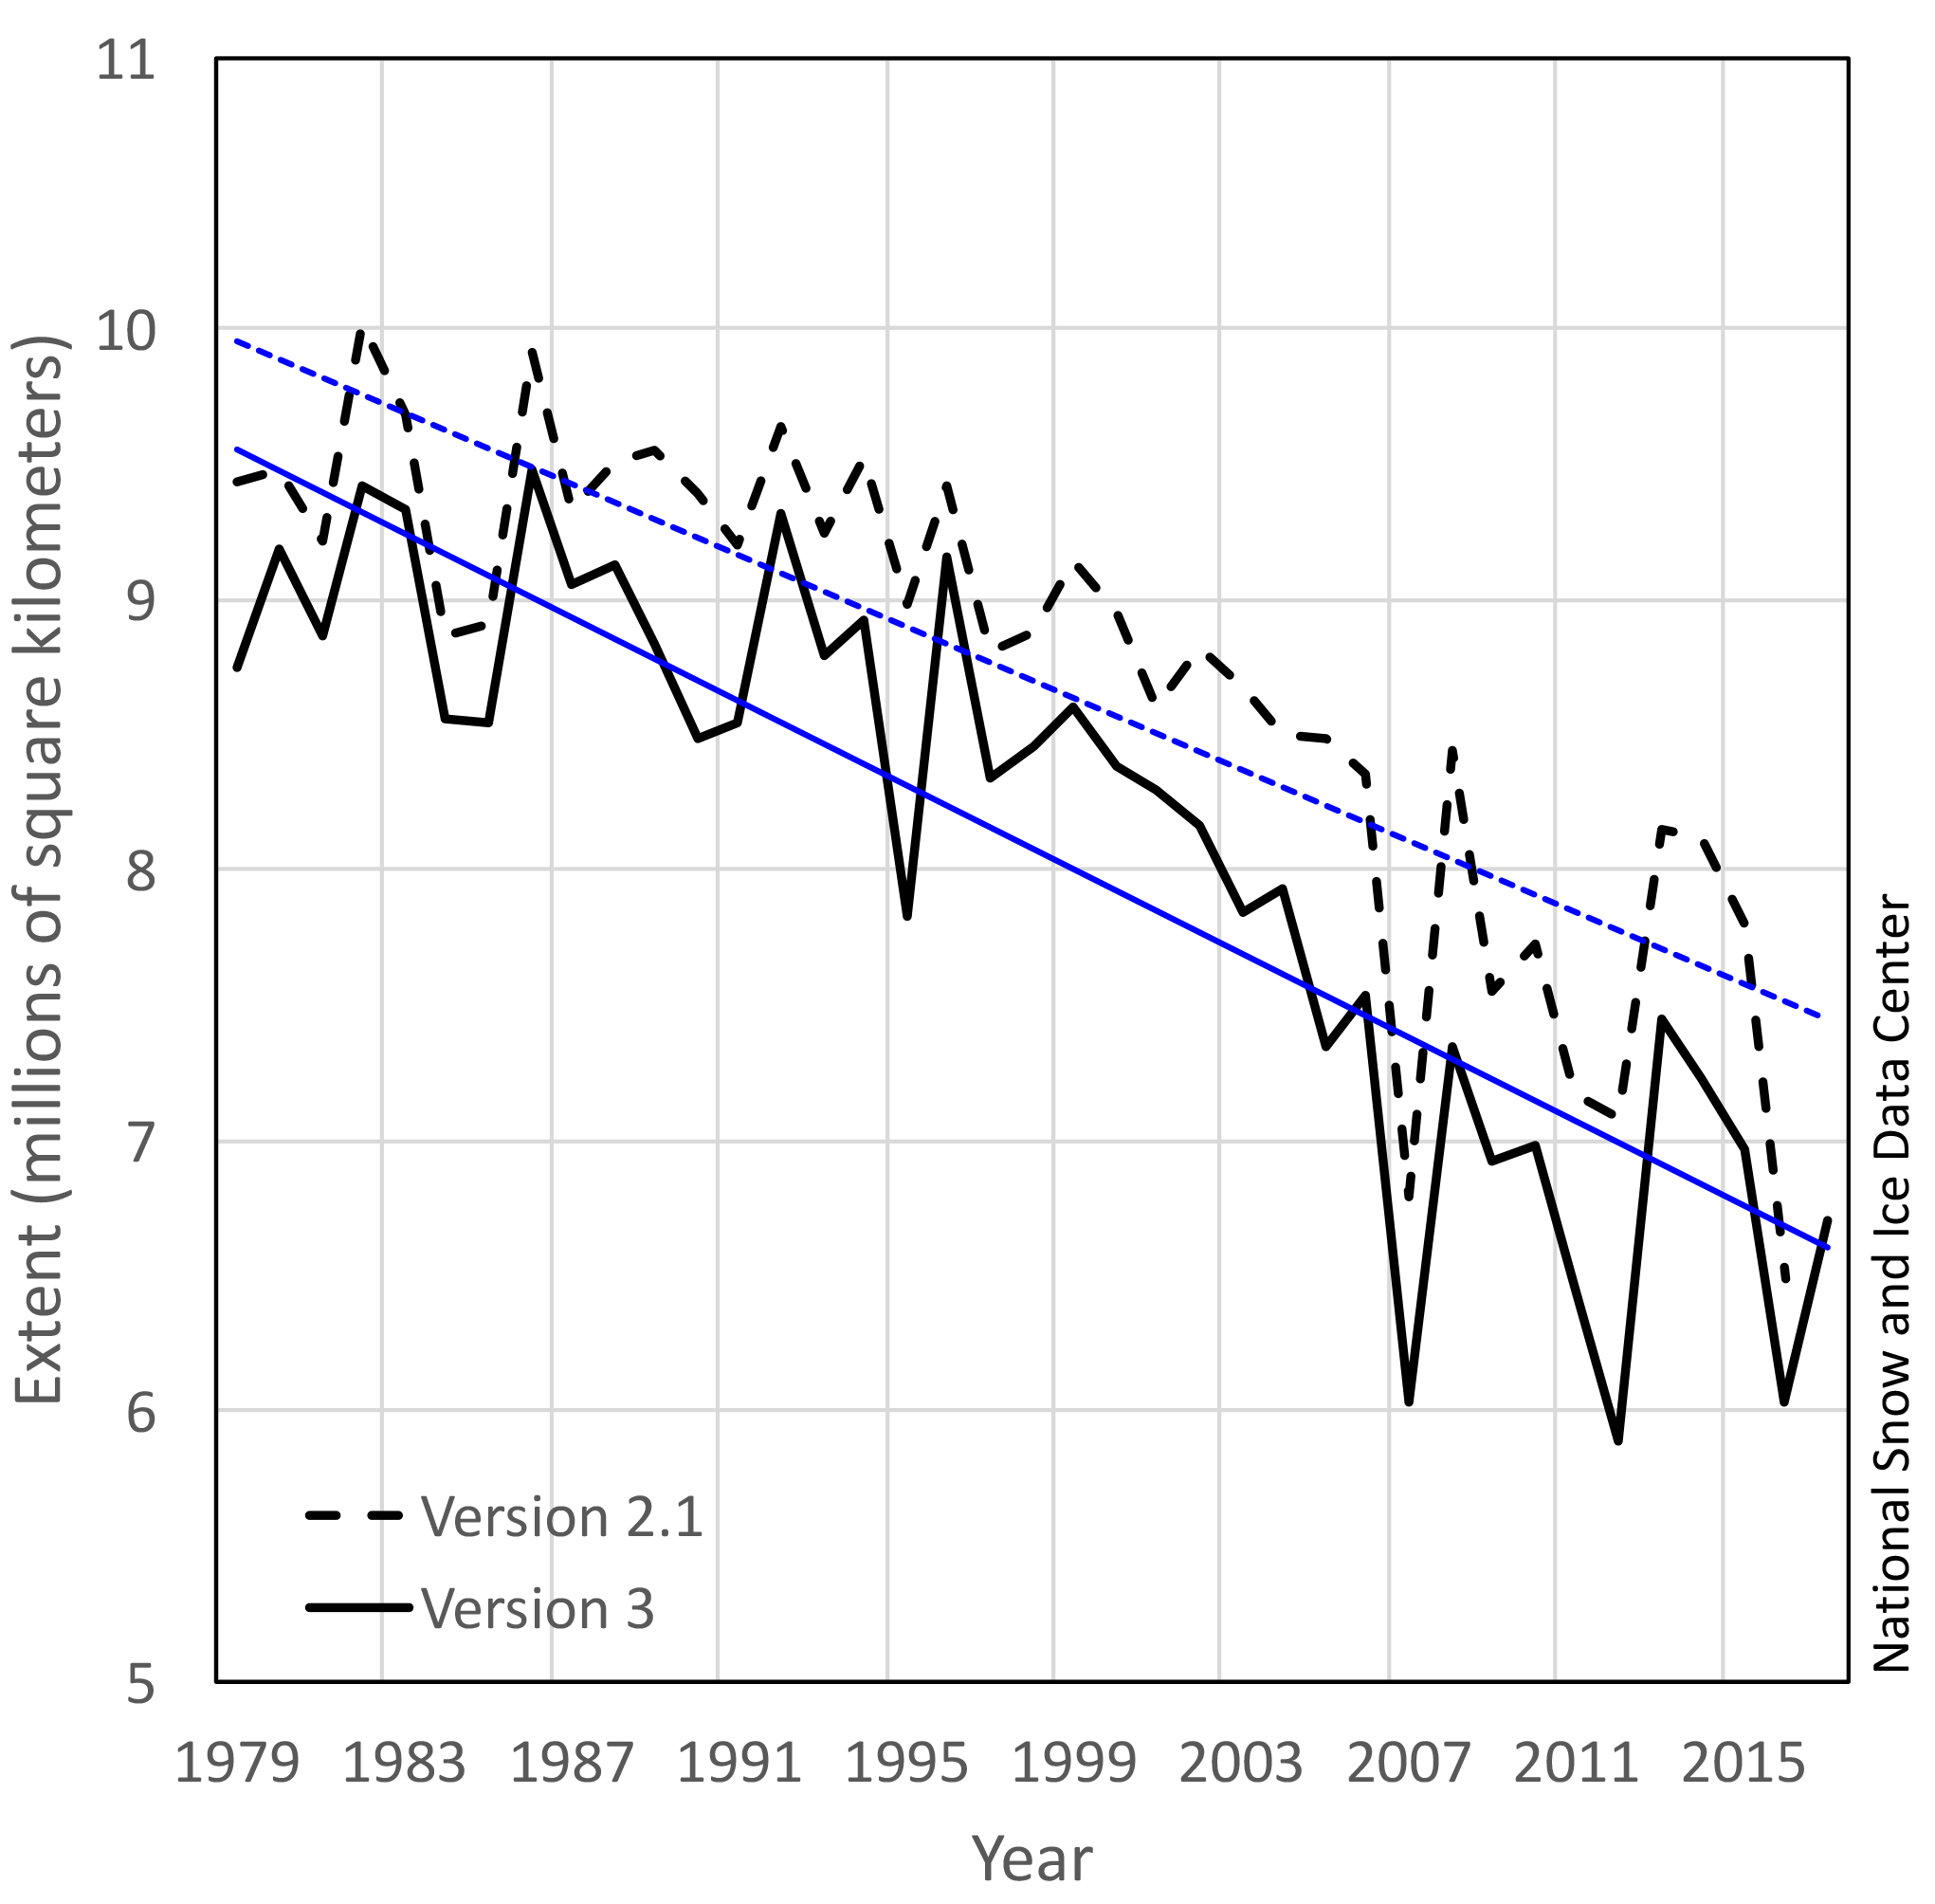
Figure 6. This chart compares the monthly October Arctic sea ice extents generated from the old (black dashed line) and the new (solid black line) averaging method. Sea Ice Index data. About the data Credit: National Snow and Ice Data Center High-resolution image
We have updated the way the monthly average sea ice extent is calculated in the NSIDC Sea Ice Index, the source for our sea ice extent estimates. The monthly average total extent (and area) are now computed as an average of the daily values over the month. Historically, the monthly mean sea ice extent has been calculated based on the monthly mean averaged sea ice concentration field. While there is a rationale for both approaches, the new method is more intuitive and eliminates unusual and unexpected results in months when there is rapid ice growth and retreat. Most of the new monthly mean extents are smaller than the previous values with a mean extent difference between -0.45+0.24 and -0.23+0.16 million square kilometers for the Arctic and Antarctic, respectively. The largest differences for the Arctic occur during the month of October due to the rapid ice growth rates typical at that time of year, with the largest difference of -1.20 million square kilometers in October 2012. Changes in rankings and trends were much smaller because the new method tends to affect all years of a given month in a similar manner. October is also the month with the largest trend difference, increasing in magnitude from -7.4 percent per decade to -9.3 percent per decade. Changes in Arctic trends for other months are much smaller.
Similarly, in the Antarctic, differences in averaging methods results in the largest changes during the month of December when the ice cover is rapidly receding. The largest difference of -1.27 million square kilometers occurs in December 1981. The largest changes in the trends are for January and December with a change in value from +2.7 to +3.5 and +1.2 to +1.9 percent per decade, respectively. For more detailed information on the impacts of the revised averaging methods on trends and rankings, please see NSIDC Special Report 19.”
Let me just point out a couple of things that stood out to me in the explanation above.
- First, the bet-winning difference is that sea ice decline goes from 7.4% per decade to 9.3% per decade. Mark Serreze will be so happy – the arctic is screaming 1.9% louder per decade.
- Second, all the values are lower after the revision. Every single one. “It’s worse than we thought!”, worse than we measured, worse than we reported to the world, worse, worse, worse. This has got to be one of the largest classic “worse than we thought” examples driven solely by a change in methods. They’re still after all looking at the exact same satellite pictures.
- Third, look at the magnitudes of some of those differences. I mean, we missed that there were 1.2 MILLION fewer square kilometers of sea ice than we thought? Only 5 years ago in 2012? And we’ve been tracking this since 1979? And this is settled science? Come on!
Now, to be fair, the computation change giveth and the computation change taketh away.
Antarctic sea ice extent is growing faster after this change. But of course, as usual, they put anti-narrative results someplace safe, like into Antarctic sea ice growth, where they’ve always had a problem and already have multiple explanations/excuses: climate change is causing that, too; it’s going to turn around real soon, just you wait; ozone hole changes; more fresh water melting and freezing; at least West Antarctica is warming fast so something fits the narrative down there, etc.
Happy New Year to all!
Just adjust the thing to 0 sq mi, retroactive to 2013, and announce that al-Gore was right so we can all get on with our lives (including snow shovelling).
To the person responsible for the headline…please don’t fall prey to the millennial habit of inventing verbs. “Disappears” ????? How about something less obtuse and more damning that happens to be a correct use of a verb like “ERASES”!?!?!? I hate to sound like the language police, but to “disappear” something sounds ridiculous…
Interesting question. Good magicians are very apt at disappearing things. In some aspects these climate scientists can be compared to magicians in the way they disguise the truth.
People have been verbizing nouns for decades. (Otherwise stated as the rule “All nouns can be verbed.”)
You are nouning your nouns.
the new method is more intuitive and eliminates unusual and unexpected results
In other words it eliminates awkward results.
We hear reports over this side of the Atlantic that temperatures on Mt.Washington have dropped to about -100c. Is this true, or has the tale grown in the telling ?
That’s probably a wind chill temp in F, which is possible.
https://www.cbsnews.com/news/mount-washington-wind-chill-new-hampshire/
I think the actual temp was -38….with 100 mph winds….wind chill -100
Early this morning when I came in off the road I checked out the website for the weather observatory at the summit of Mt. Washington and copied and pasted on another blog. So here is what is said then:
Summit Conditions
Temperature -32°F
Gust 102 mph
Wind 90 mph
Wind Chill -85°F
Direction 290°(WNW)
Last Updated Saturday, January 6 2018 3:06 AM
Here is the link to the observatory site:
https://www.mountwashington.org/
Remember that you may want to use these tools for archiving things before they are lost in the memory hole:
web.archive.org
archive.is
As I thought, this warming chart also begins in the late seventies like others by so-called “clinate scientists.” and totally hides what is going on in the Arctic. Unknown to these “scientists” is the fact that for two thousand years there was no win the Arctic warming, just a slow, linear decline that ended at the beginning of the twentieth century. At that point a rapid warming, lasting for the next forty years. set in. It did not last because in 1940 a strong cooling startrd. This one lasted thirty years. It, too, came to an end and the warming that the only warming that these so-called climate “scientists” know of started in 1970. By the end of the seventies vit had advanced enough to attract yhe attention of these “scienrists” who thought it was another manifrstation of the greenhouse effect they love. It was nothing of the sort. Even noting that the new warming was twice as fast as predicted by their models did not disturb them. What really happened was a rearrangement of the North Atlantic current system thar redirected the Gulf Stream water flowin g north parallel to the East Coast more directly into theArctic Ocean. I had this much in my book “Wjat Warming” but when Spielhagen et al. took an Arctic cruise and by hand scooped up warm water near Svalbard I. This told me that I better work out what is going on in the Arctic. The result was published in E&E, volume22, issue 8 in 2011 as “Arctic Warming Is Not Greenhouse Warming.” Read and find out what really is happening the Arctic.
Matt G January 6, 2018 at 5:00 pm
Where was this from?
Good question, can you give us a link to the source of your quotation?
“The structure and movement of the sea ice cover
in the Arctic Basin is complex .During each year,
the whole gamut of sea ice types is found, ranging
from nilas and frazil to various stages of first-year
ice to thick multi year ice. The pseudo actual ice area
for the Arctic Ocean at the summer minimum is
about 3.8 x 10 6 square kilometers, and it increases
to about 6.3 x 10 6 square kilometers at its winter
maximum (Figure 4-11). This large seasonal area oscillation,
coupled with the intermittent convergence and divergence of
the ice pack, produces within the Arctic Basin an ice pack
composed of mixtures of first-year and multiyear ice floes of
varying sizes, with a distribution within the basin that varies
seasonally, annually, and interannually. The average
thickness of the ice pack is approximately 3 to 4
meters, although the actual thickness varies markedly
from one point to another.”
NOTICE
Where was this from?
Satellite data between 1973 and 1976 based on 15%+ ice cover.
THIS ARCTIC SEA ICE WAS LOWER THAN EVEN RECENT YEARS. This is the information that they don’t want the public to know.
This backs up the scientific evidence that the Arctic was actually warmer in the past for it cause so many cold outbreaks over mid-latitudes causing colder and more frequent winters. These previous decades occurred because warming Arctic was caused by more negative AO and NAO phases than recently.
Matt G.
Be careful: The writer you quote might be specifically using “sea ice area” for those specific values, not “sea ice extent” as the NSIDC seemingly prefers. All of its press releases and graphic images and “maps”, for example, use its daily sea ice extent values. Only a few of its spreadsheets maintain sea ice area for each region, and those are on tabs internal to the program. I cannot even find a daily “Total Arctic Sea Ice Area” value from the NSIDC.
Cryosphere, when its data was active (before two of its researchers retired/transferred in April-May 2015) released both sea ice area and sea ice extents each day.
Even now, sea ice area values are always less than sea ice extent values for the same day.
True, sea ice area is always lower than extent.
This paper compares northern hemisphere ice extents and area.
https://www.the-cryosphere.net/6/881/2012/tc-6-881-2012.pdf
The minimum 3.8 x 10^6 square kilometers is still lower than virtually all the sea ice area values shown here. The monthly average for the timeline looks around 5.0 x 10^6 square kilometers.
Matt G January 7, 2018 at 4:01 pm
The minimum 3.8 x 10^6 square kilometers is still lower than virtually all the sea ice area values shown here. The monthly average for the timeline looks around 5.0 x 10^6 square kilometers.
There’s a good reason for that, you’re not comparing like with like.
What is usually referred to as the arctic sea ice extent is referred to in that paper as the ‘Northern Hemisphere total’, the Arctic Ocean in that paper is a region of the total (see fig 1(b))
Hardly any sea ice survives out of the Arctic ocean during the late summer minimum over recent years and during this time was hardly different.
“Spatially, during the period of minimum ice extent in September (Figures 4-1 and 4-7), the ice pack is mostly confined to the central Arctic Ocean, with only a small amount of ice coverage in the Greenland Sea, the Kara and Barents Seas, and the Canadian Archipelago. Essentially no ice remains in the Bering Sea, Hudson Bay, the Sea of Okhotsk, and Baffin Bay/Davis Strait.”
The Kara and Barents Seas were included in the pseudo Arctic ocean sea ice area. The Greenland Sea and Canadian Archipelago were about 0.6 x 10^6 square kilometers.
Matt G January 8, 2018 at 3:10 pm
Hardly any sea ice survives out of the Arctic ocean during the late summer minimum over recent years and during this time was hardly different.
Now yes, for example in 2007 the minimum extent was 4.3 million sq km (area 3.1), however between 1973 and 1976 the september minimum ice extent was 7.8 million sq km. Again the values you quoted are area not extent and are for the central Arctic ocean not the Arctic region as whole. The satellite measurement from 1973-76 showed a minimum extent about double the recent minima.
“Spatially, during the period of minimum ice extent in September (Figures 4-1 and 4-7), the ice pack is mostly confined to the central Arctic Ocean, with only a small amount of ice coverage in the Greenland Sea, the Kara and Barents Seas, and the Canadian Archipelago. Essentially no ice remains in the Bering Sea, Hudson Bay, the Sea of Okhotsk, and Baffin Bay/Davis Strait.”
The Kara and Barents Seas were included in the pseudo Arctic ocean sea ice area. The Greenland Sea and Canadian Archipelago were about 0.6 x 10^6 square kilometers.
The Kara and Barents Seas are not included in the central Arctic ocean region that you referred to.
Only make that 4.6 x 10^6 square kilometers of sea ice area and is still below the majority of years for sea ice area.
There are no other sea areas in the Arctic, so any value larger must have measured snow cover on land.
“The Kara and Barents Seas are not included in the central Arctic ocean region that you referred to.”
I read for some reason they treated these as Arctic ocean at least back then, but as it was only 0.2 x 10^6 square kilometers it had little irrelevance.
Matt G January 9, 2018 at 12:00 pm
Only make that 4.6 x 10^6 square kilometers of sea ice area and is still below the majority of years for sea ice area.
There are no other sea areas in the Arctic, so any value larger must have measured snow cover on land.
“The Kara and Barents Seas are not included in the central Arctic ocean region that you referred to.”
I don’t know where you get those values from?
This is the Arctic extent for 1973-6 from the NASA satellite data:
“The extent reaches a minimum of 7.8 x 10^6 square kilometers during September, expands
equator-ward at a rate of 1.8 x 10^6 square kilometers per month from September to December, and
continues expanding slowly to its maximum extent of 14.8 x 10^6 square kilometers in March (Figures
4-10 and 4-16). The ice edge retreats slightly from March to May, after which an increasingly rapid retreat occurs from May to August, with the retreat rate peaking at 2.3 x 10^6 square kilometers per
month from July to August. A slight further retreat from August to September brings the ice to its September minimum”
Their graphs of the individual regions show the following September average areas (>15%) for the regions:
Arctic Ocean 6.0 x 10^6
Kara & Barents 0.4
C Archipelago 0.7
Greenland Sea 0.5
Hudson Bay 0.1
Baffin Bay 0.1
The Cryosphere paper you linked shows minima about 7.5 x 10^6 sq km in 79-80 and about 5.0 x 10^6 sq km
after 2007.
Source:
NASA SP-489
ARCTIC SEA ICE, 1973-1976:
SATELLITE PASSIVE-MICROWAVE OBSERVATIONS
Claire L. Parkinson, Josefino C. Comiso, H. Jay Zwally,
Donald J. Cavalieri, Per Gloersen
Laboratory for Oceans
Goddard Space Flight Center
Greenbelt, Maryland 20771
William J. Campbell
U.S. Geological Survey
Ice and Climate Project
University of Puget Sound
Tacoma, Washington 98416
Should be “The monthly minimum average for…………”
I have zero confidence in the arctic sea ice extent from any of these posers. If the arctic is so warm get your beach chair and umbrella and head north!