From the “Arctic is screaming louder thanks to Mark Serreze and his adjustment shenanigans” department, I don’t think this is going to fly. Some of the adjustments are as much as 1.2 million square kilometers of sea ice, which is as much as some yearly variations. -Anthony
Guest essay Tom Wiita
I came across this month’s page posted at the NSIDC web site detailing the sea ice findings for the current month. It mentioned a revision to the way NSIDC calculates the sea ice area which was made last month. Curious, I went to last month’s page to check it out.
As a veteran NSIDC-watcher, before reading the page I made a falsifiable prediction bet with myself. I bet that this change in computation method increased the rate of decline of arctic sea ice compared to the rate of decline calculated under the old method. If the rate was greater, I win. If the rate of decline was lower, I lose and my prediction is falsified. You know, like in real science. This time I’m applying it to a social science study, of the behavior of NSIDC.
Would you believe it, I won my bet!
Here’s the link to the page:
https://nsidc.org/arcticseaicenews/2017/11/freezing-in-the-dark/
And here’s the relevant section describing the change copied straight off their public web site:
“Revised computation of the monthly mean extent

Figure 6. This chart compares the monthly October Arctic sea ice extents generated from the old (black dashed line) and the new (solid black line) averaging method. Sea Ice Index data. About the data Credit: National Snow and Ice Data Center High-resolution image
We have updated the way the monthly average sea ice extent is calculated in the NSIDC Sea Ice Index, the source for our sea ice extent estimates. The monthly average total extent (and area) are now computed as an average of the daily values over the month. Historically, the monthly mean sea ice extent has been calculated based on the monthly mean averaged sea ice concentration field. While there is a rationale for both approaches, the new method is more intuitive and eliminates unusual and unexpected results in months when there is rapid ice growth and retreat. Most of the new monthly mean extents are smaller than the previous values with a mean extent difference between -0.45+0.24 and -0.23+0.16 million square kilometers for the Arctic and Antarctic, respectively. The largest differences for the Arctic occur during the month of October due to the rapid ice growth rates typical at that time of year, with the largest difference of -1.20 million square kilometers in October 2012. Changes in rankings and trends were much smaller because the new method tends to affect all years of a given month in a similar manner. October is also the month with the largest trend difference, increasing in magnitude from -7.4 percent per decade to -9.3 percent per decade. Changes in Arctic trends for other months are much smaller.
Similarly, in the Antarctic, differences in averaging methods results in the largest changes during the month of December when the ice cover is rapidly receding. The largest difference of -1.27 million square kilometers occurs in December 1981. The largest changes in the trends are for January and December with a change in value from +2.7 to +3.5 and +1.2 to +1.9 percent per decade, respectively. For more detailed information on the impacts of the revised averaging methods on trends and rankings, please see NSIDC Special Report 19.”
Let me just point out a couple of things that stood out to me in the explanation above.
- First, the bet-winning difference is that sea ice decline goes from 7.4% per decade to 9.3% per decade. Mark Serreze will be so happy – the arctic is screaming 1.9% louder per decade.
- Second, all the values are lower after the revision. Every single one. “It’s worse than we thought!”, worse than we measured, worse than we reported to the world, worse, worse, worse. This has got to be one of the largest classic “worse than we thought” examples driven solely by a change in methods. They’re still after all looking at the exact same satellite pictures.
- Third, look at the magnitudes of some of those differences. I mean, we missed that there were 1.2 MILLION fewer square kilometers of sea ice than we thought? Only 5 years ago in 2012? And we’ve been tracking this since 1979? And this is settled science? Come on!
Now, to be fair, the computation change giveth and the computation change taketh away.
Antarctic sea ice extent is growing faster after this change. But of course, as usual, they put anti-narrative results someplace safe, like into Antarctic sea ice growth, where they’ve always had a problem and already have multiple explanations/excuses: climate change is causing that, too; it’s going to turn around real soon, just you wait; ozone hole changes; more fresh water melting and freezing; at least West Antarctica is warming fast so something fits the narrative down there, etc.
Happy New Year to all!
Ahhhh…. Man made arctic sea ice melting.
Retrospective man made arctic sea ice melting.
the difference between an average liar, and a lying scientist, is pay scale:-))
… gives a new and PROPER sense of the phrase “human-CAUSED” climate change.
Calculation is causation. 97% agree.
make it 100% 🙂
After applying my new novel homogenisation technique (which improves accuracy by 23.6%) to the average areas over time, I come up with 110% of non-scientist agree.
Don’t you mean “Mann-made Arctic sea-ice melting”?
😁
Before all the kneejerk wailing of foul play it should be noted that the new method seems more sensitive to change in both directions: as seen in Antarctic increase being greater and also a more pronounced recovery in the Arctic since 2007.
The main problem with this article is that it only considers the bloody “trend” or whole dataset.
If all you can do to data is fit one straight line to it , don’t bother criticising anyone else.
Hi Greg, while I know diddly about trend analysis could you please highlight the bit of the displayed image where the analysis shows more sea-ice at any time over the period shown using the new calculations?
Thanks in advance,
Andy
As the saying goes: figures lie and liars figure.
Tom … I was taught “figures don’t lie but liars figure”.
The rate of adjustments is accelerating
“Climate science” IS worse than we thought.
Excellent!
Caught red handed again. For another example, see my guest post here 2/17/17 concerning CONUS trends and NOAA’ s shift in early 2014 to NClimDiv. Typing NClimDiv into the search bar will take you there.
I’m confused. Were they trying to sneak one by, or were they being up front about their changes?
It doesn’t sound like they were trying to hide the changes … or did it accidentally slip out?
I believe that there are some working there that want to be on the right side of history so leave plenty of opportunity to caveat their findings and statements at some later date. Remember they argue that both the “old” and the “new” methods having supporting rationale. In other words like good little technocrats they are trying to cover their butts.
They can admit to it now…..but it changes the slope forever…specifically look at what they did to 2006 and 08
***I’m confused. Were they trying to sneak one by, or were they being up front about their changes?***
They will now be able to say that there was even less ice than they thought. And the kool-Aid drinkers will lap it up.
Their adjustments start going whackamole after 1999…got rid of the spike completely in 2008…..trippled the reduction in 2012 as compared to 2007…and over all made the rate of ice decline a lot faster after 1997
Notice the gap gets bigger..
average of daily values is smoke and mirrors….Both methods should give exactly the same results with an offset….in this case the new slope diverges down (less ice)
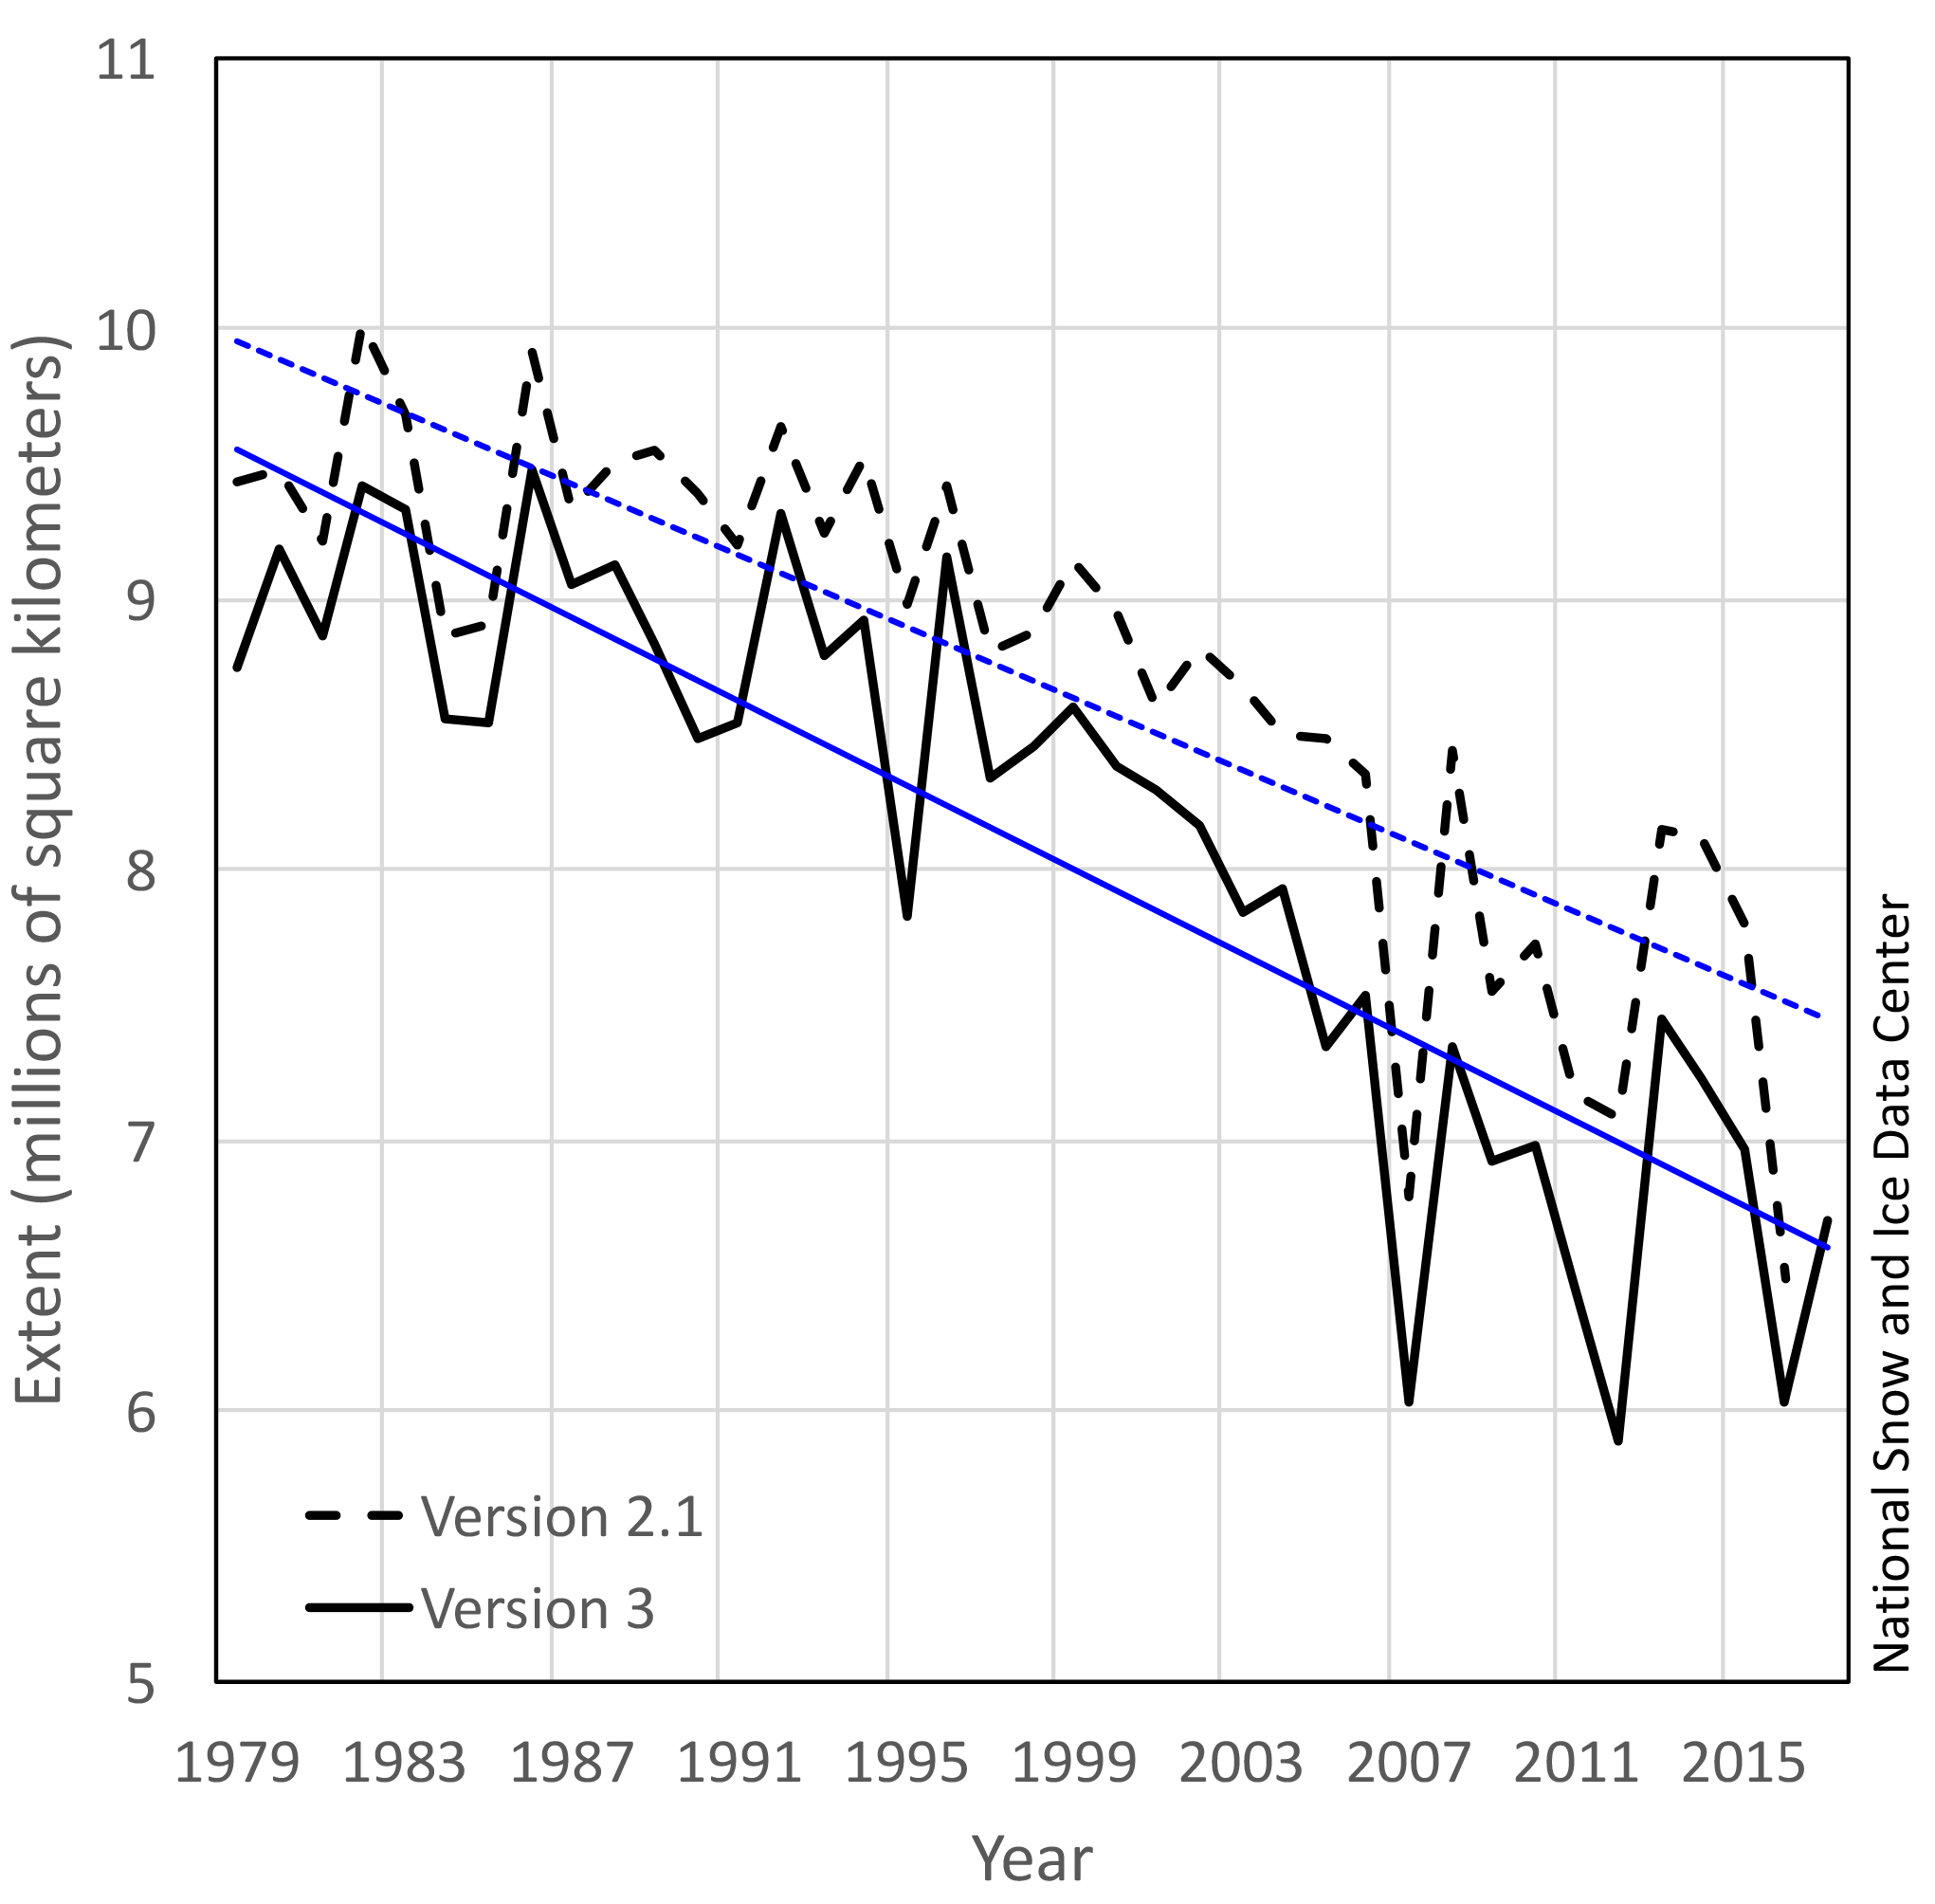
“Monthly averages of numerical ice concentration data can be calculated through two
different methods: 1) summing ice concentration data at each g
rid cell throughout a month, dividing by the number of days within a particular month to get average concentration for that grid cell, and then applying the 15 percent concentration
threshold to the gridded field of average ice concentrations before deriving monthly
area and extent, or 2) applying the 15 percent concentration threshold to the daily
gridded field of concentration data before deriving that day’s area and extent; and then
simply averaging those daily values over the course of the month. The former method is
the basis for the numerical algorithm in V2, while the latter describes V3.”
They were quite open about it. A number of interested parties queried why their monthly results didn’t agree with their daily results and they explained how they did it and then modified the method in response to the questioning in order to make it more intuitive to their audience. Basically any pixel that showed up over 15% for a single day was counted as being ice covered for the whole month, so if you had an ice flow which started in one pixel and drifted through say 5 pixels during that month then it would be quintuply counted which is why that method scored higher than just averaging the daily extent.
Thanks Phil….unfortunately that explanation makes sense….;)
Must have been really windy after 1996…and progressively got windier
Latitude January 5, 2018 at 5:15 pm
Thanks Phil….unfortunately that explanation makes sense….;)
Must have been really windy after 1996…and progressively got windier
Well the ice has got thinner and more mobile over that time and the pixel size has got smaller which could make the distinction between the methods more noticeable.
Interestingly NSIDC is showing the current Arctic extent at the lowest for the time of year.
Phil. Griff BenBen Nick Stokes
True. And, for 8 months of the year, the LESS Arctic sea ice is present, the GREATER the heat loss there is from the newly exposed Arctic Ocean into the Arctic air and then into space’s infinite darkness. It is only mid-April to mid-August (Day-of-Year 102 to 224) that the Arctic sun actually heats the exposed Arctic Ocean if any additional sea ice melts from its average value. The rest of the year? The other 243 days of the year?
Less Arctic sea ice = A colder planet.
If they are using the same method on both ends……fall refreezing….and spring melting….then they would show an equally huge increase in spring……they don’t
Phil,
Would that mean the wandering pixel ice floe which meanders through 5 locations on 5 days would then essentially be not counted as ice cover?
Bryan A January 6, 2018 at 9:12 am
Phil,
Would that mean the wandering pixel ice floe which meanders through 5 locations on 5 days would then essentially be not counted as ice cover?
No it means it would only be counted once instead of five times.
In the old method any pixel which contained more than 15% ice for a day during the month was counted as if it had been ice covered for the whole month. In times when the ice was particularly mobile this artificially increased the average ice extent for the month. Numerous people were puzzled why the monthly average extent sometimes exceeded the average of the daily ice extent and NSIDC responded by explaining how their calculation was done. They eventually changed to the more intuitive method of averaging the daily extent to avoid the confusion.
“Caught red handed again.”
Proved by quoting their own clear statement about the improved resolution.
How can this new method be applied retroactively so that we can see how the values compare over time or record keeping (using the method they’ve just moved away from)?
How have they shown it is “improved”? It is not even a real number, as the average of something over a period never actually existed. There was ice one minute and a different amount if ice the next minute.
You and they are claiming that a non-existent number is now more accurate than a previously non-existent number.
I presume this is the sort of garbage that gets put into the computer models which produce their own garbage which then updates the data garbage Which then ——-!. Indeed a vicious circle.
Sorry to intrude, but am I reading this correctly? Has Mann’s suit against Steyn, National Review and American Enterprise been decided/dismissed?
https://efile.dcappeals.gov/public/caseView.do?csIID=54941
Yikes!
I guess some one didn’t want Mann on the stand, as he would have to lie to support his thesis, and he is probably about as good a liar and he is a scientist. He would have exposed the whole fraud:-)))
I couldn’t understand it. It looked like this was Steyn’s suit against Mann.
The same site also deals with the Competitive Enterprise Institute suit against Mann, and is again completely non-understandable. Both of these have the notation Decided/Dismissed. but without an accompanying date, as far as I could see.
https://efile.dcappeals.gov/public/caseView.do?csIID=55550
What was Mann appealing? And on behalf of which party did the District of Columbia file an Amicus Curiae?
n/m Mann was the appellee.
It’s the Appeals Court. The case is listed as “MARK STEYN, ET AL V. MICHAEL E. MANN, PHD”. It’s them suing Mann that has been dismissed. And the events list says
““F/O DISMISSING THESE APPEALS AS MOOT and the DISMISSALS ARE W/O PREJUDICE…”
Doesn’t seem a big deal.
Nick,
First, IANAL, and others (ristvan??) I’m sure will comment, but my understanding is that a dismissal w/o predjudice is a big deal. My understanding is that dismissal WITH prejudice means the suit can’t be refiled. A dismissal WITHOUT prejudice means it can. Someone please help me?? 🙂
Also, that’s February of LAST year. I’m guessing if the case is still ongoing, that’s probably meaningless.
PR, you are correct. Dismissal with prejudice means cannot be refiled. Mere dismissal means it can be refiled, presumably with different claims and grounds from the original lawsuit dismissal.
What inspired me to look at the case status was this…
“Fatal Courtroom Act Ruins Michael ‘hockey stick’ Mann | Principia Scientific International”
https://principia-scientific.org/breaking-fatal-courtroom-act-ruins-michael-hockey-stick-mann/
If you search for Mann’s name in the database, four case #’s are listed, all annotated “decided/dismissed”
I’m very confused.
The actual decision was made over four years ago, and is here. It is of no significance. There was a fault in the appeal as filed, so they filed a new one. That rendered the old one moot, as the court then decided, and dismissed it. This latest seems to be just tidying up.
Absolute, mindless crap. The issue was SLAPP, a law prohibiting filing lawsuits against others (Mann frivolously filing against Stein) to suppress their 1st Amendment rights.
The ignorance, laziness, politicization and outright stupidity of a DC judge allowed this crap to continue into a consideration of SLAPP law itself. The uncontrolled, self-administration of the courts are to blame. Impeach them en mass.
This doesn’t seem to be anything new.
The case is still in the DC Appeals court. Competitive Enterprise Institute has asked for a re-hearing (by the full DC Appeals Court) to overturn the decision made (in December 2016) by a three judge panel of the Appeals Court. That decision upheld the lower court’s refusal to grant a dismissal under DC’s Anti-SLAPP Act (Strategic Lawsuit Against Public Participation). The Appeals judges did throw out part of the case against National Review and the claim for “Intentional Infliction of Emotional Distress”.
Stein did not appeal the lower court decision, but his counter-suit can’t proceed until these appeals are concluded. Mann did not appeal the rejection of his Anti-SLAPP motion against Stein’s counter-suit.
Six years into the case, no evidence has been presented yet.
Sorry to go a little more off topic. Saw this at Small Dead Animals. Sally Yates gets a mention. The swamp is indeed deep and wide. A little long but a great presenter and a riveting, frightening snapshot of the DOJ
Howard Root; Cardiac Arrest
They don’t realize, every time they change like this….all they are saying is we didn’t know what we were doing before……………….when we swore up and down that we did
And they wonder why people are not paying attention any more
Latitude
One consequence is that the earlier claims for decline were excessive. The recent-years rate of decline is also steeper. The thing I noticed is that the stall in decline has been eliminated. Ice extent has been rising slightly for a few years. That is now disappeared.
Tony Heller has been pointing out the data fraud, and historical revisionism by these liars for Years now ! I don’t know why anyone even goes on about the substance of Co2 generated climate change – it’s well documented to be made up data from either defunct or nonexistent stations, Or, altered from raw (TOB excuse).
That is what the Real Story is.
Yes he has and, even better, he has been doing it with very concise posts and graphs which make his points immediately obvious to even the short-attention-span audience. Moreover, he is as brutally sarcastic and blunt about these things as they and their perpetrators fully deserve. Why respect professional liars?
Yet his blog site does not get listed here at WUWT. Now, WUWT?
sailboader – It is an old feud.
And it’s a pathetic one. They should be working together, but there are reasons why cooperation could be counterproductive to ones’ interests. Tony’s analysis is correct. And it’s backed up by Bob Tisdales’ analyses and The satellite temperature data.
There’s certainly been some human-caused climate change due to land use changes, and satellite data shows small, incremental temperature changes coincident with major El Ninos. This is what Tisdale’s ocean temp analyses have demonstrated. But nothing outside natural variability. And as an engineer with a career in process control, the variations are outside the accuracy of even NIST calibrated instruments.
As someone who has admired and supported Anthony since the days he was lifting this site off the ground, It’s both tragic and disappointing to me that Anthony has taken this position.
Concur that is a crying shame that apparently the hatchet cannot be buried. Other blog sites I go to use Tony’s work with attribution but the only time I see it here is when a poster brings it up. Tony has done a fantastic amount of great work and it is a shame “…the world’s most viewed climate website” does not present and expand upon it. I would love to see Anthony and Tony and some others sitting side by side at a table before a senate committee testifying one day. Preferably during the coldest day of a cold winter after a friendly senator turned down the thermostat and opened all the windows to the chamber the night before.
With sea ice floating around the streets of Boston will that be included in this years figures?
Mjw
That made me chuckle
The Mayor of Boston says this is due to global warming. He stated this on NBC news. He claims the oceans are rising and that caused the flooding. He was standing in freezing cold with snow and ice all around, saying global warming caused this, as did the tiny rise in sea level. The insanity is strong there.
Yea! They were so concerned about SLR in Boston that they put in a tunnel that was the highest budget public works project for a hi-way at the time. AKA: “The Big Dig”. https://en.wikipedia.org/wiki/Big_Dig
Mjw,
This is actually a valid point. The sea-ice in Boston Harbor and up the coast in the Gulf of Maine is indeed reflecting sunlight, (as is the snow-cover clear down to Florida). Furthermore the sun at latitude 40 north is likely higher now than it is at the Pole at the solstice. Lastly, the ice has just started to melt at the solstice, at the Pole. The open water never starts to appear until August and September, when the sun is already lower, and by September the sun is so low that water, especially when calm, reflects sunlight better than dirty ice does. The entire Albedo arguement is humbug full of holes, once you start getting down to the brass tacks of details.
Boston Harbor and the Gulf of Maine and Massachusetts Bay also saw considerable sea-ice in 2014. Such sea-ice isn’t included in the above data. The entire time the ice was there its total area reflected X units of sunlight, and the sea didn’t absorb Y units of sunlight. With the sun as high as it is at 40 degrees north latitude, I’ll bet X is more than the entire amount of sunlight in the entire area north of 75 degrees north latitude, when the sun is on the verge of setting for six months in September.
NSIDC only uses the data it finds convenient. I lost faith in them years ago, sad to say.
Wow! How did they just manage to disappear 1.2 million km of ice? Don’t tell me, Peter Wadhams was doing a little prank with David Blaine and something went terribly wrong? Hope Santa is ok. Having said that, the disappeared ice is now probably occupying that mysterious island in Never Never Land called Ridicule where the alarmists have also hidden the remains of the Medieval Warm Period, the Little Ice Age, 1940s blip, 1970s cooling, the ‘Pause’, all those healthy polar bears and the troposphere ‘hot spot’. Honestly, the addiction to phoney adjustments to official records, by a small cadre of national gatekeepers to maintain a failing narrative, is becoming more and more laughable as it is obvious. Smacks of desperation it would seem. Is it getting colder
outside by any chance?
Imagine what these data molesters would be able to get away with without the internet watching and saving their past versions. This whole thing is like the constant convenient revisions of the Ministry of Truth in Orwell’s 1984… except for the memory of the net, while it lasts.
On the bright side, they are getting so desperate and obvious that only the gullible True Believers will swallow this. And with the current administration there may finally be consequences for these so called ‘scientists.’
Boston Mayor, Marty Walsh says flooding in Boston during blizzard was caused by AGW…
https://spectator.org/boston-mayor-global-warming-responsible-for-blizzards-destruction/
Of course, no one is taking notice of the “supermoon” that was high in the
sky as the tide came in.
I took notice.
My local weatherman helped me out and talked about the flooding in Boston, and how the flooding had gotten into areas it never got into normally, and I thought to myself that the Alarmists would probably try to tie this to CAGW, but then the weatherman explained that the cause of the higher flooding level was due to the “Supermoon” which is at just about its closest approach to Earth, which causes the tides to be higher than normal, and it was also in conjunction with a strong low-pressure system that was blowing hard and adding to the heighth of the tides.
A Perfect Storm. 🙂
“Boston Mayor, Marty Walsh says flooding in Boston during blizzard was caused by AGW…”
He is actually talking about CAGW, not AGW. Flooding is a Catastrophic event. So if he is claiming that human-caused Global Warming/Climate Change is causing the flooding, or adding to its devastation, then he is talking about CAGW.
Either way he’s a total twat scarcely adequate mentally to live independently.
the mayor is an idiot. it also doesn’t say much for the people that voted him in.
The first usefull sea ice data began in 1973 with the launch of the ESMR satellite. Why is six years of useful data never refrenced? I know the 1978 launch was a better instrument, however does his mean each time a better vehicle is available all previous data is to be ignored?
Was the ESMR extremely poor or did its data not fit the narritive?
1979 was the century maximum sea ice extent
https://realclimatescience.com/government-arctic-sea-ice-fraud/
And was up there with the EXTREMES of the LIA.

The decrease is actually a RECOVERY back towards more normal levels
But the extent is still up there in the top 10% or so of Holocene ice extents.

It’s not clear exactly what the linked graph represents. For example what is the data point which is encircled in red actually measuring. I doubt if it is an annual mean figure so it’s not consistent with the graph to the left. Also what does “sea ice amount” mean? Is that extent or area?
Looking at the running mean 1979 appears to be slightly above the long term mean.
It would help if Tony Heller provided a clearly labelled completed up to date reconstruction with links to data. However I suspect this will still sow a significant decline in sea ice (extent and area) over the past 20 years.
I am not a CAGW advocate but I have no time for misleading presentations on either side. Sadly, the worst examples of this tend to be from sceptics.
John Finn: The worst examples (of misleading presentations) comes from sceptics? Please provide your very worst example, and then stand by for a few counter examples to get the discussion going.
“I doubt if it is an annual mean figure so it’s not consistent with the graph to the left.”
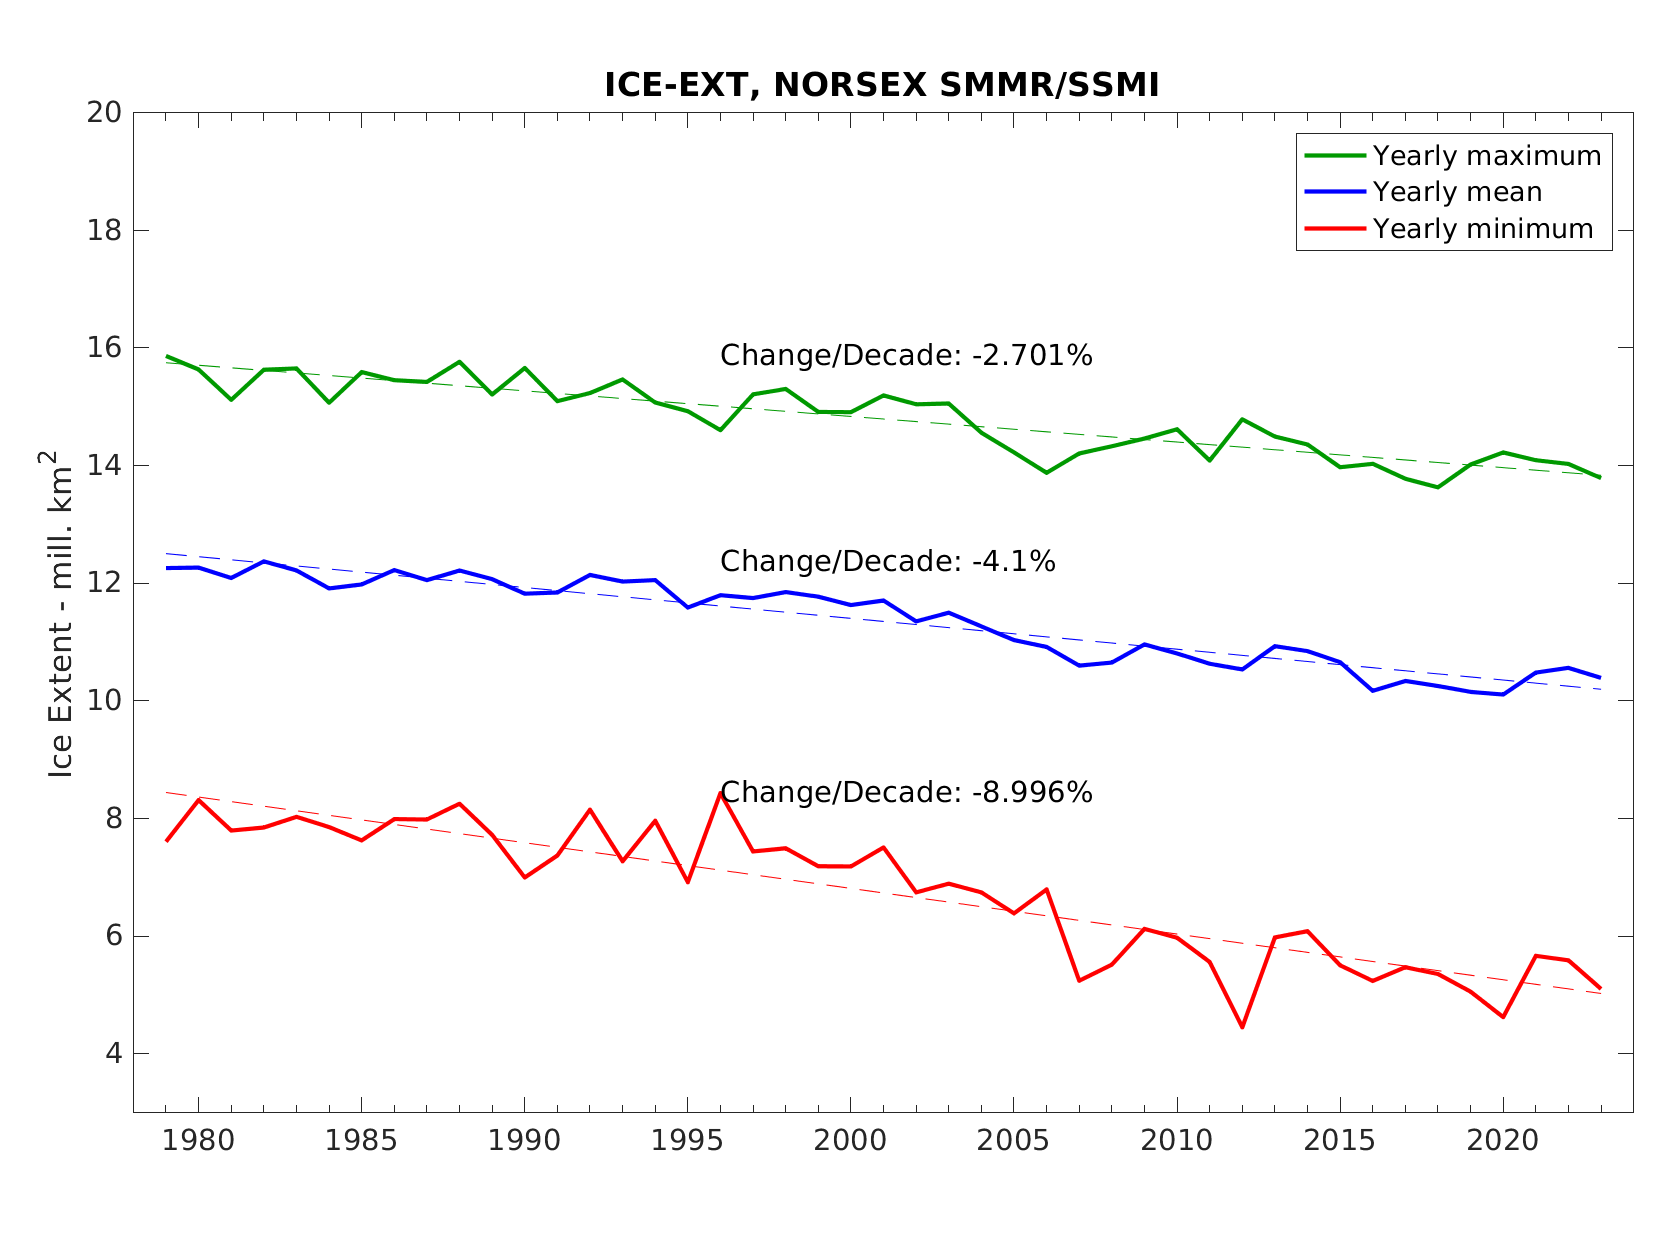
The (TH-) claimed annual mean figures seem unbelievable. According to this plot from the WUWT sea ice page, annual averages have been gradually declining from about 12 to 10 million sq km. These look like minimum figures.
Paul Courtney: Tony Heller regularly posts misleading stuff .Perhaps you can think of a reason why he doesn’t show a complete up to date sea ice reconstruction.
However, probably the worst example is Don Easterbrook’s “study”. This provoked quite a robust discussion on WUWT a few years back. Even noted sceptics were highly critical of Easterbrook’s temperature reconstruction and projection.
icisil I cannot find the graph labeled Figure 5.2 in that document.
Can you post the URL of the source document and the page number?
This is a very interesting graph if it was actually was published by the Office of Energy Research and a copy is available online for independent evaluation. But but I’ve been burned before by trusting second hand sources.
sw, Heller provided the link below the image.
“The largest differences for the Arctic occur during the month of October due to the rapid ice growth rates typical at that time of year…”
Doesn’t that make October the worst month of the year to use for making comparisons? Why choose that month to highlight?
Oh yeah:
“October is also the month with the largest trend difference, increasing in magnitude from -7.4 percent per decade to -9.3 percent per decade. Changes in Arctic trends for other months are much smaller.”
Now I understand.
As always, they also are preparing for the future. I wondered how they were going to deal with what began to look like a turnaround “pause”, a bottoming out over the last several years- the big el nino gave them some breathing room.
They know that 1979 was at the end of a 40yr cooling period so that ice measurements from then were coming down from a 20th Century peak. Reports on Arctic ice in the 1930s chronicled the plight of seals, etc., US subs surfaced at the N Pole in 1950s before the refreeze had advanced:
https://wattsupwiththat.com/2009/04/26/ice-at-the-north-pole-in-1958-not-so-thick/
During the Surface Temperature Pause, the Team came to understand the 60-70yr cycle so they have been worrying about a cooling and recovery of the ice in the coming years.
exactly.
Lying $cumb@g$.
They are positively certain that their past uncertainty was within an acceptable range of error for settled science and that this should NOT detract from future forecasts subject to the same past uncertainties and requisite adjustments. In other words, “Duh uh duh uh duh uh wha oh ah”
“First, the bet-winning difference is that sea ice decline goes from 7.4% per decade to 9.3% per decade.”
You have referred everywhere to “sea ice decline”. But all you show are the October monthly figures. Have you looked at other months? They themselves say tha October shows the largest difference.
It’s actually not surprising that the October numbers should be lower. It is a time of transition from near zero rate at ice minimum to almost the fastest rate of freezing in the year. The essential difference in the changed method is the use of daily rather than monthly averaging. More resolution. That gives greater weight to the early days in the month when the changes is slower.
the word you need is lowered….
Let’s see if they get the same rate with their new formula on the other end…..this should push April off the charts, more ice than ever
I just copied the NSIDC description straight off the NSIDC web site. They highlighted the extreme case of October, not me. If you want NSIDC to analyze other months, or calculate the trend differences for each of the other 11 months, take it up with them.
But notice that the graph is a graph of monthly data so every month is represented in the graph. It looks to me like the solid line is below the dotted line at every point, meaning every month is lower in every year after the revision.
And the 1.2 MM sq. km. is huge in Oct. 2012. To my eye, it looks like the absolute monthly value goes from 7.1 to 5.9 MM sq km. That would be a 17% decease just from this change of method. Missing 17% of the ice because you did the same steps in a different sequence, which is what this boils down to, makes you wonder how much analysis and evaluation they did before they picked that original method.
“it looks like the absolute monthly value goes from 7.1 to 5.9 MM sq km”
Yep it does.. 😉

“They highlighted the extreme case of October, not me.”
Yes. But they said at all stages that it was October data. You just said
“I bet that this change in computation method increased the rate of decline of arctic sea ice compared to the rate of decline calculated under the old method. “
No mention that it was October only.
“But notice that the graph is a graph of monthly data so every month is represented in the graph.”
The caption says
“This chart compares the monthly October Arctic sea ice extents”
It is October only.
“If you want NSIDC to analyze other months, or calculate the trend differences for each of the other 11 months, take it up with them.”
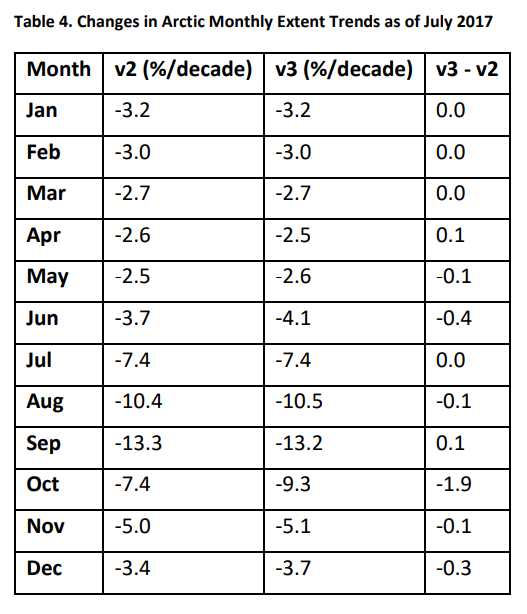
In fact, they have done it, and it is in the very informative report that you linked but apparently didn’t read. They give the following table. Changes in trend for months other than October are very small.
You do realize the same method that makes October (fall) go down as it’s re-freezing…..would make April/May/June (spring) go up as it’s melting….would have to if they a legit
It doesn’t
And that should even out in later months then, when the early days if melting show less melting than the later days. Oddly it doesn’t though.
The simple question is this – would they have changed the methodology if it had showed the opposite results?
Who knows.
“would they have changed the methodology if it had showed the opposite results?”
In fact the only monthly average that ever gets any publicity is the September average, because that is often used as the value of the minimum. And that did show the opposite result. It rose.
” transition from near zero rate at ice minimum to almost the fastest rate of freezing in the year. …That gives greater weight to the early days in the month when the changes is slower.”…
..and yet the table you posted gives no weight to the early days in the months, late spring early summer, when melting starts and the change is slower……the opposite….they are all essentially the same
nope…this does not pass the sniff test one bit…they are saying it only/mostly affects Oct when it freezes faster, in only one month…..yet does not affect spring summer when it can melt even faster….bullsh1t
They can get rid of an 8 year pause through adjustments, but cannot get rid of a 25 year pause. This just buys them some time.
“What me worry”?!
It will become warmer until suddenly it is colder…
How did you go bankrupt? Slowly, then suddenly…
Sea ice at both poles alternate going from around 3 E6 km^2 summer to 13, 15, 16 etc. E6 km^2 winter EVERY year – and have for eons!!!. Study the graphs on climate4you. And watch out for truncated scales that exaggerate trends!
Yes, my Chevrolet is still running for “eons”….
Sea ice at both poles alternate going from around 3 E6 km^2 summer to 13, 15, 16 etc. E6 km^2 winter EVERY year – and have for eons!!!
Eon = bazzilion years.
I think you are only telling one half of the story. Look at
https://nsidc.org/the-drift/data-update/noaansidc-releases-sea-ice-index-version-3-0/
for more details. It states that
“V3 monthly average areas are slightly greater than those from V2. Conversely, V3 monthly average extents are slightly less than V2.”
And V3 appears to be a more obvious way to calculate the average values. Again from the web page:
“The change is in response to questions about what seemed to be an inconsistency between daily and monthly values. When users summed daily values, and then divided by number of days in a month to get a monthly average value, that number was different, and sometimes quite different, from the monthly average numbers we presented.”
So now they have a simple clear way of calculating the monthly average – take the daily value, sum it and
divide by the number of days in a month. This does not seem to be an attempt to fiddle the data at all but rather a simple and clear way of calculating the average.
Trump needs to drain the CAGW Swamp at NASA and NOAA. Leaving these CAGW “Fifth Columnists” in place is damaging to the taxpayers and to science and to truth.
Won’t happen. Bureaucracy gets bigger.
The more I read about “science” and “scientific integrity” the more I’m prone to trust what the Bible says in Ecclesiastes 12:12 that reads, “Of making many books there is no end, and much study is a weariness of the flesh.”
Data changes.
Models change.
Revisions change.
Change, change, change. It’s endless, and forever always in the same direction to uphold some preconceived doom we’re soon to experience.
I, however, think tonight I shall enjoy a nice tipple of whiskey, or perhaps a martini, kick my feet up on the sofa, and relax to some light musical entertainment.
Yoda sez
On pins and needles the next “adjustment” I await
yada, yada, yada!