Arctic shows no sign of returning to reliably frozen region of recent past decades
Despite relatively cool summer temperatures, observations in 2017 continue to indicate that the Arctic environmental system has reached a ‘new normal’, characterized by long-term losses in the extent and thickness of the sea ice cover, the extent and duration of the winter snow cover and the mass of ice in the Greenland Ice Sheet and Arctic glaciers, and warming sea surface and permafrost temperatures.
Highlights
- The average surface air temperature for the year ending September 2017 is the 2nd warmest since 1900; however, cooler spring and summer temperatures contributed to a rebound in snow cover in the Eurasian Arctic, slower summer sea ice loss, and below-average melt extent for the Greenland ice sheet.
- The sea ice cover continues to be relatively young and thin with older, thicker ice comprising only 21% of the ice cover in 2017 compared to 45% in 1985.
- In August 2017, sea surface temperatures in the Barents and Chukchi seas were up to 4° C warmer than average, contributing to a delay in the autumn freeze-up in these regions.
- Pronounced increases in ocean primary productivity, at the base of the marine food web, were observed in the Barents and Eurasian Arctic seas from 2003 to 2017.
- Arctic tundra is experiencing increased greenness and record permafrost warming.
- Pervasive changes in the environment are influencing resource management protocols, including those established for fisheries and wildfires.
- The unprecedented rate and global reach of Arctic change disproportionally affect the people of northern communities, further pressing the need to prepare for and adapt to the new Arctic.
Video:
There are several sections of the report, for temperature, sea ice, etc. You can access each section here: http://www.arctic.noaa.gov/Report-Card/Report-Card-2017
One graph in the sea ice section caught my eye:

The September rate of loss is about 4 times higher than the March rate of loss. This suggests to me that something I’ve long mentioned – albedo changes which primarily manifest themselves in the summer when there is more incoming solar radiation might be a big part of the issue. Carbon soot, specifically.
This is supported by something I covered at AGU14: satellites detect albedo change in the Arctic, resulting in more absorbed solar radiation
From that study:
Since the year 2000, the rate of absorbed solar radiation in the Arctic in June, July and August has increased by five percent, said Norman Loeb, of NASA’s Langley Research Center, Hampton, Virginia. The measurement is made by NASA’s Clouds and the Earth’s Radiant Energy System (CERES) instruments, which fly on multiple satellites.
![sea_ice_fraction_change_and_absorbed_solar_radiation_change[1]](https://wattsupwiththat.files.wordpress.com/2014/12/sea_ice_fraction_change_and_absorbed_solar_radiation_change1.png?quality=75)
The Arctic Ocean is absorbing more of the sun’s energy in recent years as white, reflective sea ice melts and darker ocean waters are exposed. The increased darker surface area during the Arctic summer is responsible for a 5 percent increase in absorbed solar radiation since 2000. Image Credit: NASA Goddard’s Scientific Visualization Studio/Lori Perkins
While a five percent increase may not seem like much, consider that the rate globally has remained essentially flat during that same time. No other region on Earth shows a trend of potential long-term change.
“Arctic shows no sign of returning to reliably frozen region of recent past decades”
It will do when the AMOC slows down and the AMO becomes negative again like recent past decades.
How much did that Report Card cost?
£97 and $0.97 sense.
What about dust storms from North China affecting arctic albedo? See https://www.sciencedirect.com/science/article/pii/S0921818106000440.
Are there other contributors such as coal burning particulates from China, such as the arctic oscillation – https://link.springer.com/article/10.1007/s11442-011-0839-4. also see http://www.bbc.com/news/science-environment-39279500.
Also see https://wattsupwiththat.com/2009/08/21/soot-and-the-arctic-ice-%e2%80%93-a-win-win-policy-based-on-chinese-coal-fired-power-plants%e2%80%9d/..
The DMI algorithm for sea ice extent 15% has given out again and is starting to go up. Time for a break in data for 6 weeks while they force a new adjustment through.
Or will it [ever] go into a steep upcline?
Fingers crossed, warm in Aussie today so should be absolutely freezing up north.
“The September rate of loss is about 4 times higher than the March rate of loss. This suggests to me that something I’ve long mentioned – albedo changes which primarily manifest themselves in the summer when there is more incoming solar radiation might be a big part of the issue.”
I think it is basically geometry. In summer, most of the sea ice border is away from land (passages are open, or nearly), and can move either way. Change in area is distance advanced by perimeter. In winter, the openings are narrow in the Pacific, and pretty much limited to the North Atlantic. In Canada and Siberia, the ice front in March is hard against the land.
The gain of ice over September has actually been increasing.

Andy! You were not supposed to notice that inconvenient fact!
Bad doggie. Bad. /sarchasm – That gaping whole between a liberal and reality.
“Change in area is distance advanced by perimeter.” I don’t understand.
If ice advances 1 km over a 100 km front, area gained is 100 sq km. If it is over a 400 km front, area gained is 400 sq km. Sea ice can only advance where there is open sea.
And thus, Arctic sea ice cannot expand too much past its current March-April maximums of 14 – 15 Mkm^2 sea ice. The Hudson Bay is completely covered. Sea of Okhotsk and Bering Sea are small areas each, and are now right at half covered by sea ice at maximum. Not much left to expand there. The total Arctic Ocean is 14 Mkm^2 – but there is only a little room around the Alaskan and Siberian coasts. Atlantic openings are very, very far south and will melt too fast.
And by the same argument, it can’t diminish much, until things change a lot. It doesn’t thaw at the top Canada and Siberian shores until summer. That’s the geometric argument why March area is more stable than September.
“until things change a lot”
And they haven’t……
Arctic sea ice extent is still above what it has been for some 90-95% of the Holocene.
Above the extent of the MWP, and FAR above the extent of most of the first 3/4 of the last 10,000 years.
As expected the BBC ignores the benefits and just concentrates on the propaganda. http://www.bbc.co.uk/news/science-environment-42330771 “Is that true, or did you hear it on the BBC?”
Did they seriously say that this has been the second warmest September since 1900?!!!
Because like they would know that…how? I don’t generally use profanity when I comment but on this occasion I will make an exception.
NOAA is a f”cking disgrace and should be defunded immediately.
There estimate of Greenland total mass loss seem suspect and I wonder if the failing GRACE2 satellite had any impact. 2014-15 and 2015-16 were estimated to have lost 190 Gt. During 2014-15 the surface mass only gained 200 Gt. From that we can estimate that Greenland must gain about 400 Gt each year to stay in equilibrium with glacier discharge.
However in 2016-17 Greenland had gained 550 Gt of ice. That would suggest Greenland gained ice. Yet despite adding 300 GT more than previously, they estimate based on GRACE that Greenland ice loss had increased to 232 Gt .
To be valid, that means 2016-17 had to discharge and extra 300 Gt, but that doesn’t jive with the trends in discharge the last 3 years.
This graph of Total Greenland Ice Mass since 1900 tells the real story.

” but that doesn’t jive with the trends in discharge the last 3 years.”…..
Not with temperatures or ice berg sightings either
What “reliably frozen region”? That stuff blows around up there; any “reliably frozen region” isn’t likely to stay in the same place.
My findings show that, on average, there has been zero warming in the SH, over the past 40 years.
All warming took place in the NH.
At the same time we see that over the past the (magnetic) north pole has been moving.
https://tse1.mm.bing.net/th?id=OIP.qQvtyZa9CbJcYpQNLgAe0AFHC-&w=200&h=105&c=8&rs=1&qlt=90&pid=3.1&rm=2
Quite fast, actually, when you compare its position change over the past 50 years with that of a 100 years ago.
I am sure this has to do with the magnetic stirrer effect that sun’s magnetic field has on the planets.
Come down 1 km into a gold mine here (in South Africa) and learn how big the elephant in the room really is.
http://www.earthweek.com/2011/ew110311/ew110311h.jpg
Perhaps this picture illustrates my point more clearly. note how little movement there really was between 1800 and 1900? And then it just went…, leaving us here in the SH in the cold.
A small wooden ship, the St. Roch, sailed through the Northwest Passage and across the high Canadian Arctic twice, in 1942 and 1944. Try doing that today.
These voyages followed soon after the global warming period that ended circa 1940. What was the ice extent and thickness then? Probably less than, or no greater than today.
Starting one’s graph on Arctic ice extent in 1978, after the ~35-year global cooling period from ~1940 to ~1975 is dishonest – “loading the dice”” , a standard tactic of global warming fr@udsters.
https://www.vancouvermaritimemuseum.com/permanent-exhibit/st-roch-national-historic-site
THE ST. ROCH – A TRUE CANADIAN ADVENTURE.
Built in British Columbia, named after a parish in Quebec, captained by a Norwegian immigrant, crewed by farm boys from across the country, and helped by the Inuit, the St. Roch was the first vessel to sail the Northwest Passage from west to east (1940-1942), the first to complete the passage in one season (1944), and the first to circumnavigate North America.
One of the only ships in service in the Arctic in the early part of the 20th century, the St. Roch is made of an unusual design of thick Douglas Fir planks reinforced with heavy beams to withstand the ice pressure and an outer shell made of some of the hardest wood in the world, Australian Eucalyptus ‘iron bark’.
Between 1928 and 1954, St. Roch logged tens of thousands of miles crossing and re-crossing the Arctic, acting as a floating detachment of the RCMP in the North. At various times a supply ship, a patrol vessel and a transport, the St. Roch was the only link between the various scattered northern communities. Yet it had not yet accomplished the feat for which it would become famous. For many years, it had been the dream of Captain Henry Larsen to cross the Northwest Passage, just as Amundsen had done for the first time in the Goja in 1903. But time and time again, the dream had to remain a dream.
Finally, with the outbreak of the Second World War and the Nazi invasion of Denmark (Greenland), the opportunity presented itself. Launched on its famous voyage on a secret mission to cross the Arctic during the war, this amazing vessel traveled through treacherous and uncharted waters to cross the Northwest Passage and the High Arctic, with only a small crew of steadfast men who had just their skill, talent and no small amount of luck to rely on. Incredibly, they managed to make the crossing not just once, but twice, and in only 86 days the second time!
” small wooden ship, the St. Roch, sailed through the Northwest Passage and across the high Canadian Arctic twice, in 1942 and 1944. Try doing that today.”
The route passed Banks Island that Larsen took in the St Roch,1944 has never sailed since.
Those that try the NWP have to sneak around the southmost path, through Cambridge Bay…
with the aid of satellite navigation.
AndyG55 December 13, 2017 at 2:15 am
Those that try the NWP have to sneak around the southmost path, through Cambridge Bay…
Well since there isn’t any ice there it makes sense, hardly sneaking:
http://greatwhitecon.info/wp-content/uploads/2017/08/SerenityStarboard-20170829-0404.jpg
AndyG55 December 13, 2017 at 2:15 am
Those that try the NWP have to sneak around the southmost path, through Cambridge Bay…
Well they sail through the ice-free route, hardly sneaking:
http://greatwhitecon.info/wp-content/uploads/2017/08/SerenityStarboard-20170829-0404.jpg
Thank you Andy – good comments.
AndyG55 December 13, 2017 at 2:15 am
Those that try the NWP have to sneak around the southmost path, through Cambridge Bay…
Hardly sneaking, not much ice either:

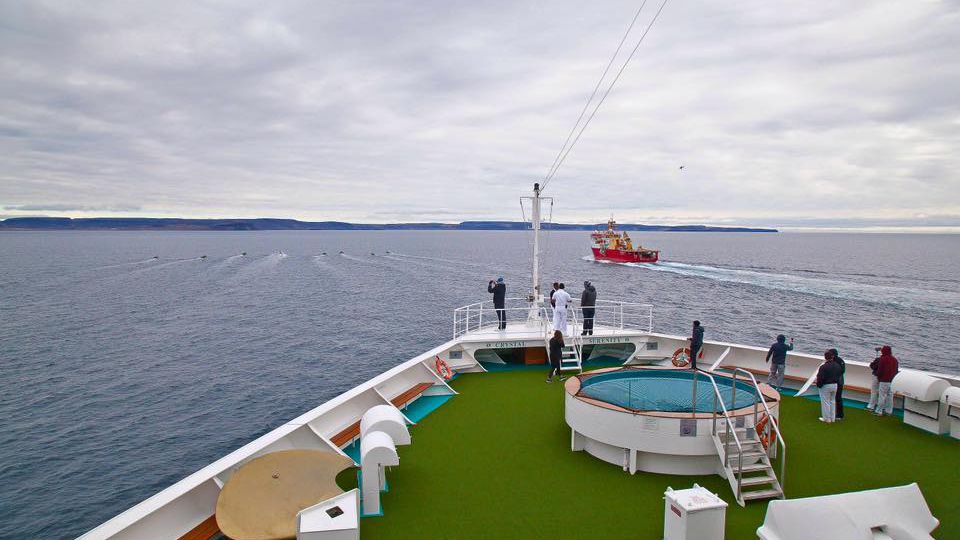
No Phil, they went through Cambridge Bay..
They did not use the Larsen route.
Thank you so much for pointing that out for everyone to see. 🙂
http://www.highnorthnews.com/wp-content/uploads/2016/04/Crystal-Sereneity-Route.png
AndyG55 December 13, 2017 at 2:14 am
” small wooden ship, the St. Roch, sailed through the Northwest Passage and across the high Canadian Arctic twice, in 1942 and 1944. Try doing that today.”
The St Roch’s first trip took 28 months and went by the same route as the Crystal Serenity, they had to blast themselves out of the ice on several occasions. As the pictures of the Serenity showed it’s not necessary to blast one’s way through Cambridge Bay these days!
AndyG55 December 14, 2017 at 11:57 am
No Phil, they went through Cambridge Bay..
They did not use the Larsen route.
Thank you so much for pointing that out for everyone to see. 🙂
I was pointing out that they were not ‘sneaking through Cambridge Bay’ as you said.
Why go through the northern Larsen route if there’s no ice in the southern route.
Larsen’s northern route was not very easy and he got stuck in the ice several times:
“From the beginning of August, they experienced heavy ice – and made slow progress – as well as lots of floe ice, and drifted in the ice-pack at one stage. They had to seek shelter at times but couldn’t determine their exact location at one point because the weather conditions were so bad. At the end of August they experienced lots of heavy, tightly-packed floes and were prevented from landing due to the ice conditions. A lot of the journey consisted of following up leads and anchoring were they could. They found the heaviest ice of the voyage at the entrance to McClure Strait, where they had to moor themselves to the ice floes, and it was only at the beginning of September that the conditions were noticeably different – so much so that it was noted : “It was really the only fine day we had during the entire passage…”. After that, it was back to the heavy, tightly-packed ice-fields and the bad weather, with hurricane-force winds almost capsizing the boat before they were able to find shelter. In fact, the “…season was the worst in years.””
The Nunavik went via a northern route a couple of years ago, cleared the NWP in 9 days via Prince of Wales Strait.
Less ice-cover in September gives more heat loss.
“Less ice-cover in September gives more heat loss.”
Less ice-cover gives more heat loss …. period. And when you look year to year at http://ocean.dmi.dk/arctic/meant80n.uk.php the increase of temperature and therefore the increase of heat loss has been happening almost exclusively in the winter.
There does not appear to be any evidence that summer albedo has any significant affect on arctic air temperature.
Not warming? Ice growing?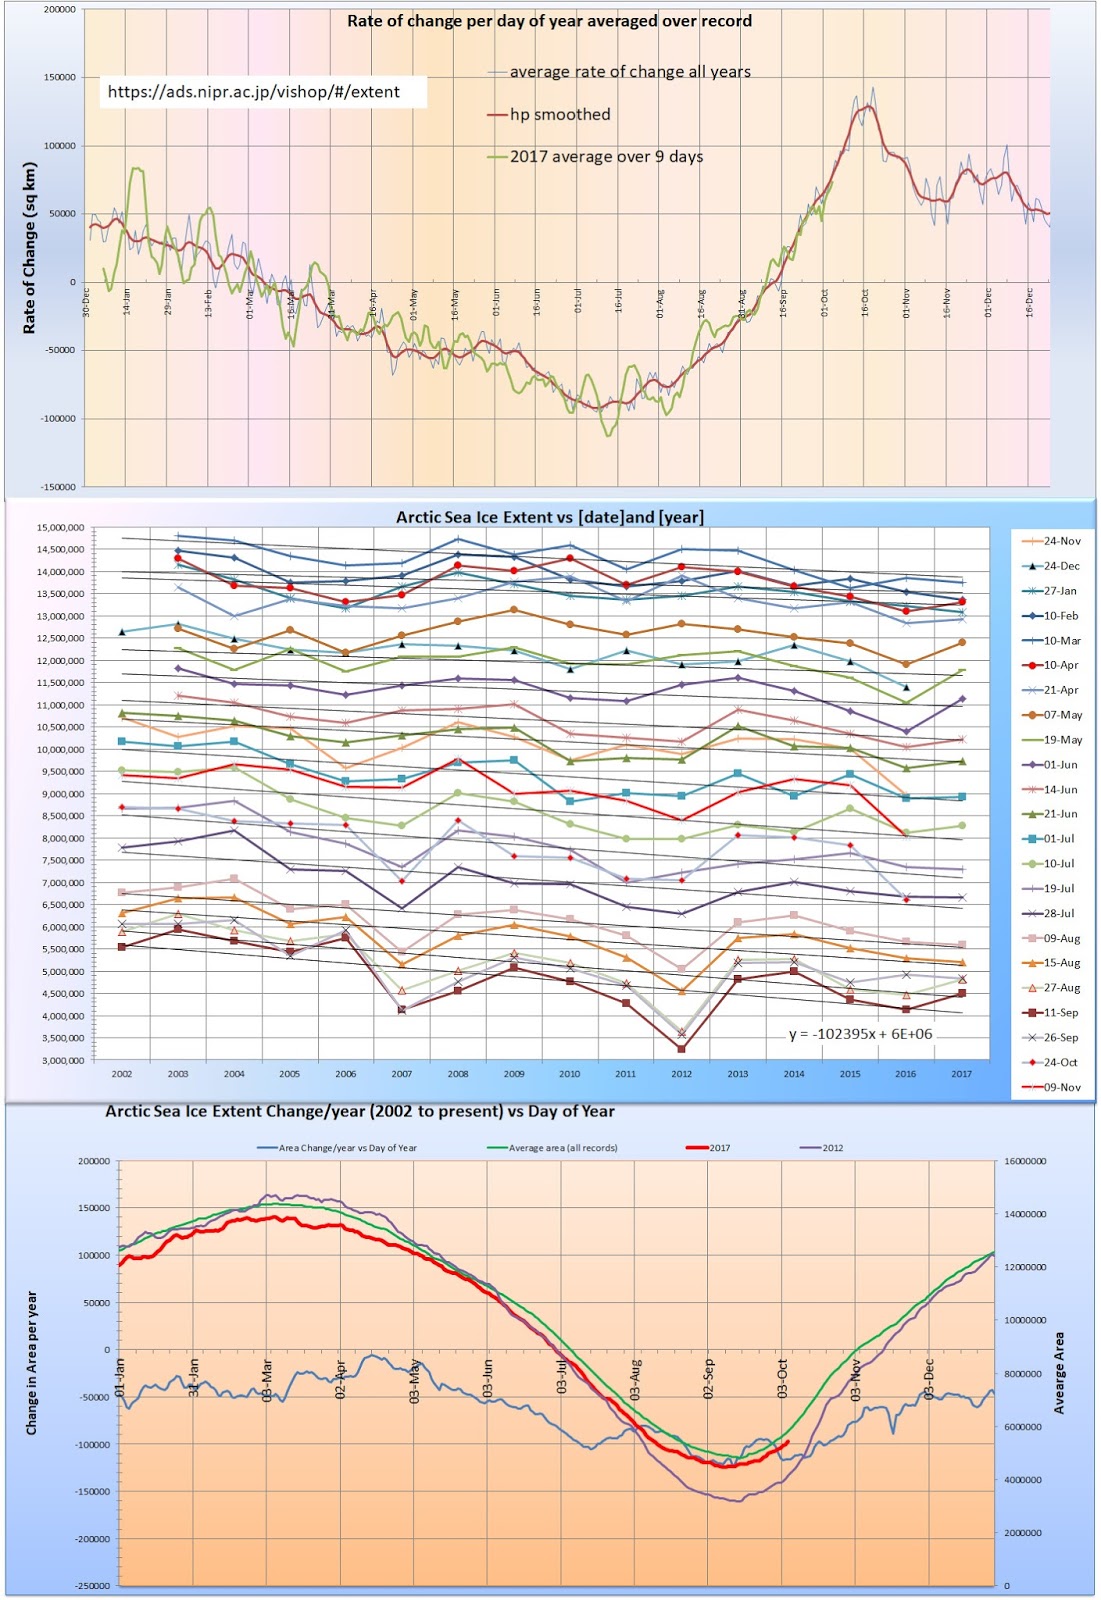
Not sure what planet you are talking about.
Some plot s
And have a look at the temp plot on the sea ice what page
Arctic sea ice quit retreating in 2012. It has grown since then. This was the first year since 1979 when it didn’t make a new, lower low within five years of a previous low. It has been flat since 2007 and growing since 2012.
Even NOAA’s cooked books show this inconvenient truth:
http://nsidc.org/arcticseaicenews/charctic-interactive-sea-ice-graph/
Other nations’ more honest sea ice estimates show the increase even more dramatically.
Interesting plots, thank you. What is your source and your process (the ads.nipr.ac.jp (japanese ?) address I have not seen before..
But your projected linear trend from 2002 through 2017 would be only be informative IF the sea ice were linear. And there is no specific reason to assume ANY linear relationship for sea ice (with date, CO2 levels, or the price of tea in China). If you wish to curve fit, even a crude sine wave fits the data better.
Specifically, since “climate” is the most recent 30 years of data, the “classic CAGW arctic sea ice areas of 1979-1987 must be removed from your linear projection.
Further, if a sine wave is assumed the three periods of interest then become :
1986-1996 (Arctic decreasing, but when the Antarctic began its decades-long increase towards record high sea ice areas in 2014!),
1996-2006 (decreasing but with a decreasing slope, as fits a sine wave nearing the minimum,
and 2007-2017 (generally increasing since the low point of 2007).
This report is nothing more than propaganda, as ice extent melt, etc has nothing to do with atmospheric conditions in the arctic ….. but rather is controlled by the rate of influx of warmer water from lower latitudes.
You don’t think ocean an atmosphere might affect each other?
The linear fit to the September min extent becomes less convincing with each passing year. It’s bottoming out. Time to try a polynomial or something.
Since retirement my goal has not to SEE ice unless it is floating in a beverage glass.
We spend summers where glaciers define recent geology.
Warmer is better,
NOAA predicts Greenland’s Ice Mass will increase by about 44 Billion tons this year after losing about 150 Billion tons/yr since the AMO started its 30-yr warm cycle in the early 1990’s.:
https://www.climate.gov/news-features/understanding-climate/greenland-ice-sheets-2017-weigh-suggests-small-increase-ice-mass
AMO’s 30-year cool cycle starts from the early 2020’s, and many scientists expect Greenland’s Ice Mass to again increase. The weakest solar cycle since 1790 starts from 2021, which will also likely add to cooler global temps and added Greenland Ice Mass.
Once Arctic Ice Extents start to show gradual increases, Greenland’s Ice Mass trends upwards and Antartica’s Ice mass continues to increase (as it has since 1992), ALL of CAGW’s dire predications will be busted: rapid global warming, Sea Level Rise, Ocean acidification, severe weather trends, etc.
I really think we’re witnessing the beginning of the end of the most expensive political ho@x in human history.
yep, but as with all bitcoin-type bubbles the true cost is determined in the final increments of the hyped spike.
NOAA still sounds like so many technical chart “experts” in the investment world of retail stock brokerage accounts. That requires a lot of chart watching and trend extrapolation indefinitely into the future with a noticeable lack of fundamentals involved.
most of you are still clueless about the reason for the arctic melt
https://wattsupwiththat.com/2017/12/12/noaas-arctic-report-card-released-at-agu17/#comment-2691902
In the 16th century my country man Willem Barentz went looking for a passage to east Asia via the north pole. Unfortunately they died trying to find it…
Do you think they would have tried trying to find it unless there was some persistent evidence in history that it existed/?
There is a 1000 years Eddy cycle
http://euanmearns.com/tag/eddy-cycle/
and if we count back 1000 years we find the reason why the Vikings thrived: when they are found to have landed even in Canada and started settlements in Greenland that only now are becoming visible due to the melting of the ice/snow….
Just want to say I love reading the comments as much as I love reading the articles; also thank you to those who add additional info in the comments.
So we are doomed after all.
I told you so.
Mod (or at least someone who passes as one).
There is a certain Andyg55 who inhabits these threads, trolling/flaming anyone who dare go against the dominant denizen opinion
If not Nick Stokes, then it is Griff or, as in this case, Tony McCleod.
Oh, and me of course, as I am in the (overwhelming) minority here as well as the above. Mind I have learned that the only way to survive is to brush off such a this poster in brevity as it will be me that gets “snipped” otherwise.
Here are a few of the person’s so scientific and insightful reposts to Tony – mostly – (on JUST this thread), and per post.
“Again, we not the abject propaganda from McClod.”
“But real data is an enema to you, isn’t it McClod.”
“I see a clueless Clod.”
“Made you realise what a clueless brain-washed twerp you are ?”
“Poor phil.. all we get from him is a single chihuahua yap.
So insignificant.”
“You are still and EMPTY SACK, McClod.”
“Now if only it was intentional comedy, and not just you being McClod the village idiot.”
“What are you ON, this time… which mind-numbing hallucinogenic of choice, McClod.”
“Or remain, as always , an empty sack.”
“Plenty of evidence, you pathetic anti-science non-entity.”
“DENIAL of scientific studies is the ONLY way you can keep your BASELESS CO2-HATRED going, isn’t it McClod.”
Yet what reponse is met to the above by a mod when Tony makes a light hearted response to this trolling? …..
“Gabro says
“Tony,
No they don’t.
And if there were…”
Lol
[??? .mod]”
…………………………
“C’mon mod…
I didn’t rob the bank…
…but if I did…
[What you on about bubba? . . . mod]
……………………………..
Now I’ve aid this before, but if you really what a pure echo-chamber here then this is precisely the way to go about it.
Your “Rules” ( in part ) as stated in your “Policy” section ….
Respect is given to those with manners, those without manners that insult others or begin starting flame wars may find their posts deleted.
Publishing comments in SHOUTING MODE (all caps) is not acceptable.
Trolls, flame-bait, personal attacks, thread-jacking, sockpuppetry, name-calling.
…attempting to dominate a thread by excessive postings may get deleted.
And a perceptive comment at the bottom …..
“The idea of the blog is to learn, discuss, and enjoy the interaction. Please try to keep that in mind when making comments.”
Precisely.
Reply: I’m just waking up and getting a read on this ~ctm
[Snip. Attacks too personal, you’re going to have to stop. Tone it down and discuss or argue calmly. And the last thing I want to hear is he/she/Ze/Zi/They/His majesty, started it first. ~ctm]
The so-called rules are a joke and I have come to realize that if you want to proffer anything here that contradicts the echoing you can expect abuse.
Having said that my feeling is that individuals like our Parrot are just an embarrassment to the more moderate posters and they almost have my sympathy.
I submit he does more harm to his cause than to anyone else’s. So in lieu of any action to prevent the abuse we should just thank him for exposing himself as a crank with nothing to add but peurile shouting who inadvertantly bolsters the arguments in favour of AGW.
Thankyou Parrot and a merry christmas to you.
[Snip. Attacks too personal, you’re going to have to stop. Tone it down and discuss or argue calmly. And the last thing I want to hear is he/she/Ze/Zi/They/His majesty, started it first. ~ctm]
[Snip. Attacks too personal, you’re going to have to stop. Tone it down and discuss or argue calmly. And the last thing I want to hear is he/she/Ze/Zi/They/His majesty, started it first. ~ctm]
[Snip. Attacks too personal, you’re going to have to stop. Tone it down and discuss or argue calmly. And the last thing I want to hear is he/she/Ze/Zi/They/His majesty, started it first. ~ctm]
[Snip. Attacks too personal, you’re going to have to stop. Tone it down and discuss or argue calmly. And the last thing I want to hear is he/she/Ze/Zi/They/His majesty, started it first. ~ctm]
[Snip. Attacks too personal, you’re going to have to stop. Tone it down and discuss or argue calmly. And the last thing I want to hear is he/she/Ze/Zi/They/His majesty, started it first. ~ctm]
[AndyG55 is now on moderation, all comments will need to be approved – Anthony]
Toneb
December 14, 2017 at 2:18 am
What’s your problem with my showing that even hypothetically Tony is wrong?
Thank you for your (lack of) response moderator.
Speaks volumes.
You plainly only enforce your “policy” when perpetrated by the “other side”….
As the childish comeback from the poster being allowed has shown.
(Only two Mods can ban or put them in moderation bin,the rest of the mod team can snip,unapprove or trash comments. I have asked Andy several times to back off on his inappropriate words. One of the mods got tired of it to inform CTM about it. Appreciate your effort to expose it) MOD
Toneb, just got on and saw this. I checked Andy’s posts on this thread and edited a few. Hopefully he will get the message. If not we’ll take other steps.
Thank you DC Cowboy.
And Gabro.
Your definition of “proving wrong” is not mine, and also (mostly) not science’s either.
This is a Blog.
Also if he at least tried to provide “scientific evidence”, rather than do for the vast majority of his posts, what I have posted examples of … then I would indeed have no problem.
It is the double standards that grates. If I or Griff or Tony or Nick were to do a fraction of what this “poster” does then we would be out. And quite right to as it is a plain violation of the stated posting requirements.
I believe you have one poster who (quite naturally) responded to his goading and was banned for a time ….. quite right too as it happens, as it was over the top. However it was the trolling that made him do it.
The freedom extended to this poster (and others not so bad) encourged him to do more – but then to come back to the other party just because he said “lol” begars belief quite frankly.
You will not have intelligent discourse if you only operate in such an evironment, and a pure echo-chamber will be the result. What use is that except to vent anger, and it is apparent that this poster is very angry ….. or a child.
Thanks again for response and I am heartened by it and the allowing of my thoughts on it.
We may differ in thinking on the subject, and the Interrnet does many good things, but can also polarise if allowed.
To much of that in the world just now.
Reply: I’m not around much. I was pointed to this kerfuffle by an email from another mod who was not sure how to handle it. Blog policy. Do not directly insult another commenter in an argument. ~ctm
Yes. I also wanted to say that we are students and teachers to each other,
so this is like a lecture room [in class/ university]
it is a sacred place. Do not make it your toilet.
One can always be polite whilst you make your point?
Toneb,
Hilarious that you presume to lecture me on what is science, when you misquote me, while at the same time showing yourself clueless as to what the process in fact is. Science doesn’t do “proof”. That’s math.
What I said is valid. I showed Tony wrong.
“What I said is valid. I showed Tony wrong.”
Like I said Gabro.
Your idea of “showing” is not mine or indeed science as QED this blog exists to gainsay it.
Sorry, I take experts, especially a consensus, to be vastly more likely to be correct than wrong.
And I said “consensus”, not daft individuals who shot their mouth’s off and got quoted in the sensationalist media, to remain for all time in the anals of contrarian myth.
Is all of it wrong or just the bits you dont agree with? Because this blog makes it out to be ALL wrong….. unless the likes of Leif or Nick intervene, and an odd couple others intervene.
Like when peple used to say to me as a weatherman. “The forecasts are always wrong”. My reply being, “That’s just as mpossble as being always correct”.
And QED as to why denizens here come to get further polarised, whilst a tiny, tiny minority who can be bothered with the antics of certain “posters” make an effort to correct the misconceptions that get carted out in every thread.
So, so many that the echo-chamber applauds. Not least the Sky-dragn Slayers …. also verboten (allegedly), in the “Policy”.
Yes it’s a website my friend, and not science, no matter what you and denizens may think, and comes nowhere near the consciousness of climate scientists. Matters not a jot.
If stuff is wrong it will be found out by others coming along with later papers.
It doesn’t end at peer-review.
Nor is it the “get of jail free” card of a “fraud”.
“Reply: I’m not around much. I was pointed to this kerfuffle by an email from another mod who was not sure how to handle it. Blog policy. Do not directly insult another commenter in an argument. ~ctm”
Thank you.
Indeed as you said blog, policy.
Are you around enough to know that it is only applied to “warmunists”?
The said poster has been at it long enough getting some banned by retaliation to the incessant goading?
There are others – but not so bad.
How about you email mods the “policy” for them to read, learn and inwardly ingest.
Thanks again.
[Your reply is noted. .mod]
[I’ll send an email out later today reminding mods of how we like to see the policy implemented. I apologize again. I’m generally not around much and one always hopes things are going smoothly when unattended. ~ctm]
Toneb
December 14, 2017 at 9:44 am
Again, you display your fundamental lack of understanding of what science is. The consensus is always wrong until, as with the heliocentric theory, it is shown objectively true.
I guess I need to quote Feynman to you: “Science is the belief in the ignorance of experts.” So your misconception of science is 180 degrees off.
You really ought to study science before presuming to comment upon it, particularly to those who practice it daily.
“You really ought to study science before presuming to comment upon it, particularly to those who practice it daily.”
LOL
I worked for the UKMO for 32 years my friend (and not as. TV weatherman).
And such have forgotten more Meteorology than you know.
But, if it makes you feel happy, and I say to the “poster”.
If you say so.
Oh, and Charles.
Your intervention is very much appreciated.
Thanks again.
Well said Toneb.
Mod said: “I have asked Andy several times to back off on his inappropriate words.”
[snip]
Just so I have this clear – my posts are flagged for moderation and this individual is only having his more abusive filth gently snipped, retrospectively?
(His future posts are now going into moderation,no more abuse will show up) MOD
Reply2: You should tone it down as well. ~ctm
After months of open sluice gates, snipping that out is a breathtaking double-standard.
[you’ve got your own set of problems with commenting sir, don’t elevate yourself further – Anthony]
Toneb
December 14, 2017 at 11:46 am
Not surprised in the least, since the UKMO quit practicing science long ago.
Government science is activist bureaucracy, not science. Engineering is another matter, as with the A bomb program and NASA moon shots.
You still haven’t replied to the fact that science is not the consensus of self-styled experts. It’s testing hypotheses by showing them false of confirming them based upon falsifiable predictions.
AndyG55 is now in moderation, all of his comments will require approval.
NOAA and NASA Admit the Sun NOT CO2 is Causing the Arctic Sea Ice to Disappear
NOAA and NASA appear to understand the real cause of the loss of Arctic Sea Ice, incoming solar radiation. The one thing they don’t and can’t do is explain how increasing CO2 can somehow make more visible radiation reach the oceans and surface of the earth. If you can’t explain how CO2 can warm the oceans, you can’t blame CO2. If people want to know the truth about Climate Change and its causes, they simply have to watch NOAA’s videos and NASA’s graphics and take them at their words. Visible radiation is warming our oceans, no more explanation needed. CO2 simply isn’t involved.
https://co2islife.wordpress.com/2017/12/13/noaa-and-nasa-admit-the-sun-not-co2-is-causing-the-arctic-sea-ice-to-disappear/
CO2 IS OK
you are wrong as well. It is not the sun ☀
It is the earth.
What, from Geothermal?
sorry. I don’t know what went wrong there with my paste and copy of a link.
https://wattsupwiththat.com/2017/12/12/noaas-arctic-report-card-released-at-agu17/#comment-2691902
read the above quoted comment with the picture comment below of the movement of the magnetic north pole below.
@CO2
yes,
sort of.
https://wattsupwiththat.com/2017/12/12/noaas-arctic-report-card-released-at-agu17/?replytocom=2692722#respond
co2islife
“NOAA and NASA Admit the Sun NOT CO2 is Causing the Arctic Sea Ice to Disappear”
Except thats not what they said. Thats just what you’ve made up.
Point out anywhere in thr Video CO2 is mentioned.
So how did it get into your headline?
Co2is
From your link…
“NASA’ Goddard’s Institute for Space Studies explains that the warming of the Arctic is due to 5% more solar radiation being absorbed since 2000. CO2 is transparent to the incoming warming visible radiation that warms the earth and oceans. CO2 traps a small amount of outgoing IR between 13 and 18µ, wavelengths that don’t penetrate or warm the oceans.”
I would suggest that the “5%” more solar being absorbed since 2000″ is due to less ice extent …. in turn due to GW of any cause (+ve feed-back).
CO2 “traps” a whole lot of outgoing LWIR, near the Earth’s emission of max lambda – ~15 micron……

Doesn’t don’t penetrate far, but enough to warm the surface mm or so (the ocean surface is not a mirror, so some turbulent mixing). So then we have a surface/air interface that has a smaller deltaT to the warmer waters below. So what happens, as we do know how the 2nd LoT works?
Less heat-flux from lower down to be able to transfer to the atmos.
Reduced cooling and the effect is shown on the steady rise of OHC.
“Doesn’t don’t penetrate far, but enough to warm the surface mm”
WRONG !
LWR causes evaporation. This drags latent heat from the near surface, which actually COOLS the top 1mm or so by about 0.3ºC. (proven by actual measurement)
Atmospheric CO2 acts purely as another conduit for surface cooling, transferring any absorbed energy directly to the remaining 99.96% of the atmosphere, where CONVECTION rules in the lower atmosphere.
There is no empirical evidence that CO2 causes any warming in our convective atmosphere. Has never been measured. It is a figment……… Produce such proof if you think there is.
https://moyhu.blogspot.co.uk/2010/10/can-downwelling-infrared-warm-
https://modis.gsfc.nasa.gov/sci_team/meetings/201105/presentations/plenary/minnett.pdf
http://www.sciencedirect.com/science/article/pii/S0967064510003024

https://wattsupwiththat.com/2014/12/09/arguments-for-and-against-human-induced-ocean-warming/#comment-1817012
But then again … if you say so.
The explaination of both NOAA and NASA has nothing to do with CO2.
Nice graph.. Shows the skin effect is NEGATIVE.
Well done.. 🙂
The WUWT link also shows a net flow of energy FROM the surface upwards.
You are doing very well today 🙂
Toneb you say:
‘CO2 “traps” a whole lot of outgoing LWIR, near the Earth’s emission of max lambda – ~15 micron……’
Are you aware that this is a minute amount of energy relating to a temperature of -88C?
Are you also aware that CO2 has major absorption in the 1-2 and 4-5 um region, thus back radiating a considerable amount of incoming sunlight, so much so that we can pick it up and measure this radiation via the moon coming back to earth? So, how much cooling does the CO2 cause?
Did you already check the temperature trend in your own back yard? You might get a surprise. Just use the results of a weather station nearby you.Here is a summary of my investigation:
Concerned to show that man made warming (AGW ) is correct and indeed happening, I thought that here [in Pretoria, South Africa} I could easily prove that. Namely the logic following from AGW theory is that more CO2 would trap heat on earth, hence we should find minimum temperature (T) rising pushing up the mean T. Here, in the winter months, we hardly have any rain but we have many people burning fossil fuels to keep warm at night. On any particular cold winter’s day that results in the town area being covered with a greyish layer of air, viewable on a high hill outside town in the early morning.

I figured that as the population increased over the past 40 years, the results of my analysis of the data [of a Pretoria weather station] must show minimum T rising, particularly in the winter months. Much to my surprise I found that the opposite was happening: minimum T here was falling, any month….I first thought that somebody must have made a mistake: the extra CO2 was cooling the atmosphere, ‘not warming’ it. As a chemist, that made sense to me as I knew that whilst there were absorptions of CO2 in the area of the spectrum where earth emits, there are also the areas of absorption in the 1-2 um and the 4-5 um range where the sun emits. Not convinced either way by my deliberations and discussions as on a number of websites, I first looked at a number of weather stations around me, to give me an indication of what was happening:
The results puzzled me even more. Somebody [God/Nature] was throwing a ball at me…..The speed of cooling followed a certain pattern, best described by a quadratic function.
I carefully looked at my earth globe and decided on a particular sampling procedure to find out what, if any, the global result would be. Here is my final result on that:
Hence, looking at my final Rsquare on that, I figured out that there is no AGW, at least not measurable.
Arguing with me that 99% of all scientists disagree with me is fruitless. You cannot have an “election” about science. You only need one man to get it right…..
henryp December 14, 2017 at 7:14 pm
Toneb you say:
‘CO2 “traps” a whole lot of outgoing LWIR, near the Earth’s emission of max lambda – ~15 micron……’
Are you aware that this is a minute amount of energy relating to a temperature of -88C?
A temperature of -88ºC has nothing to do with it. CO2 absorbs approximately 10% of the outgoing IR emitted by the surface.
And immediately passes the energy to the remaining 99.96% of the atmosphere.
CO2 acts just as another energy conduit to the upper atmosphere, which is controlled by convection.
It does not “trap” energy, or act like a blanket. The atmosphere COOLS the surface, no blanket does that.
There is no empirical evidence that CO2 causes any warming in our convective atmosphere.
The radiant greenhouse effect has not been observed in a real greenhouse, nor in the Earth’s atmosphere, nor anywhere else in the solar system. It is an unproven FANTASY. !!
henryp:
“Did you already check the temperature trend in your own back yard? You might get a surprise. Just use the results of a weather station nearby you.Here is a summary of my investigation:”
FYI:
I spent a sig portion of my career “check(ing) the temperature trend”
In close monitoring of RST’s (road surface) during wintertime re ice formation.
Does that count?
“Arguing with me that 99% of all scientists disagree with me is fruitless. You cannot have an “election” about science. You only need one man to get it right…..”
Yes I know that. It is the classic “Sky-dragon slayer” psychopathy.
And beggars belief.
https://wattsupwiththat.com/2014/12/09/arguments-for-and-against-human-induced-ocean-warming/#comment-1817012
But then again if you say so.
[snip . . . mod]
AndyG55 December 14, 2017 at 6:31 pm
Nice graph.. Shows the skin effect is NEGATIVE.
Well done.. 🙂
The WUWT link also shows a net flow of energy FROM the surface upwards.
And as Willis points out in that post:
“And in both cases, this DWIR leaves the underlying water warmer, despite the fact that the IR is absorbed in the skin layer.”
AndyG55 December 14, 2017 at 9:51 pm
And immediately passes the energy to the remaining 99.96% of the atmosphere.
Instead of allowing it to pass directly to space therefore retaining the energy in the earth’s system.
CO2 acts just as another energy conduit to the upper atmosphere, which is controlled by convection.
It does not “trap” energy, or act like a blanket. The atmosphere COOLS the surface, no blanket does that.
Except for electric blankets they all do that, the blanket is cooler than your skin, therefore it cools your body, however because of its heat transfer coefficient you cool down more slowly than if you were exposed directly to the air.