Arctic shows no sign of returning to reliably frozen region of recent past decades
Despite relatively cool summer temperatures, observations in 2017 continue to indicate that the Arctic environmental system has reached a ‘new normal’, characterized by long-term losses in the extent and thickness of the sea ice cover, the extent and duration of the winter snow cover and the mass of ice in the Greenland Ice Sheet and Arctic glaciers, and warming sea surface and permafrost temperatures.
Highlights
- The average surface air temperature for the year ending September 2017 is the 2nd warmest since 1900; however, cooler spring and summer temperatures contributed to a rebound in snow cover in the Eurasian Arctic, slower summer sea ice loss, and below-average melt extent for the Greenland ice sheet.
- The sea ice cover continues to be relatively young and thin with older, thicker ice comprising only 21% of the ice cover in 2017 compared to 45% in 1985.
- In August 2017, sea surface temperatures in the Barents and Chukchi seas were up to 4° C warmer than average, contributing to a delay in the autumn freeze-up in these regions.
- Pronounced increases in ocean primary productivity, at the base of the marine food web, were observed in the Barents and Eurasian Arctic seas from 2003 to 2017.
- Arctic tundra is experiencing increased greenness and record permafrost warming.
- Pervasive changes in the environment are influencing resource management protocols, including those established for fisheries and wildfires.
- The unprecedented rate and global reach of Arctic change disproportionally affect the people of northern communities, further pressing the need to prepare for and adapt to the new Arctic.
Video:
There are several sections of the report, for temperature, sea ice, etc. You can access each section here: http://www.arctic.noaa.gov/Report-Card/Report-Card-2017
One graph in the sea ice section caught my eye:

The September rate of loss is about 4 times higher than the March rate of loss. This suggests to me that something I’ve long mentioned – albedo changes which primarily manifest themselves in the summer when there is more incoming solar radiation might be a big part of the issue. Carbon soot, specifically.
This is supported by something I covered at AGU14: satellites detect albedo change in the Arctic, resulting in more absorbed solar radiation
From that study:
Since the year 2000, the rate of absorbed solar radiation in the Arctic in June, July and August has increased by five percent, said Norman Loeb, of NASA’s Langley Research Center, Hampton, Virginia. The measurement is made by NASA’s Clouds and the Earth’s Radiant Energy System (CERES) instruments, which fly on multiple satellites.
![sea_ice_fraction_change_and_absorbed_solar_radiation_change[1]](https://wattsupwiththat.files.wordpress.com/2014/12/sea_ice_fraction_change_and_absorbed_solar_radiation_change1.png)
The Arctic Ocean is absorbing more of the sun’s energy in recent years as white, reflective sea ice melts and darker ocean waters are exposed. The increased darker surface area during the Arctic summer is responsible for a 5 percent increase in absorbed solar radiation since 2000. Image Credit: NASA Goddard’s Scientific Visualization Studio/Lori Perkins
While a five percent increase may not seem like much, consider that the rate globally has remained essentially flat during that same time. No other region on Earth shows a trend of potential long-term change.
start at 1979, when sea ice was at an EXTREME HIGH.
Either they are WILFULLY IGNORANT of the fact that for most of the Holocene, sea ice levels have been MUCH lower than now,
…, or they are DELIBERATELY LYING to push the AGW socialist global Agenda.
Those options are not mutually exclusive.
True. about 97% of each. !
Their claims are lies and their graphs are deception. There is no need to lead eye by slapping a straight line fit on top of the data. There is no reason to even propose a line model for the data. Just show the data and let the viewer LOOK AT IT.
The straight line is there to mask the fact that the last decade has been essentially going nowhere. This blows clear out of the water the idea of Arctic sea ice being dominated by a positive feedback and being in a “death spiral”.
The Death Spiral is Dead
https://climategrog.wordpress.com/2016/09/17/the-death-spiral-is-dead/
Yes, but now it is lower than it was at the low point in the 1940s…
And historic sea ice lows in the past (e.g. Eemian) were under quite different conditions which do not apply today – yet we still see year on year decline in extent (including winter extent), mass, thickness…
No way of knowing what sea ice levels were in the 40s. So don’t make such a dishonest statement Griff.
2nd world war records are absent, and all other records around that period are manual and/or anecdotal, and very patchy – assuming areas with no records had ice or you can extrapolate – as per the fake record of extent back to 1850 that has been concocted, is also dishonest. But nothing you wouldn’t expect from bad/dishonest ‘climate scientism’. As for rate of change – vast areas of the Arctic can shift climate ‘overnight’ naturally. And both post 1919 and 1979 – this happened suddenly after very cold/high ice years.
The Eemian was around 120, 000 year ago (snip). !!
Current extent is above what it has been for 90-95% of the current interglacial.
During the first 7000-8000 years the extent was often “summer ice free”
The extent has been level for the last 10 years…
(snip)
Andy, personal insults like this are unacceptable. Stick to reasonable discussion – Mod
Hello Grif
anybody home ? hello ( echo ) hello, Griff,
please answer AndyG55
“Yes, but now it is lower than it was at the low point in the 1940s…”
Gee, I didn’t know we had satellites in the 1940s
Not. Arctic Sea Ice Volume Up 15% Over The Past Decade:
Typical Griff, when data is absent, just make it up.
All we have prior to the satellite era is a handful of ships logs.
Not enough to say anything regarding the state of the entire arctic. Not that reality ever bothered you.
Griff, where is your “year on year decline” ?
There is considerable year to year variabilty in both directions so that claim in a non starter.
2016 and 2017 were indistinguishable from ice extent in 2007. That is a decade of NO cumulative change in either direction. No decline on a decadal timescale.
Especially when one just plays around with near Arctic temperature records that might shine a light on what is going on in that region …
https://notalotofpeopleknowthat.wordpress.com/2017/12/09/noaa-still-falsifying-icelandic-climate-history/
+1000
But you forgot the extropolating over 1200km.
the ice will come and the ice will go. we will also wax and wane. we will however never control that which makes the climate and environment function. It is fun to speculate and have interesting things to talk about.
Calling recent changes “unprecedented” is clearly lying, deliberate deception. If they mean without precedent in the last 37 years of the current 8000 interglacial they should say so.
This ‘new normal’ is tacit recognition that Arctic ice is now indistinguishable from where it was ten or eleven years ago, they just try to spin it the same catastrophe they have been wailing about despite the fact the ice loss has ended.
Nice to see such great minds finally realise what I pointed out some time ago: The Death Spiral is Dead
https://climategrog.wordpress.com/2016/09/17/the-death-spiral-is-dead/
The large summer sea ice losses – unexpected so soon by the experts back in 2005 – and the lack of equally large declines in polar bear numbers as predicted, is the point of my 2017 polar bear paper that the Polar Bear Specialist Group members are so afraid the public will notice.
Crockford, S.J. 2017. Testing the hypothesis that routine sea ice coverage of 3-5 mkm2 results in a greater than 30% decline in population size of polar bears (Ursus maritimus). PeerJ Preprints 2 March 2017. Doi: 10.7287/peerj.preprints.2737v3 Open access. https://doi.org/10.7287/peerj.preprints.2737v3
Hence, in my opinion, the Bioscience attack paper published November 29 this year https://polarbearscience.com/2017/11/29/polar-bears-refused-to-die-as-predicted-and-this-is-how-the-propheseers-respond/
Hi Susan, You are doing great work.. don’t let “them” get to you. 🙂
I STILL can’t get one single one of the polar bear bed-wetters to explain how the polar bears survived the first 7000 – 8000 years of the Holocene, when sea ice levels were MUCH LESS than they currently are.
I fully agree. The only answer I’ve ever heard to an early Holocene ice free arctic is that it’s never happened because it isn’t possible that it happened, never mind the inconvenient evidence to the contrary.
This is kind of a kick-in-the-gut for me because I have profound respect for Ian Stirling. Oh well, even Einstein got things wrong. link
Susan: Illegitimi non carborundum!
This is the most important part they are ignoring. It seems they had not looked at the GISP curves of temperature.
AndyG55 – December 12, 2017 at 4:39 pm
I’m pretty sure that Griffy is fully qualified to explain that to you, ….. and iffen he does, …. I am sure he will attest to his actual, factual knowledge that the Polar Bears have evolved with an “inherited survival trait” that is the same as that which the Ptarmigans and Arctic Foxes possess.
Griff is likely to claim that at the “start” of the extremely warm 7000 – 8000 years of the Holocene “Climate Optimum”, …… when all the Arctic ice and snow began melting away, ….. all Polar Bears began shedding their “white” wintertime fur and replaced it with “brown” fur like that of the Grizzly Bear.
And when the “Climate Optimum” ended, some 4000 years ago, the Polar Bears switched back to their “white” fur. Like the “seasonal” switch by the Arctic Fox, to wit:
http://www.factzoo.com/sites/all/img/mammals/arctic-fox-summer-coat.jpg
Picture caption: “As winter approaches, the arctic fox’s brown fur gradually changes into a thick, white coat.”
Yours truly, …… Eritas Rabuf
And ps ….. for all you doubters, to wit:
Hi Susan – Thanks for your PB articles. You may wish to note that the UK’s BBC today put out an article highlighted on their front page as Was starving polar bear ‘face of climate change’ – or clever PR?. In the article (http://www.bbc.com/news/world-us-canada-42322346), at least they did acknowledge that there was a clever PR argument, but they studiously avoided presenting any information to support it.
I guess the ability of Joe Public to double check and find a more rational and reasonable explanation is starting to hit home in the MSM. Times they are a changing.
Polar Bears were immortal in 1979. Never got sick, never starved to death, never died of old age.
“the UK’s BBC today put out an article”..
Trump has turned the whole “fake news” thing into a game…..now people all over the world and looking and trying to find all the fake news they can…and it’s backfiring on the media big time
This absolutely captures the attitude of the BBC – not just on climate change, but any cause célèbre
of the morally pompous, disconnected ‘progressive’ bourgeois: they equate lying to the public to ‘clever PR’. I’m looking forward to disconnecting my TV next year and avoiding the license fee..
Bill,
That’s right. The polar bears of 1979 were the same ones which survived the ice-free Eemian Interglacial and Holocene Climatic Optimum. But then they started dying like flies, because man-made CO2.
I noted the bullet point:
The apex of any food chain can hardly do anything but better when the base gets more productive. (Technically, polar bears are just below the apex, which is of course Homo Sapiens – but we’ve abdicated that position, at least in the Arctic.)
Yep, the opening up of the Arctic would have been a godsend to all life up in that region.
Humans especially would have benefitted, with travel, commerce, fishing etc all becoming possible for more than a fraction of the year.
Unfortunately, it looks like the recovery from the extremes of the late 1970s is over, and the re-freeze will gradually start to take place.
I caught that, too.
In adopting a bit from Willis, it’s ‘angrifying’ indeed to continually witness misuse of capitals: across species, genus is always upper case and species strictly lower.
https://www.grammarbook.com/punctuation/capital.asp
And I KNOW that! Dag nab it!
@Writing
I don’t know that I’d agree we were ever the apex predator in the Arctic. If’n that polar bear wants the seal you just landed, you’d better be right handy with that ’30-06. If’n you don’t have a ’30-06 or similar hardware with you, you’d better hope your cardiovascular system is in real good shape and the bear would rather chow down on the seal than chase his entree.
Actually, there are places in Canada when travel is easier in the winter. The Hudson Bay Lowlands are a boggy mess and impossible to travel in the summer. In the winter you just hop on your snowmobile and head over to the next town a hundred miles away.
“Ice Road Truckers” – loved the early seasons of that show.
D. J. Hawkins
December 12, 2017 at 8:34 pm
Canadian Rangers are turning in their antique .303 Lee-Enfields for a locally produced .308 version of the Tikka T-3. With a good hunting bullet, they should be barely adequate for anti-polar bear applications.
Apparently the modelers now attacking Dr. Crockford didn’t understand the environment they were modeling.
@ur momisugly commiebob.
We are talking about sea ice…….. how does that make ground boggy ?
The field studies tend to be published some time after the observations and populations are not all covered….
Yet there is clear evidence of impacts around the Beaufort Sea, Svalbard and Hudson Bay (also Wrangel and Baffin Islands)
I continue to be puzzled at your partial recounting of evidence gathered by others
You are continually puzzled about EVERYTHING , griff.
You live in a FANTASY world of ANTI-KNOWLEDGE.
Griff – you are aware that polar bears are not immortal and grow old, or get disease, or are out-hunted and die? See http://necsi.edu/projects/evolution/co-evolution/pred-prey/co-evolution_predator.html on predator prey relationships. It is not clever to find a dying predator and claim the reason must be warming, and it demonstrates gullibility and confirmation bias to believe a picture like that shows an effect of warming. Starving predators is what will be seen whenever their numbers rise above the level of their prey required for their food.
Yeah, that reminds me, have you apologised to Dr Susan Crockford yet, or aren’t you man enough to admit you were wrong.
Griff,
What you keep failing to realize is that polar bear population has increased dramatically since 1979, not fallen. More importantly, you keep not getting that there is no reason to imagine that their numbers should be hurt by lower summer sea ice. They don’t need summer drift ice to survive and thrive. The only sea ice which matters to them is landfast ice in the early spring, on which females raise their pups in snow lairs over holes in the ice..
Their main prey item, ringed seals, are also thriving.
“What you keep failing to realize is that polar bear population has increased dramatically since 1979, not fallen”
Polar Bears obviously struggle to survive when there is TOO MUCH sea ice 😉
“The sea ice cover continues to be relatively young and thin with older, thicker ice comprising only 21% of the ice cover in 2017 compared to 45% in 1985.”
Give it at least 15-20 years of cooling to thicken the ice up. It didn’t all melt or thin up at once, and it will take a few decades of further cooling to cycle back to where it was in 1985. But the trend is back to more ice extent, as well as more multi year ice.
Check out the time-lapse satellite imagery from late 1984 through 2016 (from about 1:18 through 1:35 of the video). It clearly shows multiyear ice getting pushed into the Greenland sea (between Greenland and Svalbard) by cyclical (annual) storm activity. The multiyear ice is not melting. It’s just getting pushed out of the Arctic by annual storms.
Louis
Wise words.
The pressure cycle influencing Arctic summer sea ice is now on the decline. While there will be variances 2012 was the summer low point and unlikely to be beaten. Winter maximums will be variable in the short term.
The ozone hole will also continue to reduce in both area and minimum ozone values, on average.
Regards
“Arctic shows no sign of returning to reliably frozen region “
Nor should it.
To get back to that stage would mean the world dropping back into Little Ice Age conditions.
Only the most ignorant of agenda driven fools would want that.
That is a great point, Andy. The Earth is warmer now than it was 150-200 years ago – don’t believe that is debatable.
All things considered, if the Earth remained at it’s current temperature, with minimal fluctuations for the next 100 years, one might expect that we’d continue to see a gradual downward trend in the Arctic sea ice extent – and thickness; same for the size and volumn of other ice sheets and glaciers the world over. Naturally, there’d be some diversity here and there – as there is now; but with the oceans driving normal cycles of decadal weather pattern changes. (Note – one could also continue to shrill for the next 100 years that, ‘this past year was as warm as the past 10, 20, 50, 100 years on record – proof of man-made global warming.’ LOL).
Conversely, had the Earth remained locked at the temperature it was at during the cold bottom of the Little Ice Age, one could have expected a general trend of the exact opposite.
Over time it will get colder. Everything gets colder in the long term. Any other outcome is impossible.
That’s right. It should not.
“Reliably frozen region”
What are they talking about? – I wonder how they define a reliably frozen region.
Looks like a term selected to create feelings. And it seems to be quite successful in doing that:
https://twitter.com/EricHolthaus/status/940632347929661440
“I’m not sure how many more years or months I’m going to be able to work “
Is his climate trough drying up? , here’s hoping !!
Or maybe he is running out of dry bed sheets !!
Sheeseh! I wonder what he would do if we really had any climate change over the past 100 years.
Indeed shouldn’t NASA at the lease acknowledge that as we move away from the last LIA and the world slowly and naturally warm-up again the Arctic ice cap should quite naturally shrink.
Oops typo (again)
Not —
“Indeed shouldn’t NASA at the lease…”
But —
Indeed shouldn’t NASA at the least…
How can the “global reach” of something “disproportionately affect” a local group of people?
That is simply nonsense, no matter what you are talking about.
There are arctic ice estimates from before 1978 and the current series of satellites. The real issue is that the current situation might be an artifact of measurement, with good data starting at a high ice year.
There are now quite a number of papers out there showing that the LIA and the late 1970’s was the ANOMALY.. a period of EXTREME sea ice extent.
Current level is still in the top 10% for the current interglacial.

The present was 67 years ago.
AndyG55,
What do the solid line and the dashed line represent.
I have and idea but just for clarity …?
Or do I have to find Stein et al to confirm what I think?
Tom, those lines are based on two Bio marker.proxies Here is the link for you”
New Paper Indicates There Is More Arctic Sea Ice Now Than For Nearly All Of The Last 10,000 Years
“….The biomarker proxy records show (i) minimum sea ice extent during the Early Holocene, (ii) a prominent Mid-Holocene short-term high-amplitude variability in sea ice, primary production and Pacific-Water inflow, and (iii) significantly increased sea ice extent during the last ca. 4.5k cal a BP…..”
http://notrickszone.com/2017/03/02/new-paper-indicates-there-is-more-arctic-sea-ice-now-than-for-nearly-all-of-the-last-10000-years/#sthash.DPI0kyna.dpbs
@Sunsettommy
Thanks for clearing that up.
Thanks ST, its summer down here, beach is nice.. 🙂
Sorry I missed your post , Tom0
No probs Andy
AndyG55 December 12, 2017 at 4:44 pm
There are now quite a number of papers out there showing that the LIA and the late 1970’s was the ANOMALY.. a period of EXTREME sea ice extent.
Current level is still in the top 10% for the current interglacial.
That data certainly isn’t ‘current’, it’s from 1A and 1B which judging by their map is well inside the seasonal band, nowhere near perennial.
http://onlinelibrary.wiley.com/store/10.1002/jqs.2929/asset/image_n/jqs2929-fig-0003.png?v=1&t=jb85rtag&s=41bb99b15384e9e27354e7df379559f419e05c57
Is there any way of detecting higher levels of carbon soot (etc) on the ice, other than by taking its temperature?
Measuring reflectivity changes over time, for starters.
Mike Jonas
Yes, mid-summer and early spring arctic sea ice albedoes are consistently lower today at 0.42 to 0.54 from what the Soviets recorded back in their ice island research papers of 1950-1970, and the 1970-1980 European and Canadian and American polar expeditions. I use J Curry’s 1998 daily SHEBA measurements of sea ice albedoes for my day-by-day heat exchange calc’s – Her lab was on a Canadian icebreaker floating in the sea ice between latitudes 74 north to 79 north from late March to early October. She shows a recent minimum of 0.42 in late July, with one day’s readings as low as 0.38
Very, very different from the earlier 0.65 and 0.70 average monthly albedoes in mid-summer.
I find these figures a little odd. Given that albedo is a dimensionless number scale ranging from a black body at zero to a perfect mirror at 1, I would expect to see a marked visual difference in an albedo shift of effectively one third of the total scale range. Is such an obvious change observed?
So much light is reflected by the ice in the arctic in summer that the difference is probably not very apparent to the naked eye. There is always “enough light” or “too much light”. Ever hear of snow blindness?
AMO. Enough said.
Yup, I notice they didn’t mention the AMO was the highest on record for November.
Hum
No it is not, there is more.
How does CO2 warm the oceans? They clearly identify warm water as the cause, so how does CO2 warm the oceans?
Obviously you did not get the memo that in spring CO2 starts to increase and in fall CO2 starts to decrease. This of course is the cause of oceans warming in spring and summer and cooling in fall and winter.
LOL, I thought the seasons were due to the orbit and tilt of the earth relative to the sun. Silly me, CO2 causes the seasons.
But no evidence that these changes are related to global warming.
https://ssrn.com/abstract=2869646
As far as I can see , Arctic sea ice is behaving pretty much exactly as you would expect if its main over-riding influence was the AMO.
Its been level for the last 10 years according to MASIE so the recovery from the extreme high of the late 1970s has most probably stopped.

AMO is starting to turn down.
Interestingly, you can see the affect of the AMO even during the LIA, as shown here on the Icelandic sea ice index.

It is going to be HILARIOUS watching the antics of the Arctic sea ice bed-wetters as the extent starts to climb over the next few years. 🙂
HILARIOUS, not.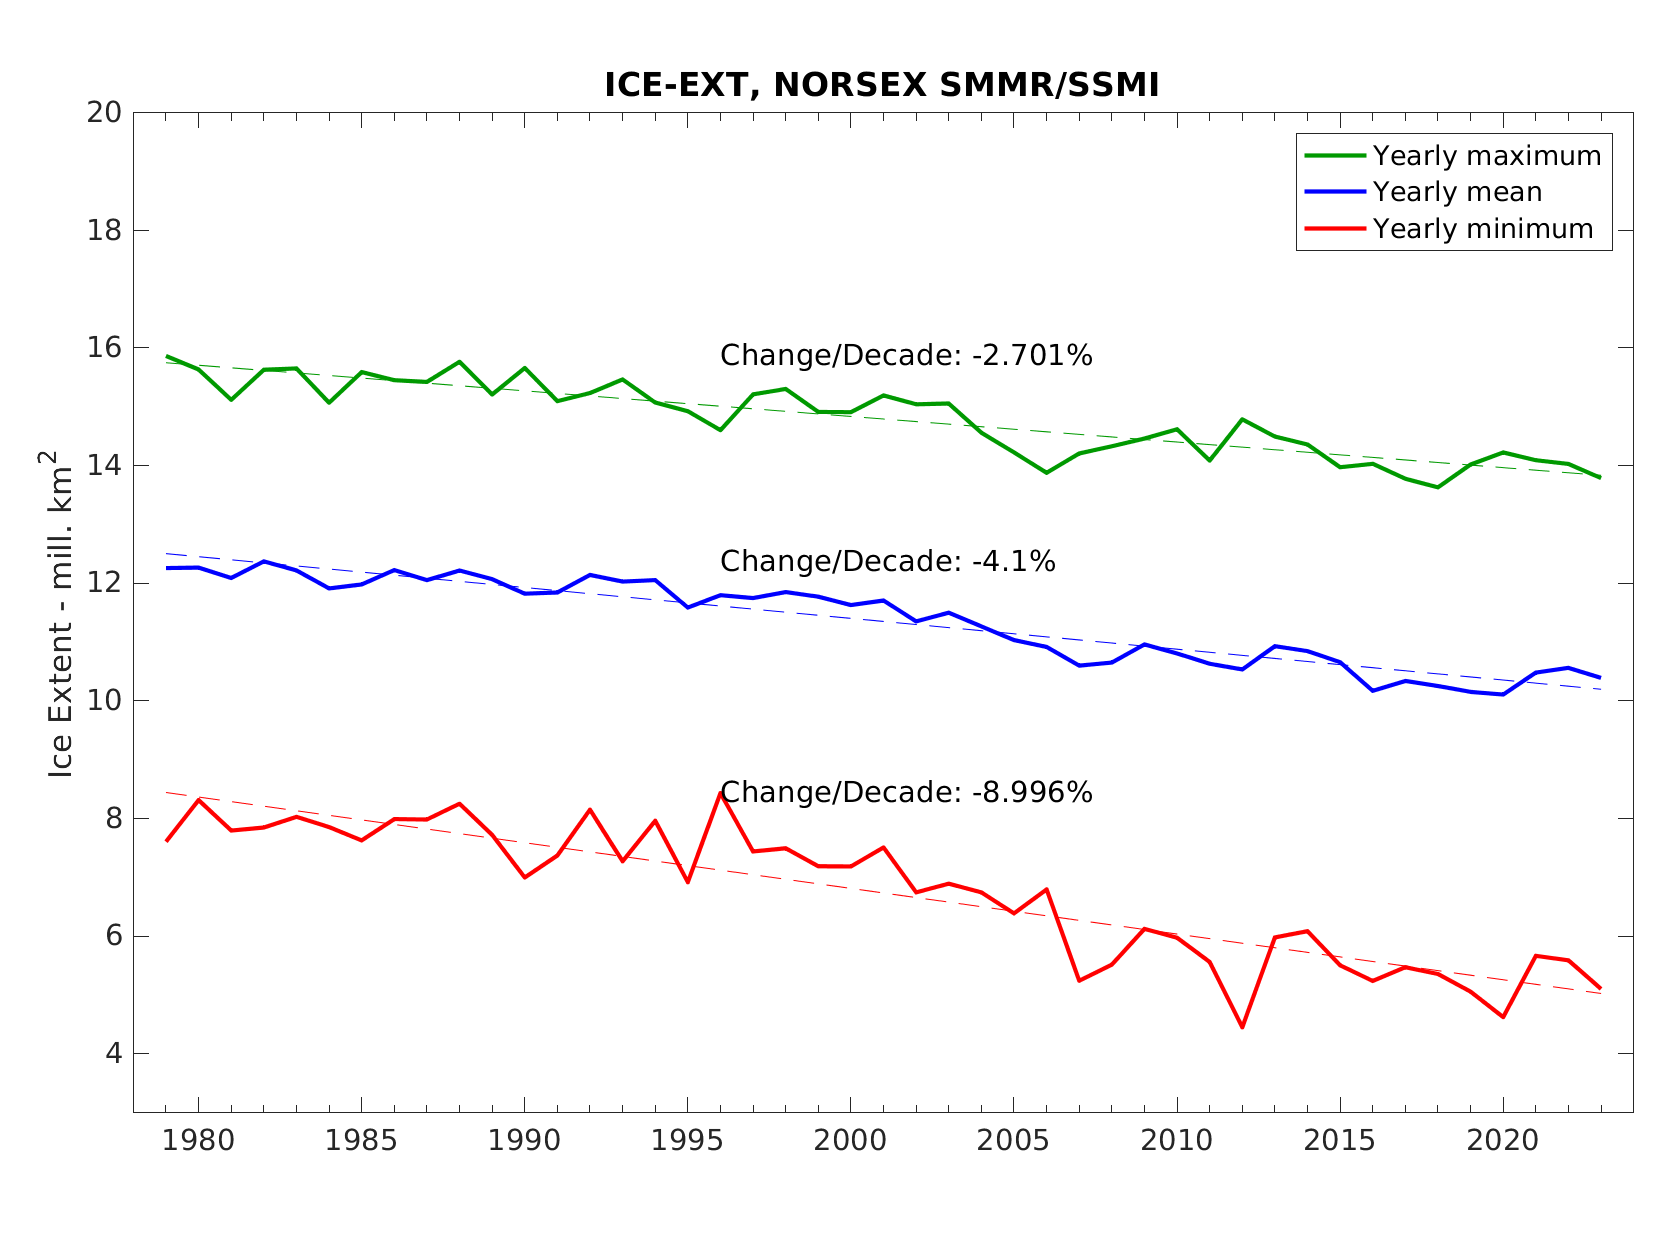
Tony, as usual YOU are ignoring the main point made here,which is that the last TEN years, it has been nearly flat as your own chart shows clearly for the summer minimum.
It is no longer going down anymore for the summer minimum,which is no big deal for Polar Bears anyway.
“tony mcleod December 12, 2017 at 5:46 pm”
What data are used to create those graphs?
It was “clearly” flat between 79 and 88 and went up from 90 to 96., etc. So?
I’m ignoring the so-called “main point” for a good reason: the overall trend is “clearly” down. As it is with concentration and volume. Look at the mean – if anything the loss is accelerrating. Look at the latest – all three below trend. Sorry but “clearly flat” is rubbish…and it’s now warmer.
But who cares if its warmer anyway?
From Stein et al,. 2017:
The increase in sea ice extent during the late Holocene seems to be…coinciding with the decrease in solar radiation.
It’s still decreasing…so, um…never mind.
“tony mcleod December 12, 2017 at 9:23 pm”
I guess in response to my question. I click on the link, I just see a bigger graph. No source data.No links to source data. I have only your word in that post. Credibility shrinking even more Tony.
“The increase in sea ice extent during the late Holocene seems to be…coinciding with the decrease in solar radiation.”
You really have ZERO CLUE what that statements means
Yes, there was a decrease in solar activity during the Neoglaciation, leading to the Little Ice Age,
Since then, and particularly during the latter half of last century, there was a Grand solar maximum, with the highest solar activity in many hundreds of years.
You really need to get passed your kindergarten understanding of things, (snip)
Real data shows that the average Arctic sea ice has been basically ZERO TREND for the last 10 years,
(snip) again- stick to reasonable discussion and stop the insults – Mod

“Look at the latest – all three below trend. Sorry but “clearly flat” is rubbish…and it’s now warmer.”
Actually the graphs, especially the red one, clearly demonstrate a poor fit to a simple linear regression. The points are generally below the line at the start of the series, and at the end, and above in the central section. This suggests that a curved fit would be better than a line. The curve would then probably show a leveling off and potential upswing at the end would be a better fit than a curve with an accelerating decline – but I can’t be sure until I’ve looked at the data – this assuming random normal errors etc.. There is software available to look at this free if you are interested.
You describe yourself and your actions extremely well, McClode.
Internet bully shouting with all caps is not a surprise. Not that toddler/adolescent temper tantrums ever work.
Why does McClode use a graph that cuts off data halfway through 2015?
It appears there is purpose to graphs that ignore 2017’s very definite Arctic reversal with an early freeze-up and rapid ice gain.
I checked Nansen’s data and they have Sea ice Area and Extent records right through to December 2017.
Yet, that graph fails to recognize or illustrate recent ice growth; allowing drama queen trollops, like McClode, it’s fallacious claims.
Nor is Nansen’s data all that clean with frequent way out of cycle outliers.
What do that graph’s owners do with single days that show 42% sea ice extent loss overnight with a 171% sea ice extent growth the following day; e.g. February 18th, 2006.
Or missing data?
Oddly, those missing days are generally right at peak ice season; e.g. 2012 is missing 9 straight days of peak ice extent.
How do monthly, seasonal, annual averages work when substantial portions of maximum ice extent are missing?
They don’t.
But then, McClode never demonstrates that it reads the links it provides; with the majority of legitimate McClode links proving the opposite of McClode claims.
Extremely pitiful and disappointing doom-monger groupies like McClode, pretend to swoon while falsely claiming nature suffers from CO2.
Yet, you overlook or flat ignore Arctic and Antarctic ice trends utter failure to demonstrate any relation to CO2 emissions or atmospheric levels.
In this thread, McClode appears to not have bothered to read the article or questioned NOAA’s party line activism.
The question framed in this article asks why Arctic’s sea ice extent has dropped. Especially since temperatures do not support ice melt theory.
One major question and a very likely culprit is reduced Arctic albedo with known soot deposits.
Another major point by Louis Hooffstetter describes the simple physical function where winds, storms and currents are pushing ice out of the Arctic.
What part of McClode’s CO2 doom theory accounts for ice physically moved to warmer seas?
That claim is bound to be Keystone Kops amusing. Right up there with NOAA’s unscientific activist Arctic ice screed.
Over the last 35 years or so (based on your graph), summer sea ice is down by about 1/3 while average extent is down by 15% and maximum extent down by 10%. If you look at the temperature profile in the arctic over the course of the year, it is clear that there will likely always be winter ice cover for the foreseeable future. Why the panic, especially when it is clear we have increased arctic productivity and increased numbers of polar bears. And given that there are observed irregular ~60 year cycles in ice, hurricanes, the AMO, etc., one needs to look at >30 years to see if things are an actual new trend are just part of the next cycle. The AMO for example has 1/2 cycles that range from 25 to 45 years.
“In August 2017, sea surface temperatures in the Barents and Chukchi seas were up to 4° C warmer than average, contributing to a delay in the autumn freeze-up in these regions.”…..
..and not one word about all the other areas that were colder
” thicker ice comprising only 21% of the ice cover in 2017″….
which is a major improvement over the past few years….
“slower summer sea ice loss”…..
and guess what that left over ice is going to be next year?……more thicker multiyear ice
t minus 4 more months and counting….
A “new normal”… newer than the last new normal, which was newer than the last new normal, etc. Another new normal soon. No end of short term “new normals” in a longer term cycle.
“Arctic tundra is experiencing increased greenness and record permafrost warming.”
How are they measuring “increased greenness”? That seems subjective, but maybe there is a paper on it somewhere.
Tucker
That “increased greenness” (darker, more absorptive surface sticker further out of the snow with longer branches and more limbs) is caused by today’s increased CO2 levels in the arctic, and thus more energy absorbed and warmer arctic temperatures around the arctic ocean sea ice.
But the moss in today’s longer, heavier, thicker, polar bear furs is also greener than before. 8<(
Tucker December 12, 2017 at 5:14 pm
“Arctic tundra is experiencing increased greenness and record permafrost warming.”
How are they measuring “increased greenness”? That seems subjective, but maybe there is a paper on it somewhere.
Try here: http://spie.org/newsroom/4725-remote-sensing-of-terrestrial-chlorophyll-fluorescence-from-space?SSO=1
“The Arctic Ocean is absorbing more of the sun’s energy in recent years as white, reflective sea ice melts and darker ocean waters are exposed.”
Incoming solar radiation isn’t part of the GHG Effect. Their own explanation rules out CO2 unless you can explain how more CO2 allows more visible radiation to reach the oceans.
co2islife
“The Arctic Ocean is absorbing more of the sun’s energy in recent years as white, reflective sea ice melts and darker ocean waters are exposed.”
Thats the albedo effect, not the GH effect. Two distinct phenomena.
tony mcleod, co2islife
However, at the southern edge of the arctic ice cap, the summer sun is only able to warm those newly-exposed Arctic ocean waters 4 months of the year. The rest of the time, less sea ice = greater heat loss from the open waters = a net cooling effect over the entire year if the ice area is less than its “established” averages.
McClod, you really should learn at least the very basics before you comment.
Actually try to comprehend what is being said, for once.
It will stop you from continuing to make a monumental fool of yourself.
I see your lower ice insulation and raise you a higher humidity.
I see a clueless Clod.
ParrotG55, I don’t know who you are or where you come from, but you’ve done me a power of good.
AndyG55 December 13, 2017 at 2:10 am
I see a clueless Clod.
Looking in the mirror again!
Yep, that is my point. CO2 has nothing to do with it. Warm water melts the ice, the ice no longer reflects the heating visible radiation, etc etc. It all has to do with warming water, something CO2 doesn’t do.
“but you’ve done me a power of good.”
Made you realise what a clueless brain-washed twerp you are ?
Once you realise your inherent ignorance, maybe you can start working to fix it…..
…. although I see very little progress so far. 1 step forward.. 3 steps back.
Poor phil.. all we get from him is a single chihuahua yap.
So insignificant.
Cue the tundra methane boogeyman.
How else do you explain the PETM?
OMG!! I’m still laughing!! Thanks for gut-buster laugh Tony.
But okay I’ll give it a stab.
55-56 Mya… really?? uncertainty abounds. Maybe a sustained volcanic event through shallow water coal beds. Maybe those newly evolved land mammals liked their big SUVs running on extinct dino-juice? Who knows?
“Gut-buster”? Soz, I’l try and tone down my comedy a bit for ya.
No, no I think it’ll be good. It’ll be so much warmer in uninhabitated cold places – so just good all round.
I’ve been eyeing some beach front property up on Baffin Island. Whatata think Tony? Should get it and build a liitle tropical style bungalow there?
Certainly, that amount of temperature change would have caused the release of a lot of CO2, CH4 from oceans etc
Only if you believe the unproven myth of the CO2 warming effect are you stupid enough to believe CO2, CH4 actually caused it.
STILL waiting for a paper proving empirically that CO2 causes warming of our convectively controlled atmosphere.
You are still and EMPTY SACK, McClod.
Its almost certain that whatever caused the CO2, CH4 release, ALSO caused the warming event.
“I’l try and tone down my comedy a bit for ya”
Now if only it was intentional comedy, and not just you being McClod the village idiot.
Tony,
Methane is the least likely of at least seven possible explanations, not all mutually exclusive.
And the PETM occurred when earth was already much hotter than now, and on track to get more so after the spike.
True Gabro but they all involve at least 1 maybe 2 pulses of carbon.
Tony,
No they don’t.
And if there were carbon pulses, the resolution is such so as not to be able to distinguish cause and effect. A hot flash would naturally release more carbon dioxide from the ocean.
In at least two of the best supported hypotheses, carbon is an effect, not a cause, ie ocean circulation changes and orbital mechanics.
IMO oceanic circulation explains Paleocene and Eocene warmth quite well.
The Arctic Ocean was practically landlocked and much less salty than now.
 ?height=420&width=309
During the Paleocene, a land bridge connected North and South America, as now, but South America was still at least tenuously connected to Antarctica. The Tethys Sea ran from the then narrow Atlantic to the Pacific, between Europe and Asia on one side and Africa and the northward-drifting Indian Plate on the other.
http://www.scotese.com/images/E060_zonef.jpg
http://www.scotese.com/images/D050_zonef.jpg
“How else do you explain the PETM?”
Let me see… I can remember the following serious hypotheses:
1. Impact of a volatile-eich comet
2. Large-scale Peat Fires
3. Oxidation of shallow water sediments upraised above sea level by the opening of the North Atlantic
4. Liberation of Methane from deep-sea clathrates
5. Large scale ocean overturning
6. Contact metamorphism of organic deposits during the opening of the North Atlantic
7. Large scale melting of permafrost in inland Antarctica.
I gather that you believe in #7. All of them have problems, but #7 at least has the good point is very difficult to disprove, since access to paleocene deposits in inland Antarctica is nonexistant.
Thanks, tty. The level of hubris implied in mcleod’s “question” is astonishing.
There was quite a bit of carbon in the air and a peak at around 55 million years ago, I didn’t think that was contraversial as a contributor to the reportred up to 8 degrees of warming.
Gabro says
“Tony,
No they don’t.
And if there were…”
Lol
[??? .mod]
C’mon mod…
I didn’t rob the bank…
…but if I did…
[What you on about bubba? . . . mod]
“What you on about bubba?”
Wrong question, mod…..you should have asked,
“What are you ON, this time….
….. which mind-numbing hallucinogenic of choice, McClod.”
Greenland stays cool within the Arctic heat.
https://www.dmi.dk/en/groenland/maalinger/greenland-ice-sheet-surface-mass-budget/
How on earth can we compare ice extent to historical records? it is obvious that with today’s technology that measurements are going to be rather bias, instruments are advanced to such a degree that a slight deviation would show as a massive change, hand written evidence prior to Satellites where hand eye coordination and susceptible to “mistakes” come on guys sensors vs thermometers not a good race is it.
moan over. next.
Has anyone actually realised that ice caps move with the magnetic poles! drifting around the Arctic and Antarctic regions since time began, obviously where ice forms in one decade may have “shifted” in the next decade.
We “Earth” have reached the pinnacle in TSI (total solar irradiance) as of solar cycle 23, we are now in the declining phase of solar activity, we only have to look at previous sun spot history to see that every 206 yrs we slip into a Grand minima, solar cycle 24 was the lowest sun spot activity cycle since cycle 14, NASA changed their graph projections 4 times before reaching a final, prior to this we had the Dalton cycles 5/6 and prior to that the Maunder of 1645-1745.
Now i am not saying climate change isn’t real, i am saying that yes indeed we did go through a ” warm phase” but we have been here before Medieval, Roman just to mention a few, are we now supposed to ignore proxy data sets, ice cores, tree rings, ocean sediments, stalagmites.
Do we not see the correlation between sun/earth climate forcing? low solar activity= more Cosmic rays in turn resulting in cloud nucleation summer rain increases winter snowfall increases, i am leaving it here for now as this ridiculous and totally unfounded idea that a trace gas (CO2) is causing the “Temperature” anomaly is starting to annoy me.
Please read this on CO2.
http://greenhouse.geologist-1011.net/
David, I totally agree. The recent ( in historic terms) slightly increased winter and night time temperatures and slightly lower summer temperatures is caused by variations in cloud cover and the type of cloud cover, which in turn is caused by variations in cosmic rays. The Physics is very clear, radiance does not heat real greenhouses, convection does. The earth has no ‘glass roof’. Radiance in the atmosphere is a net zero effect.
The rest of the CAGW stuff is numerology, with invented inputs and outputs into ‘models’ that some people worship , presumably because they otherwise have empty lives.
This whole AGW BS story will some day be looked back upon as the Dark Ages of scientific inquiry, right up there with Eugenics and Lysenkoism.
Yes, indeed David I Birch,
but what also tends to be overlooked, is the upper stratospheric warming that happens over the poles, not only during solar coronal mass ejections but also when there is an Earth facing solar coronal hole.
Isn’t awful to think that when the next Carrington event happens we will not have the technology to see how much of the Arctic ice is left.
It’s pretty dark up in the Arctic right now. As in no sunlight at all just like it has been for 4.4 billion years.
Assuming this situation continues for another several billion years, …
… The ice ain’t going anyway any time soon no matter how much climate scientist need to be taught about the tilt of the Earth.
Time series trends have no meaning as the least squares trend is made only for dependent x and y variables. For a line it is y = mx + b, a variation of y = f(x), y is a function of x. Since sea ice is not a function of time, this trend is garbage and is statistically illiterate. Also, for the past 8 years, the trend has been flat. Since NASA is saying time makes ice in this trend, the only solution we have to raise sea ice thickness is go back in time. This makes sense to NASA’s greatest scientists. In the meantime, no experienced trader of commodities uses time series trends of commodity prices to predict the future price. They only look for breakouts from the trend. They never attempt to time breakouts. This means that our brightest statisticians go into commodity trading, and the idiots go to work for NASA.
+1. Yep.
Shucks, well how about a picture of a starving polar bear? Would that be more convincing?
+1,000 LMAO.
As I like to say, “the “trend” is meaningless without EVIDENCE of CAUSATION,” for exactly the reason you (indirectly) discuss. The trend will change at the whim of the causes. And the causes ARE UNKOWNS in the field laughably called “climate science,” which at this stage cannot even explain past, KNOWN climate variability with any confidence.
Note the same sort of “argument from ignorance” is put forward above, i.e., “How else do you explain the PETM?”, as in, “if you don’t have an explanation, it must be what I THINK it is.” Or as Piers Corbyn so eloquently expresses this logical fallacy, “If it’s not a dog, then it must be a cat.”
Until you look at a graph of CO2 and there it is; a ramp up with a spike. How much of 5-8 degrees is attributable to that is another question.
NONE. There is NO EVIDENCE that CO2 causes warming
Produce that empirical evidence if you think there is..
Or remain, as always , an empty sack.
NONE. There is NO EVIDENCE that CO2 causes greening,
Produce that empirical evidence if you think there is..
Or remain, as always , an empty sack.
Plenty of evidence, you pathetic anti-science non-entity.
It has been presented to you MANY TIMES..
You choose to remain WILFULLY IGNORANT of it.
DENIAL of the most extreme kind.
http://jo.nova.s3.amazonaws.com/graph/plants/plant-growth/plant-growth-co2-carbon-yield-increase.gif
DENIAL of scientific studies is the ONLY way you can keep your BASELESS CO2-HATRED going, isn’t it McClod.
Thats your empirical evidence that CO2 causes something global.
You’re joking aren’t you Parrot?
[Snip. Attacks too personal, you’re going to have to stop. Tone it down and discuss or argue calmly. And the last thing I want to hear is he/she/Ze/Zi/They/His majesty, started it first. ~ctm]
Tony,
That more CO2 has greened the earth isn’t an hypothesis. It’s a fact, ie a scientific observation.
How could it not have greened the earth? By the immutable laws of physics, chemistry and biology, it has to do so. Past high CO2 regimes have also been more verdant, for obvious reasons. CAM and C4 plants, efficient in hot, dry climates, evolved in response to low CO2 epochs and periods, yet with higher than present levels of the life-giving gas.
When air is enriched in the essential trace gas CO2, C3 plants, ie the vast majority of crops and all trees, need keep their stomata open less time to get the amount of CO2 they need to make sugar. Thus, they lose less water and can live in drier areas, like the Sahel, and grow more lushly in areas where they already exist, but on a starvation diet, as before recent fertilization by human activity.
Hard to believe that anyone can be so blinded by false dogma as to d@ny such elementary science.
> “The average surface air temperature for the year ending September 2017 is the 2nd warmest since 1900”
The North Pole wasn’t even reached until 1908-09.
Busted.
There were weather stations around the Arctic circle during the late 19th century. There has never been any fixed records of temperatures above 85 N even since the satellite era, only weather buoys.
“The North Pole wasn’t even reached until 1908-09.”
And probably not even then as Peary almost certainly didn’t reach the Pole. The Papanin expedition that flew in in 1937 were the first (though still about 20 km from the Pole).
And there is not a single weather station on the Antarctic continent older than 1957.
When Anchorage, AK, and Helsinki, Finland, are in the “Arctic” there is bound to be an UHI effect with some land station temperature data. Using 60 – 90N as a definition for the arctic places a very large area under consideration. Does anybody know if this area has always been used by NOAA to define arctic, or did it change at some point in the past?
It is worse! The transition from HadCRUT 3 to 4 added Urban Heat Islands to what was arguably the most reliable temperature record – perhaps still is, compared to GISSTemp. But the upward translation allows crowing about “warmest year ever” and you know what kind of brains the Crows have. Here’s some detail: http://www.colderside.com/Colderside/HadCRUT4.html
“Using 60 – 90N as a definition for the arctic places a very large area under consideration. ”
It’s absurd. There is large scale farming north of 60 N in northern Europe. However it does sort of lengthen the arctic weather record, since Uppsala with the third longest temperature record in the World (since 1722) is at 60 N. It doesn’t look that terrifying though:
http://www.smhi.se/polopoly_fs/1.2848.1502711961!/image/temp_ar_uppsala_2016.png_gen/derivatives/Original_1256px/image/temp_ar_uppsala_2016.png
Also in Alaska’s Mat-Su Valley.
Whence Sarah Palin of Wasilla.
tty,
All maps I have show the Arctic Circle boundary at 67.5 degrees north latitude.
Jan,
The issue isn’t where the Arctic Circle is, but how NOAA defines the Arctic Zone for its nefarious purposes.
Then can Norman explain why are we not seeing an increase in temperature during those months?
http://ocean.dmi.dk/arctic/meant80n.uk.php
(June 1 =152, August 31= 243)
“The unprecedented rate and global reach of Arctic change … “
Unprecedented?
What’s the matter with these people? Seriously. You would think scientists would be obsessively precise in their statements. But no, they’re as reckless with their claims as a circus barker.
“Unprecedented”, a word I here a lot lately.
hear
Yes, like massive heat heatwaves we’re supposed to be experiencing right now when it is just normal summer weather.
UAH had November 2017 as 29th warmest November out of 39.
ooops.. That is for Australia UAH.
Recent media scares in Aussie MSM, unusually high tides. Coincides with low pressure storms AND Moon at maximum perigee. Oooops!