400 Scientific Papers Published In 2017 Support A Skeptical Position On Climate Alarm
by Kenneth Richard, No Tricks Zone
During the first 10 months of 2017, 400 scientific papers have been published that cast doubt on the position that anthropogenic CO2 emissions function as the climate’s fundamental control knob…or that otherwise question the efficacy of climate models or the related “consensus” positions commonly endorsed by policymakers and mainstream media.
These 400 new papers support the position that there are significant limitations and uncertainties inherent in our understanding of climate and climate changes. Climate science is not settled.
Modern temperatures, sea levels, and extreme weather events are neither unusual nor unprecedented. Many regions of the Earth are cooler now than they have been for most of the last 10,000 years.
Natural factors such as the Sun (106 papers), multi-decadal oceanic-atmospheric oscillations such as the NAO, AMO/PDO, ENSO (37 papers), decadal-scale cloud cover variations, and internal variability in general have exerted a significant influence on weather and climate changes during both the past and present. Detecting a clear anthropogenic forcing signal amidst the noise of unforced natural variability may therefore be difficult.
And current emissions-mitigation policies, especially related to the advocacy for renewables, are often costly, ineffective, and perhaps even harmful to the environment. On the other hand, elevated CO2 and a warmer climate provide unheralded benefits to the biosphere (i.e., a greener planet and enhanced crop yields).
In 2016 there were 500 peer-reviewed scientific papers published in scholarly journals (Part 1, Part 2, Part 3) challenging “consensus” climate science. This amounts to more than 900 papers in less than 2 years.
Below are the two links to the list of 400 papers as well as the guideline for the lists’ categorization.
And I thought those wicked fossil fuel companies spend all their money electing Trump, and didn’t have any left for such a purpose./s
And this is meaningless unless we know how many support the accepted science
Griff,
what you say is meaningless,unless you can explain the difference between what is “accepted (modeled) science” and what is “reproducible (data based) research”,which should be easy to understand for most here, but you…………., hmmm no because you have no idea what is credible in science research.
What “accepted science”? And the answer is not “97% of Climate Scientists, is it Griff???
..works both ways
Griff, a staunch advocate for science by democracy
“And this is meaningless unless we know how many support the accepted science.”
As if we needed yet more proof that Griff thinks that the truth or fact of an argument merely depends on which ‘side’ can fund the most papers or write the quickest or put up the biggest smoke screen or shout the loudest.
Yes that is why it doesn’t operate like that and the whole 97% perverted science.
Whichever side has the biggest funding must be correct.
After all politicians are never wrong.
Truth is, it would be nice to know what the percentage of peer reviewed papers ARE represented by these 400. I would also like to know if the percentage is increasing or decreasing. As example, if there was 10,000 papers published and 400 were skeptical, would I be impressed? If there were 1000 papers published and 400 were skeptical, then I would certainly be impressed differently. Without a reference to go by, it has no more significance than a car maker saying XYZ motors has doubled its share of the market since the new model was introduced. If its share was .001% and it increased it to .002%, am I as impressed?
So unless we have a reference to go by, 400 papers this year and 500 papers last year are nice numbers, but are they significant? I have no idea how many total papers were published last year or in the first 10 months of this year. Realize I am not a “scientist,” I am a reader trying to learn and express my opinion when it seems appropriate, but unlike many of the commenters, I have no knowledge of how extensive is the number of papers published each year.
More comedy from Griff. Four hundred papers that question climate alarmism (if in fact this is the case) demonstrate that CAGW is not settled, just as the essay states.
The number of papers that support CAGW is pointless because science is not a democracy. So-called “consensus” is not a substitute for proof in science. Did the Laws of Thermodynamics become laws in science because of consensus or because they could not be disproved? I’m not a scientist, but I believe I know the answer to that question.
Furthermore, if any supporting papers are based on the climate models and the credibility of the climate models is debatable, then those papers are disputable as well, are they not?
Griff’s choice of words here is also interesting. Uses ‘accepted’ instead of ‘supported’. Accepted by whom?
Keep plugging away here anyway Griff. There are a number of people here undoubtedly who find you more entertaining than I probably do.
I know this question may not even survive ” In moderation ” but tell me this.
Why on earth is anyone wasting the paper it takes to write 400 (or more) papers that are all on the exact same question: ” Does CO2 control the global climate ?? ”
Obviously most of this excess publication is just pablum; the written equivalent of elevator music.
I would guess that at least 90% of it is just total garbage, written to satisfy the expenditure of the freebie grant money.
G
“Furthermore, if any supporting papers are based on the climate models and the credibility of the climate models is debatable, then those papers are disputable as well, are they not?”
They most certainly are. Every paper we see on CAGW is disputable since they all assume something that is not in evidence, namely, that CO2 is adding any net heat to the Earth’s atmosphere.
There is no evidence for CO2 controlling the Earth’s atmospheric temperatures but every study assumes it does. The foundation of all these papers is an assumption not based on facts, but based rather on theory and pure speculation.
griff, Einstein’s theory of general relativity was not peer reviewed, and not accepted by many, if not most theoretical scientists, and yet…….
about the only thing you have ever displayed in here is your inability to critically think
More amusingly, the Nazis published a book titled “A Hundred Authors Against Einstein”. When asked about the book, Einstein said: “Why a hundred, if I were wrong, one would have been enough”.
What was even funnier was when science institutions and societies refused to overturn and denounce GR and QM hundreds of scientists resigned from them in protest. Inside Germany at the time most gathered around Ernst Gehrcke (https://en.wikipedia.org/wiki/Ernst_Gehrcke). You will see in the article they tried to form a society roughly translated as “Working Group of German Natural Scientists for the Preservation of Pure Science”. They weren’t alone there was a whole group of them and it’s pretty funny stuff when you look at it with the benefit of history. There were a lot of scientists who just could not believe and accept that Classical Physics had just been given its death certificate.
That group formed the basis of what would become Deutsche Physik in the 1930’s (https://en.wikipedia.org/wiki/Deutsche_Physik). There were similar groups formed in Britian and USA but I don’t know there history as well.
You kind of beat me to my point.
I wonder how many of the papers had the boiler plate acknowledgement of CAGW in the last paragraph. Really, I have trouble thinking they could get published otherwise.
Thomas Kuhn says that scientific errors are corrected slowly. Where the error is widely believed the politics of the situation dictate that the corrections will nibble away at the error rather than directly refuting it. Eventually, nothing is left of the error and it is replaced by a better model.
But you know, you have to hand it to Griff. He takes a stand and no matter what he will defend that position. Defiant to the end on his sinking ship. I salute you captain. Damn the torpedoes.
Perhaps “Griff” is a cover name for Hillary.
The problem with Griff is that he won’t defend his position. He’ll recite his usual CAGW nonsense but never responds to follow up questions.
“Perhaps “Griff” is a cover name for Hillary.”
Nope, not shrill enough.
Dobes 11:01: The Bismarck went down with all guns blazing. So did the Confederate Alabama in 1864.
Michael Mann maybe?
” The Bismarck went down with all guns blazing. So did the Confederate Alabama in 1864.”
So did the fighting USS Samuel B. Roberts in World War II. The gunners were still working the guns as the ship sank under the waves.
http://www.thehistoryreader.com/military-history/for-crew-and-cmuel-b-roberts/
“They would also privately agree, for most would never admit it publicly, with what The New York Times concluded shortly after the battle, that “the gallant action fought by this group—particularly the short-lived battle put up by the four ships that were sunk—will surely go down in American naval tradition as one of the most heroic episodes in our history.” They would agree with the heralded naval historian Samuel Eliot Morison, who labeled their actions against the Japanese on October 25, 1944, “forever memorable, forever glorious,” and with the acclaimed novelist Herman Wouk, who wrote that the vision of the Samuel B. Roberts charging through the waters straight at Japanese battleships and cruisers “can endure as a picture of the way Americans fight when they don’t have superiority. Our schoolchildren should know about that incident, and our enemies should ponder it,” for the action is “one that will stir human hearts long after all the swords are plowshares: gallantry against high odds.”
end excerpt
Our schoolchildren should be taught this history, and our enemies should ponder the American fighting spirit.
In November 1940, HMS Jervis Bay (a passenger liner equipped with seven 6-inch and two 3-inch guns) was acting as the sole escort for the 37 merchant ships of Convoy HX-34 when she was faced with the Deutschland-class pocket battleship Admiral Scheer. Despite having absolutely no chance whatsoever, Captain Edward Fegen ordered the convoy to scatter and set course to attack the Scheer. After the Jervis Bay was duly sunk, SS Beaverford (a cargo liner with one 4-inch and one 3-inch gun supposedly for self-defence) took up the struggle. Captain Pettigrew sent the following message: ‘“It is our turn now. So long. The captain and crew of SS Beaverford”. After a further four hours of desperate struggle, SS Beaverford was sunk by a torpedo; but thirty-two ships of the convoy escaped to bring their desperately needed supplies to a besieged Britain.
Torpedoes are no respecters of persons
Sorry: Convoy HX-84 from Halifax, Nova Scotia to the UK
Thanks for that inspiring story, photios.
The end of the Bismarck was somewhat less glorious than “going down with all guns blazing.”
Even less glorious was the fate of the hundreds of Bismarck crew left stranded in the water, when HMS Sheffield had to take off (from picking up Bismarck survivors). Enough senior officers from Bismarck were taken aboard Sheffield, so we know pretty much what the end was like.
The appearance of a fully armed German U-boat on the scene left no choice but to leave, for their own safety.
G
By “accepted science” do you mean the supposed AGW theory… or the “it’s all BS” true consensus view?
“If I were wrong, then one would have been enough!”
(Einstein quoted by Hawking)
Not a numbers game Griff.
That should be about 400 * 97/3 = 12,930 papers.
How many papers supported the CAGW hypothesis in the same period?
Griff, you are much more entertaining than your mate, Saul Alinskyish SJW ReallySkeptical.
I really liked your comment I read earlier today how China, India is heavily investing in renewable. It is like a child believing in Santa. You can’t but smile.
Italia in banning coal! How cool! I hope they go to the logical end and ban also import of steel and other stuff and electricity, otherwise they could end up using some coal somebody else burnt.
In Eu though, they can’t ban import. They just do a stupid thing! No wonder, it is Italy!
Did you know Sweden banned nuclear in 1980. Shame they don’t afford shutting the reactors down! 37 years of trackrecord on banning stuff that can’t be banned in Sweden! Lovely. You just can’t but smile!
Griff;
Settled Science is overturned by a single confirmed result that it cannot explain.
There are many thousands of sets of experimental results that show General Relativity to be correct. If the observations that neutrinos traveled faster than light were real and not some instrumentation defect, GR would be wrong.
One researcher, James Snow, overturned the consensus on the miasma theory of disease. Kepler overturned the consensus that planetary motions were built up of cycles, equants, and epicycles (Copernicus and Ptolemy believed in the same system on planetary motions and only disagreed on which point was fixed. By applying the parallel axis theorem, you could derive the Copernican system from the Ptolemaic system and vice versa. From a mathematical perspective Copernicus and Ptolemy described the exact same system and there were no observable differences between them and they were both wrong.). Father Georges Lemaitre overturned the settled science of the Steady-State Universe.
When I compare the change in global temperatures from 1980 to 2000 with the human emissions of CO2 from 1980 to 2000 and then perform the same comparison from 2000 to the present, unless there is a well defined, observable result within the anthropogenic global warming hypothesis to explain what I have observed, I have overturned the settled science of anthropogenic by myself and can confidently proclaim that the 97% of climatology researchers that disagree with me are simply wrong.
Is there an aspect of the “settled science” that accounts for my observations?
If the answer is yes, please provide it.
If the answer is no, then (because lots of other people have also noticed this) the robustness of the result that I have observed stands and the consensus position of 97% of climate researchers is wrong!
Richard, I think you missed something.
“Climate Science” doesn’t have to explain confirmed results that overturn it. It only has to proclaim a bit louder.
Ah, but all it takes from the CAGW perspective is for Tommy Karl and Gavin Schmidt to change the historical sea surface temperature record again.
If your hypothesis is not supported by the data, why it’s obvious that the data must be wrong, and has to be changed to fit the hypothesis.
Isn’t that how “science” is supposed to work? What’s that? It ISN’T supposed to work that way? Hmmm.,,
Griff,
it’s meaningless to you because it doesn’t appear in the Guardian.
Griff,
I hate to be the one to break it to you, but science publications aren’t a referendum vote to accept or reject the supposed paradigm. It isn’t about the quantity, but the quality. Any one of these or future publications have the potential for turning the supposed paradigm on its head. The importance of the publication of the 400 papers is to demonstrate that the science is NOT settled, that there are numerous issues that still need to be addressed, and that there are highly qualified scientists who hold positions contrary to what the MSM claims to be the consensus.
Should you ever indulge in an introspective moment and ask yourself why you suffer so much ridicule, I suggest that you reflect back on your absurd remark above, which is all too common from you.
BTW, have you ever apologized for questioning the credentials of Susan Crockford? Another example of speaking before doing your due diligence.
Griff there’s no such thing as ‘accepted’ science or ‘unaccepted’ science for that matter, there’s only SCIENCE! Just as there’s only ‘knowledge’ (the absence of which is ignorance!).
Hey come on, this guy Griff isn’t a real person is he. Surely this is a shill that the moderators throw in to give everyone a piñata to bat around. If Griff were real he would have to be some masochist or something. Come on.
He’s quite real, his name is Ed, and he lives in th UK.
My thought exactly. The “scientific” approach to dealing with uncomfortable evidence is to ignore it. That has been standard operating procedure for several years and the CAGW and their mouthpieces are very good at ignoring WUWT and all contrary evidence. Griff is clearly a manufactured every warmista to make it seem as if the CAGWistas actually care about debating the science. They don’t and as long as the grant money flows, they won’t.
Griff has become a celebrity at WUWT !
Too many comments in reply to Griff does not make sense.
Anthony u are incorrect …. Ed was a talking horse and he was on TV & lived in the US in 1960 …. 97% of vets agree and so it is settled!
Griff writes
Peer reviewed papers are, by definition, accepted science.
Why is this meaningless unless we know how many support the accepted science? What do opinions have to do with any of this?
We don’t ask the students to vote on the correct answers to math tests?
They probably do in today’s schools and universities.
Each time Griff makes such statement we need to send him this quote: “In questions of science the authority of a thousand is not worth the humble reasoning of a single individual.” —Galileo Galilei (1564-1642) I was raised and taught throughout school that there was no such thing as scientific consensus. I was never taught that as a scientists there was some litmus test that you must pass to have a scientific paper publishes, such as whether you or not you supported “the accepted science.” New scientific breakthroughs would never happen if that was a test since almost always such breakthroughs challenge “accept science.”
I would surmise that you have never read Thomas Kuhn. In the postscript of The Structure of Scientific Revolutions he discusses the role of consensus in scientific paradigms.
A truth is only true if accepted by the ministry o truth.
Isn’t it true, Griff?
N.B. Still I’m thinking that Griff is invented by Anthony to make this site more lively. Could there really be a human being so stubborn as Griff?
I don’t know how long you’ve been reading WUWT.
I’ve been reading for several years. Aside from the content of WUWT not needing to be “livened up”, from what Anthony has shown of himself here, he wouldn’t do that even if the site seemed to need it.
He’s an honest man. As fallible as the rest of us but a man of integrity.
For the record Gunga Din I also think Anthony Watts is a man of integrity, I only suggested Griff is a piñata because he keeps asking for it. As a Scientist I can assert, along with others, that concensus is the refuge of poor Science, good science produces a wow, look at that response.
Its not about popularity. Your comment is meaningless.
I think you are missing the point. If the science was settled, then there shouldn’t be any, let alone nearly 1000 studies detailing problems with the consensus. It’s not a competition to have the most. One single paper is enough.
translation: “The fact that I support the climate consensus trumps my scientific proof that there’s a flaw in the climate consensus.”
Only the right ones matter, not the numbers of each.
Let me see if I have this straight, contrary science is to be ignored if a majority of “scientists” disagree with it.
Nice to know how much of a totalitarian you are Griffiepoo.
Griff, there are many lab models that fall to the ground when it is discovered that nature does something else. For example, various forms of naturally occurring plasma continue to startle researchers, who find plasma extremely difficult to model and very difficult to observe in nature. However, under controlled conditions, plasma can be harnessed and caused to act in certain ways.
Similarly, the spectral properties of CO2 (“the science”) under controlled laboratory conditions are indeed known. But how, or whether, changes in atmospheric CO2 works to change temperature as it absorbs and re-emits long-wave radiation coupled with a highly variable atmospheric/oceanic/geologic globe is another thing entirely, and continues to evade the assumptions and models of even highly skilled climatologists.
Science doesn’t go by “acceptance”. It goes by what can be confirmed or shown false.
CACA has been repeatedly shown false. It doesn’t matter how many trough-feeding, rent-seeking “scientists” accept Catastrophic Anthropogenic Climate Alarmism. Mother Nature has long ago smacked them all down.
I was seized by doubt, but knew to avert my eyes. I prayed to Al-mighty Gore for guidance, but He demanded an unGodly fee to speak unto me. I rendered unto him his ruinous due and He began to speak. He demanded that I accept the true faith and commit myself to a cold and powerless existence, that I might enter into the warmth of His self-rightiousness, and then He mounted upon a magnificent chariot of stretchlimoness.
Greatly was I tempted, but a small voice spoke softly unto me, saying, “verily, this fat bastard is a boring, self-promoting liar. He speaketh as does a politician or vacuum cleaner salesman, to distract me from the great evil that He attempts. For like the vacuum salesman, He sucks even more than His product, which comes from the land of the Phoni-stines and is bullshit”.
So I spoke unto Him and raised my eyes, and I saw that He was just a failed divinity student and politician, who didn’t even understand what He sells, and only profits from it. And so He is like unto the lowest mobster , who afflicts the poor and honest by demanding protection money against a threat that He createth out of whole cloth. And I asked Him for a lift to the airport, because I like to go South where it’s warm. And He spoke to me with great truth, saying, “No can do. I have a private jet waiting at a private airfield. Besides, you shouldn’t be flying! It’s bad for the environment and y’all aren’t important enough”!
With that He sped away, and I awoke as if from a dream as his limo splashed cold water on my face, and my eyes were opened!
Hallelujah! The weather is no different than the 1970’s!
Do you mean this type of support?
“If we were to look at the papers that Cook et al. (2013) used to concoct the 97% “consensus” paper, for example, we’d find that Cook and his co-horts actually classified papers (and magazine articles) about cooking stoves in Brazil, phone surveys, asthma-related ER visits in Montreal, TV coverage…as “endorsing” the position that most of the global warming occurring since ~1950 has been human-caused. Really.”
1) Not many scientists disagree with the Great Climate Collusion, er, Consensus
2) Sure, many scientists do disagree, but they aren’t “real” scientists
3) Ok, they are actually real scientists, but they are in the pay of Big Oil
4) Sure, we can’t prove that they are in the pay of Big Oil, but there still aren’t too many of them anyway
5) Ok, ok, there are quite a few real scientists, who aren’t in the pay of Big Oil, but not as many who DO believe in the Great Climate Collusion, er, Consensus. And we all know that its the number of scientists who believe in something that makes it sciency and stuff.
Repeat as needed
No silly, it’s not a vote! Science is not “majority wins”.
Can they be reproduced. Griff u idiot, it only takes 1 experiment to debunk ANYTHING! I could give a rats arse how many agree with a paper. Drink some more Kool-Aid!
“Walk toward the fire. Don’t worry about what they call you.” – Andrew Breitbart : If I walk toward the fire, I suspect they’ll call me Bernie.
I have problems with that having any meaning, it’s as silly as the CAGW claims.
There are probably millions of historic and current papers that support classical physics, yet it took only one paper in 1915 to prove it was wrong. Science doesn’t care about numbers.
Correction: Classical Physics was not shown to be “wrong” by Einstein. Instead, he showed it to be a special case of a more general theory (Relativistic Physics at high speeds and Quantum Physics at very small scales).
No, Relativistic Physics and Quantum Physics do show that Classical Physics was but a 1st order approximation to reality and hence wrong in the sense that it was an inadequate description of universal laws. Classical Physics is not a special case. Even in a universe with just a point mass and no motion the spacetime metirc is Schwartzchild not flat. And if there were no mass then it can’t be classical because none of Newton’s Laws would be applicable.
Graeme I think needs to do some catch up he is about 100 years behind 🙂
SOM is correct we use classical physics because it’s a simpler 1st order approximation and easier to teach and for the average person they don’t need to know any deeper.
However be under no illusion the we do so fully in the knowledge that it is wrong and it isn’t going to make a comeback some day and we declare we made an error. I think we have setup experiments to violate every law of classical physics. So ye old classical physics is not coming back anytime soon.
Actually, I suspect the entire published literature in physics up to 1905 numbered at most, some hundreds and in total science some thousands. I believe it was possible to read the entire body of scientific knowledge at that time. Indeed, science was far more eclectic. These meaty works are the foundation of our modern civilization and wellbeing.
The scientific works of the past 50yrs, driven by exponential burgeoning of a university–publish-or-perish-grants-industrial-enterprise, numbers over 50million and is expanding by 2.5million a year.
http://www.cdnsciencepub.com/blog/21st-century-science-overload.aspx
There is no doubt that, unlike the terrible loss with the burning of the Alexandria library a couple of millenia ago, one could randomly pick 100,000 papers and safely burn them without a care (having already safely stowed the papers up to, say, 1930 as an exceptable abundance of caution) .
Being an old guy, the most gobsmacking discovery of the nonentity who Cooked the 97% consensus study, was the fact that there were over 11,000 climate science papers published over the recent 10yrs that Cook selected for his sample population. Think about it! Three papers every workday of the year! And in a ‘science’ that has only one y=mx+b type of formula to droodle with!
The last 5 or 6 decades belongs to engineering. There were some spin-offs in astronomy, and medical science held up its end, but science exploded like a firework into disciplines of fancy. How about a science that was designed by a Canadian коммциisт high school dropout Maurice Strong to effect the marxbrothers global governance dream. One paper as an example fitted diversity and glass ceilings in – a study of feminine glaciology.
+1
Sadly even fields such as geology are becoming these fantasy based publish-or-perish show and tells thanks to the sanctimonious condemnation of CO2.
I think your statement says more about that people don’t recognize great science discoveries when they occur. The LHC and LIGO and the publications from those have now completely rewritten science in total and have been given Nobel Science prize in really short time after those discoveries says very different to you. China has put up a quantum Satellite orbitting Earth and we are using QM communication between Earth and space which changes everything in numerous fields.
LHC installed the Standard Model and killed countless theories and rewrote the book on particle physics and the universe we live in. LIGO has cemented GR as the model gravity removing falsifying countless competing theories. I know a few scientists who were backing MOND are either looking for a new research project or trying to modify their pet theory to be relativistic. The Chinese QM satelitte has shown that as the theory predicted there are no distance limits on QM effects. There are no competing models to QM but it was demonstration of it’s predictions and how profound they are.
When LIGO warned optical and radio telescopes to turn to look at a two Neutron Stars merging this month it shows the sorts of impacts these discoveries have from one discovery comes others. We saw an event that without LIGO we would never have seen. Similarly the LHC has given us a number of discoveries since and because of the discovery of the HIGGS. QM will advance rapidly because we can test QM over massive distances and into space.
The decade 2010-2020 probably rates third behind 1910-1920 and 1920-1930 as the most significant changes in science. It would be hard to beat those two decades because those mark the death of Classical Physics and change of that magnitude again is probably unlikely.
LdB
Seems obvious to me that you are talking about engineering. This is fine, and proper science is indeed just engineering of an apparatus to check a theory against new facts.
Regarding climate, you could have talked about ARGO or satellites. It is just a shame that so much money was thrown at not working solutions (solar, wind, batteries,…) to non problem, and so few at real science device.
the count has meaning insofar as the Alarmists insist there are no peer-reviewed papers that challenge CO2 GW – that used to be the argument not too long ago when these lists began
Einstein’s 1905 papers showed that, while classical physics worked over a certain range, it was fundamentally wrong.
Newton was wrong to imagine that time and space were absolutes and that gravity worked instantaneously between any two masses in the universe.
Einstein showed that space and time are relative, while the speed of light and gravity are absolute.
So classical Newtonian physics, despite its utility in the ordinary world, was basically wrong.
Wow. I got bored after looking at the first 15 or so abstracts and not seeing any that “debunk climate change alarm”. It seems any time a scientist writes something on medieval times or sun shining or the LIA and doesn’t talk about CO2, they are debunking climate change.
What a joke.
In so doing they indicate CO2 is not worth including to explain climate patterns – it has too little explanatory effect. These researchers are trying to determine what causes climate change, irrespective of what causes environment policy to change.
No. All the majority of the papers point out is that factors other than CO2 effect the climate. Which is a very different thing from saying that CO2 does not effect the climate. No serious climate scientist would take the position that CO2 and only CO2 drives the climate — this list seems to be creating a straw man and demolishing it.
There appears to be a number of papers in the list that dispute the idea of CO2 as a climate driver – a couple for instance are predicting that the world will cool until about 2050 (or 2100) AD. Then there are the usual idiots who dispute the whole idea of the greenhouse effect but can’t explain why the earth’s temperature is significantly higher than it should be based on simple thermal equilibrium with incoming solar radiation.
And so the whole list would probably support the 97% consensus or at least a more extreme version. There might be 10 papers in the list out of 400 that dispute CO2 as a climate driver and compare that to the several thousand that would have been published this year in support of that theory and you would easily find that over 97% of published papers agree with the consensus.
There is nobody who claims that CO2 doesn’t affect that climate. That’s a shibboleth that you have built.
On the other hand, the alarmists have been claiming that CO2 is the major player in the climate.
Any paper that shows that other factors are major players decreases the room left for CO2 to maneuver in.
MarkW,
The statement that “There is nobody who claims that CO2 doesn’t affect that climate.” would appear to be clearly false as a simple glance though the comments on this website would reveal that lots of people dispute the greenhouse effect and the role that CO2 plays. There are also paper in the list such as Blaauw’s paper which states “This paper demonstrates that global warming can be explained without recourse to the green- house theory”. Or the paper by Allmendinger which agains disputes the fact that CO2 is a greenhouse gas or whether or not the greenhouse effect exists at all.
As to the amount of “room” left for CO2 to “maneuver in” that would depend on whether or not other factors are changing significantly at the same time as we are pumping large amounts of CO2 into the atmosphere. Clearly the main driver of the climate is the sun – but while the effect of the sun is huge it is relatively constant and only changes significantly on the timescales of probably millions of years ( it takes up to 1 million years for photons to reach the surface of the sun from the centre so that is the timescale over which you might expect significant changes to solar radiation to occur).
Germinio October 25, 2017 at 5:42 pm
The effect of four molecules of CO2 per 10,000 dry air molecules versus three a century ago is at best negligible.
While TSI doesn’t fluctuate much, its spectrum composition does. By a lot. The UV component of TSI varies by a large factor, and it is that most energetic part of the spectrum which has the largest climatic effect.
CO2, not so much. As in not at all, within measurement error range.
Germinio, you seem to be confusing “disputes the fact that … the greenhouse effect exists at all” with what this position actually is.
No one is disputing that dipole and temporary dipole molecules literally absorb certain bands of LWIR and reemit them, what we are not doing is leaving the science as ‘simple’ as that. This quantized energy absorption, measuring whopping electron volts of energy, has an extremely exaggerated effect on the temperature of a planet’s atmosphere, that is what these papers are saying and empirical science supports them.
OK, there are a few cranks, but your attempts to paste that position as the skeptical position just shows how dishonest and corrupt you are.
Germinio, back when CO2 was over 5000ppm, the disasters that your side predicts didn’t happen.
I’m not going to worry about CO2 going from 400ppm to 500ppm.
first two say the sun dood it….don’t have time to read more
@ReallySkeptical, Exactly! They do not debunk anything. The same list with false claims periodically dredge to the surface of the bubble churn. Worthless, but no end in sight.
“They do not debunk anything. ”
There really is zero science to actually debunk.
There is no CO2 warming signature in the satellite data (plenty of agenda driven warming in GISS, though)
There is only unproven assumption and conjecture on the AGW side of the ledger.
There is no empirical proof than CO2 causes any warming in our convectively controlled atmosphere.
Its a baseless anti-science MYTH !!
400 papers saying the slight beneficial warming is from other sources, mostly NATURAL.. eg THE SUN.
Get over it !!
Like trying to debunk that aliens exist. Cant bunk it either
Poor TotallyGullible.. DENIAL in its strongest form.
Solar influence outweighs the zero effect of increased CO2.
Sorry you aren’t able to let that basic fact into your agenda.
Well ReallySkeptical I see you have used quotation marks. But nowhere in the article has the words you have quoted. That my friend is a big no no for anyone looking to have any creditability.
And you have missed the point anyways. It is obvious to me that the article simply makes the point that the alarmist climate change hypothesis is not settle science. What ever that is.
Hmmm. Try the title.
He says that these papers “cast doubt on the position that anthropogenic CO2 emissions” role in warming. But they don’t. They say that other things can affect climate, like the sun. Well, based on the sun, we should be cooling. But we are not.
As I said, what a joke.
“Well, based on the sun, we should be cooling.”
Only if you remain ignorant of the massive ocean storage effects
And you seem to be destined to remain WILFULLY IGNORANT.
@ur momisugly ReallySkeptical. My sincere apologies. No excuse on my part for missing that.
RS writes,
“He says that these papers “cast doubt on the position that anthropogenic CO2 emissions” role in warming. But they don’t. They say that other things can affect climate, like the sun. Well, based on the sun, we should be cooling. But we are not.”
you earlier stated,
“Wow. I got bored after looking at the first 15 or so abstracts and not seeing any that “debunk climate change alarm”. It seems any time a scientist writes something on medieval times or sun shining or the LIA and doesn’t talk about CO2, they are debunking climate change.”
Here is what the first TWO Abstract you claimed you read:
“Yan et al., 2017 Morpho- and hydrodynamic variations seem to coincide with northern hemispheric solar forcing. The Medieval Warm Period (MWP) until about 1270 CE displays generally moist and warm climate conditions with minor fluctuations [stability], likely in response to variations in summer monsoon intensity. The three-partite period of the Little Ice Age (LIA), shows hydrologically unstable conditions between 1350 and 1530 CE with remarkably colder periods, assigned to a prolonged seasonal ice cover. … Seasonal freezing periods in excess of the average time of frozen water bodies also occurred in periods of the well-known grand solar minima and indicate stronger seasonality, possibly independent from variations in summer monsoon strength but with links to global northern hemispheric climate. you read:”
and,
“Li et al., 2017 We suggest that solar activity may play a key role in driving the climatic fluctuations in NC [North China] during the last 22 centuries, with its quasi ∼100, 50, 23, or 22-year periodicity clearly identified in our climatic reconstructions. … It has been widely suggested from both climate modeling and observation data that solar activity plays a key role in driving late Holocene climatic fluctuations by triggering global temperature variability and atmospheric dynamical circulation … In short, the mechanism of the climatic variations in NC can be likely summarized as follows. The strengthened solar activity could be significantly amplified by the variations in ultraviolet radiation as well as clouds (e.g., Haigh, 1996; Tinsley, 2000), resulting in the marked variability in global surface temperature. … Additionally, increased El Nino-Southern Oscillation (ENSO) strength (possibly El Niño-like phases) during drying periods, increased volcanic eruptions and the resulting aerosol load during cooling periods, as well as high volumes of greenhouse gases such as CO2 and CH4 during the recent warming periods, may also play a role in partly affecting the climatic variability in NC, superimposing on the overall solar-dominated long-term control (e.g., Wanner et al., 2008; Tan et al., 2011; Kobashi et al., 2013; Chen et al., 2015a,b).”
I am calling you a liar since it is well known that the IPCC and many warmists AGW believers continually state there is little to no significant Solar effect on climate changes,that it is the molecule god CO2 that pushes the clouds and winds around,not the sun. That it is the same awesome molecule god that can cause run away warming (which never happened in the last billion years) warming by going from a trace concentration to a slightly less trace concentration in the atmosphere.
The papers make clear there are alternative viewpoints on what drives the climate,by pointing out the chronically underrated Solar role in it,which YOU seem to mock.
Sunset.. a Liar? I’m not sure.
Just too brain-washed and unskeptical to let any counter thoughts passed his anti-CO2, anti-human, ANTI-LIFE agenda.
Cool. I’m a liar now.
Well, you can lead a horse to water, but you can’t make him drown.
The abstracts say that lot’s of things affect the climate. We actually know that. Models take most of this stuff into consideration (much of it based on papers in that list BTW). But one big factor is that the sun is in a slight cooling phase at the moment, and that suggests the earth should be cooling albeit only slightly.
But it is not, not by a long shot.
Hmmmm. I wonder what _one_ thing is different now than in the past? It’s on the tip of my tongue…
Hint==>when Orwell wrote “1984”, it was not intended as an instruction manual.
“Well, you can lead a horse to water, but you can’t make him drown.”
But you have been led to water.
…. and you are still drowning in your own brain-washed miasma.
” But one big factor is that the sun is in a slight cooling phase at the moment, and that suggests the earth should be cooling albeit ”
You continue to display your abject and wilful ignorance about the oceans massive storage capabilities.
“I am calling you a liar since it is well known that the IPCC and many warmists AGW believers continually state there is little to no significant Solar effect on climate changes,that it is the molecule god CO2 that pushes the clouds and winds around,not the sun.”
As usual, no supporting links or information. And such an unsupported claim makes RS a liar, to boot! The AR5 SPM actually says:
“There is high confidence that changes in total solar irradiance have not contributed to the increase in global mean surface temperature over the period 1986 to 2008, based on direct satellite measurements of total solar irradiance. There is medium confidence that the 11-year cycle of solar variability influences decadal climate fluctuations in some regions. “
They say specifically that TSI did not contribute to recent warming, not because it couldn’t, but because TSI has been observed, and didn’t increase. They expllicitly agree that 11-year solar has local effects, which is what the first two papers are about (China).
reallyskeptical: You can make a horse drown. It’s really not that hard.
Whether or not the planet is cooling as the sun cools is at present hidden by the lingering impacts of the recent El Nino.
As you already know incrediblyGullible.
IncrediblyGullible.
You claimed to have read the abstract of the first 15. The first two of those abstracts clearly contradict the claim you made regarding them.
What adjective would you use to describe such a person?
“The AR5 SPM ”
So what.. Its a NON-SCIENTIFIC POLITICAL summary.
And you KNOW that, so why bring it up except to DEFLECT from the reality that CO2 warming in our convective atmosphere is just UNPROVEN and basically just ARRANT NONSENSE.
Reallynotatallskeptical is like an old Southern sheriff. That there dead fella with the big hole in his forehead died on account a he stopped breathin. Asphyxiation, just like all my cases!
CO2 I reckon.
ReallySkeptical
“Wow. I got bored after looking at the first 15 or so abstracts……..”
ADHD?
15 papers, all saying to you “IT’S THE SUN, STUPID”
No wonder you gave up !!
Your head must have been ready to explode !!
Notice that he calls these papers. “What why this list of papers is a joke.”,which means he doesn’t want to admit that the warmist backed science of AGW is NOT settled ,since these papers he calls a joke primarily say it is the SUN the drives the climate,not the micosmic god CO2,a trace gas with a trace IR absorption effect.
He is clearly fighting against the 400 papers since it doesn’t support his AGW religion.
RS, failed to read this part:
“During the first 10 months of 2017, 400 scientific papers have been published that cast doubt on the position that anthropogenic CO2 emissions function as the climate’s fundamental control knob…or that otherwise question the efficacy of climate models or the related “consensus” positions commonly endorsed by policymakers and mainstream media.
These 400 new papers support the position that there are significant limitations and uncertainties inherent in our understanding of climate and climate changes. Climate science is not settled.”
You have Really bad eyes?
You can’t cast doubt on a friend dying of cancer by telling him his heart is beating fine. It doesn’t work.
What why this list of papers is a joke.
No, but you can cast doubt on a diagnosis that is contradicted by observational evidence. Is your hypothetical friend actually dying of cancer, or has he only been told he is dying of cancer by less than credible soothsayers?
“You can’t cast doubt on a friend dying of cancer”
No-one here is dying of anything
The Earth is finally starting to THRIVE, thanks to increased CO2 and a slight solar forced warming.
Read my long comment where I am calling you a liar,since you are trying hard with your trolling word games.
The first 15 abstracts you claim you read,make clear that Solar influence on the climate is very significant, to the point that the microcosmic god CO2 isn’t. While the Warmists and the IPCC say the very opposite.
The second abstract talks about the role of the sun and CO2:
“… Additionally, increased El Nino-Southern Oscillation (ENSO) strength (possibly El Niño-like phases) during drying periods, increased volcanic eruptions and the resulting aerosol load during cooling periods, as well as high volumes of greenhouse gases such as CO2 and CH4 during the recent warming periods, may also play a role in partly affecting the climatic variability in NC, superimposing on the overall solar-dominated long-term control (e.g., Wanner et al., 2008; Tan et al., 2011; Kobashi et al., 2013; Chen et al., 2015a,b).”
They say climate variability is SOLAR DOMINATED,with CO2 and CH4 providing a minor effect.
You are here to spread B.S. everyone with your absurd misleading crying foul claims.
the sun has been shining less since about 1950. Not much less, but less. But we have been warming since then. So hard to use a cooling sun to cause more warming.
Again you display your ABJECT and WILFUL ignorance about the ocean’s massive energy storage ability.
So funny to watch. 🙂
Please try again.
Maybe think about what the recent El Nino actually did. 😉
Are you capable of actually “thinking”??? We will see. !
well, selectivelyskeptikal, obviously this paper, like any other paper, may be wrong.
And you do have the right to try prove it is wrong (although the way you try it is so clumsy and inefficient, it only fools yourself, but, anyway, that’s not the point).
Provided, big caveat, that you admit that you, too, may be wrong, along all with so many claims from IPCC and followers debunked.
Are you ready for that? You don’t seems so…
“the sun has been shining less since about 1950.”
What a load of arrant BS.
The 1950 – 2000 period had the largest cumulative solar energy in several hundred year.
I love it when trolls cite evidence that actually disproves their position.
Notice that the two of the prior three peaks were all higher than any time prior to 1950.
IncrediblyGullible wants to confuse the issue by insisting that unless the planet responds instantly to changes in the sun, then the planet doesn’t respond to changes in the sun at all.
This patient is running marathons and has a small mole that hasn’t changed in 18 years!
reallyskeptical October 25, 2017 at 1:09 pm
No, you are a joke.
Or would be if mass murder were funny.
CACA advocates are antihuman mass murderers. You have thrown your lot in with the enemies of humanity. And the planet. Since Earth is begging for more CO2.
My guess if all of the 15 abstracts did scream that AGW is a sick fantasy and proved it with hard data and analysis that you would still claim them to be a joke. First they are abstracts not the entire papers. You sound like a lazy graduate student or some of the federal scientists I knew. If they read journals at all they only read the abstracts and not the entire paper. More than once they were embarrassed in meetings quoting only what the abstract said and not have a clue what the entire paper concluded. Once after ripping a presentation by a group of federal scientists during a major policy meeting the presenters cornered me during the break. They had not read even the abstracts of four important papers critical to what we were discussing. They wanted to know how I could read so much. Two admitted they had read little since graduate school and certainly not the latest and greatest pertinent literature as I had.
Like most people, I read about 30 titles for each abstract I read and about 30 abstracts for every paper I read. Or at least look at the pictures, not sure I really read them anymore…
If “15 abstracts did scream that AGW is a sick fantasy” I would not call the list a joke.
But they didn’t.
So I am going to stick with the list as a joke.
DENIAL is deep with you, isn’t it.
The first MANY papers clearly show that the sun is the main driver.
There is ZERO evidence of CO2 warming
No CO2 warming signature in the satellite data,
NO CO2 warming signature in the sea level data
NO CO2 warming signature ANYWHERE.
It is A MYTH, an un-validated FANTASY
Reading only abstracts is very misleading. Many papers are very different from what the abstract says. The abstract appears to be how the paper is sold, not what it really says. At least that what’s I find reading the abstract AND the paper.
“Reading only abstracts is very misleading.”
Not really. And if that is true, it’s paper not worth reading.
There’s no evidence that he actually read them. Especially when the abstracts say the opposite of what he claims.
Well you decently included the defining term alarm. Real skep, what exactly is it you are skeptical about? Are you skeptical about skeptical criticisms of climate science? Hell skeptics already have that covered, too, by definition. Besides, if that is what you named yourself for, how did you know before a skeptic criticized something that you were going to disagree? That a criticism or error found, needed to be defended against? This won’t be in the talking points you were cramming, but do you see what I’m getting at? It may be a bit deep, I admit.
He’s just trying to emulate the lies and deceit of the SkS web site.
And doing a good job, but only at that one little facet.
Lies and deceit are embedded in his moniker… the rest just follows.
Is that you John Cook ?
ReallySkeptical? Why?
I can spell it…usually…
Nothing to really “debunk”
AGW is an EMPTY non-science.
Really?
Did Mann check that “One Tree Ring to rule us all” for CO2?
The Hockey Stick is bunk?
There really was a Medieval Warm Period as warm or warmer than today? Without “Coal Trains of Death”? And when the closest Man came to using fossil fuel was throwing a dead branch on the fire?
IF Man’s CO2 is responsible for the “now”, what was responsible for the “then”?
If you don’t have a testable hypothesis for the “then”, you don’t one for the “now”.
Forrest, you did what Really Skeptical never did,complain about a word Kenneth never used, DEBUNK.
Here is the actual title of his post over at NTZ:
“400 Scientific Papers Published In 2017 Support A Skeptical Position On Climate Alarm”
This is why I attack RS so much. He claims to visit that site to read 15 abstracts, but never paid attention to Kenneth’s main thrust of the post. Didn’t read the title of the post.
It is why I posted this to RS this earlier:
“During the first 10 months of 2017, 400 scientific papers have been published that cast doubt on the position that anthropogenic CO2 emissions function as the climate’s fundamental control knob…or that otherwise question the efficacy of climate models or the related “consensus” positions commonly endorsed by policymakers and mainstream media.
These 400 new papers support the position that there are significant limitations and uncertainties inherent in our understanding of climate and climate changes. Climate science is not settled.”
RS ignored the central point that science is NOT settled,that there are a lot of papers supporting that the SUN is the main driver of climate,not CO2.
Read the rest of his misleading dishonest bilge. He is not being consistent or rational. It is clear that the SUN is the main driver,in many papers listed,is driving him crazy.
Well, sunny, you seem think I ignore your “look, a squirrel” papers, but keep ignoring the fact that your sun is not helping your position. It’s getting cooler in warming world. All the oceans and El Ninos (remember Bob Tisdale) in the world will not save a cooling sun.
I don’t think it is the sun, but just because it isn’t the sun doesn’t mean that CO2 drives anything. “CO2 rules” is NOT the simplest, null hypothesis.
Null hypothesis is “this thing is just chaotic and behave accordingly, so we cannot predict anything”.
The fun thing is, this is just math. You think it is wrong? fair enough, just provided a new chaoc theory that prove the present chaos theory wrong when it says this kind of problem are just intracatable.
Otherwise, just move on, adapt to whatever will happen (cooler or hotter), and give us a break.
+1
Sunset
“Didn’t read the title of the post.”
Did you read the title of this post:
Showing that one of the claims of the alarmists is nonsense is meaningless.
Unless a paper takes down the whole cathedral it’s meaningless.
Is that really the line you want to defend?
ReallySkeptical October 25, 2017 at 10:58 am
“Wow. I got bored after looking at the first 15 or so abstracts …”
So you made your decision by reading abstracts on 3.75% of the available literature. You have absolutely no intention of possibly learning something therefore you should be ignored from now on.
“So you made your decision by reading abstracts on 3.75% of the available literature. “
So how many did you read? And where did you find AGW debunked?
Nick,
AGW was born debunked.
Its leading proponent in the 1930s, Callendar, considered his hypothesis shown false by the extreme cold of the 1960s.
It should be obvious that man-made GHGs have had no discernible effect on average global temperature since earth cooled dramatically from the 1940s to ’70s under rising CO2. Then it accidentally warmed ever so slightly from 1977 (when the PDO flipped) until c. 1999 (a super El Nino year) while CO2 continued increasing. But after that global temperature stayed the same or cooled from 1999 until now, except for a spike due to another super El Nino, again despite continued growth in the highly beneficial, essential trace gas CO2.
Nick Stokes October 25, 2017 at 5:54 pm
“So how many did you read? And where did you find AGW debunked?”
I didn’t read any but I am not the one claiming there was no redeeming quality in all that literature after reading the abstracts of a tiny portion of what was available. In fact, my statement contained no opinion on whether the headline was correct or not. I was commenting on the closed mindedness of RS that was clearly showing.
Kudos to Kenneth Richard and the No Tricks Zone for his many epic broad-ranging compilation reports over the past 2-3 years. He’s convincingly shown in his compilations and comment section dialogue the very strongly substantive published skeptical differences with ‘consensus science’ by putting across the essence and context of several papers in making the singularly effective point that climate change is natural. Also, to regularly see his reports with so many new papers that independently reinforce my own research is always very heartening.
Griff and Co:-
When you see that someone has claimed that something is true, ask yourselves these three questions.
1. Who told them it is true?
2. How do THEY know that it is true?
3. What’s in it for them?
When you have honest answers to these questions, come and comment here.
The Team must be losing its grip. This would not have been tolerated in the ClimateGate era. I look forward to to seeing some papers that will demolish the basis of CAGW.
The CAGW feet of clay are starting to show visible cracks. I am hoping in my life time it will all come crashing down.
Because of thermalization, which spreads absorbed radiation among all atmospheric molecules, CO2, in spite of being IR active (aka a ghg), has no significant effect on climate. Water vapor, which is also IR active, has been increasing at 1.5% per decade, 8% since about 1960. This is twice as fast as it would by temperature increase of the ground level liquid water alone (engineering definition of feedback,).
Warming due to WV increase is countering the average global temperature decline which would otherwise be occurring as a result of low solar activity and the net of ocean cycles being in decline. The warming will eventually end because of increased cloud cover.
Trying to blame any one thing for climate change is a mistake. The cause of climate change is (roughly) shared equally by change in solar activity (natural), net effect of ocean cycles (natural) and water vapor increase (man made, 96% from irrigation)
Seriously, what constitutes a paper that supports CAGW or simply accepts it,
and what constitutes a paper that “debunks” CAGW or simply does not agree with it?
The difference is important and we (climate skeptics/warmists) should do a better job with this delineation than the Alarmists do.
IMHO
CAGW is political science, not genuine science seeking to understand how the climate and weather works.
The political part has latched onto “Man’s CO2” as a means to control Man.
That is what has been debunked.
Man’s CO2 is NOT the control knob for today’s weather.
Even if there was a testable hypothesis to say it was (there isn’t), how many years, decades, etc. would it take to qualify as a change in the climate for which Man is responsible?
Did any of those papers address what Claude Levi-Strauss called the poisoning of the planet, or what Meadows and Randers called overshoot and collapse?
DG,
The ‘weight-challenged’ lady hasn’t sung yet. So, Meadows and Randers could be right. There are many indications that societies are coming apart at the seams. Among the new problems are the phenomenon of mass killers committing suicide, the high rate of opioid overdose deaths, the widespread acceptance of the use of recreational drugs, a country (the USA) so polarized that it paralyzes legislative cooperation, endless sniping at a president that half the country doesn’t accept, an educational system that turns out students ill-prepared to enter the work force, students who demand certain words be forbidden (and legislatively codified in many European countries), and some political zealots calling for the incarceration of people who hold opinions different from what the MSM calls a consensus. These are only some of the signs of undesirable changes that could be attributed to overcrowding, and what seems to be a lack of a sense of purpose on both a social and personal level. These are trying times that we live in. One should ask what is different today from, say, the 1950s.
This is all pretty meaningless. 400 papers, and there’s no discussion of what they really say, and what it contradicts. I propose an experiment. Let’s choose just one at random, and see. How to generate a random number on a blog? If one person did it, there would be accusations of cherry picking. I invite people to propose a number between 50 and 150. I’ll add the first two that appear, and we can look at that paper in some detail.
THE SUN, Nick ! get off your Klimate Kool-Aide addiction and WAKE UP. !!
OK, I’ll take that as a 55. Any other offers?
You are being a flippant little twerp, Nick. Senility showing ?
There is NO CO2 warming signature in the satellite data.
There is no CO2 warming signature in sea level,
There is NO CO2 warming signature ANYWHERE.,
Solar.. THE SUN, Nick !
It is NOTED that Nick has NO COUNTER to these basic FACTS !!
There is NO CO2 warming signature in the satellite data.
There is no CO2 warming signature in sea level,
There is NO CO2 warming signature ANYWHERE.,
Solar.. THE SUN, Nick !
As usual Nick, you miss the main point of Kenneth’s post.
I’m always said to be missing the point. But what is the point of a list of 400 papers that no-one actually looks up to see what they say?
The ABSTRACTS often give you an idea what the papers are about.
Is this one too hard for you to understand?
“Li et al., 2017
Abstract
Our understanding on the spatial-temporal patterns of climatic variability over the last few millennia in the East Asian monsoon-dominated northern China (NC), and its role at a macro-scale in affecting the prosperity and depression of Chinese dynasties is limited. Quantitative high-resolution, regionally-synthesized palaeoclimatic reconstructions as well as simulations, and numerical analyses of their relationships with various fine-scale, numerical agro-ecological, social-economic, and geo-political historical records during the period of China’s history, are presented here for NC. We utilize pollen data together with climate modeling to reconstruct and simulate decadal- to centennial-scale variations in precipitation or temperature for NC during the last 2200 years (-200–2000 AD). We find an overall cyclic-pattern (wet/warm or dry/cold) in the precipitation and temperature anomalies on centennial- to millennial-scale that can be likely considered as a representative for the entire NC by comparison with other related climatic records. We suggest that solar activity may play a key role in driving the climatic fluctuations in NC during the last 22 centuries, with its quasi ∼100, 50, 23, or 22-year periodicity clearly identified in our climatic reconstructions. We employ variation partitioning and redundancy analysis to quantify the independent effects of climatic factors on accounting for the total variation of 17 fine-grained numerical Chinese historical records. We quantitatively illustrate that precipitation (67.4%) may have been more important than temperature (32.5%) in causing the overall agro-ecological and macro-geopolitical shifts in imperial China with NC as the central ruling region and an agricultural heartland over the last 2200 years.”
http://www.sciencedirect.com/science/article/pii/S027737911630381X
Well, I would have preferred a more clearly random choice. But OK, someone, using climate modelling, has found some periodicity in some climate records in N China. Quite a few ranges, but thinks they may be solar related. There have been plenty of papers finding various periodicities; it doesn’t contradict anything. I’d be a bit skeptical of the range of periodicities claimed.
I have looked at several of those papers , Nick
You obviously CANNOT bring yourself to do so, ..
.. because you KNOW that they will show that the slight beneficial warming has come from ANYTHING BUT CO2.
I see a flaw in my scheme. The papers aren’t numbered, so it’s pretty hard to search. So let’s settle for 55, which by my rough estimate (scroll-bar) is the paper of Dieng et al, 2017. The intro says:
” We can note that the correlation between GMST [global mean surface temperature] trends and AMO trends is quite high. It amounts 0.88 over the whole time span.”
So OK, is that contradicting standard theory? No-one doubts that there is correlation – is 0.88 unbelievably high? And does it mean anything. There is a later caim by notricks that this means AMO is driving GMST, but GMST is a large part of calculating AMO.
Here is the abstract of Dieng et al. How on earth is this said to be a skeptical paper?
“We investigate the global mean and regional change of sea surface and land surface temperature over 2003–2013, using a large number of different data sets, and compare with changes observed over the past few decades (starting in 1950). We find that over 2003–2013, both global land surface temperature and global sea surface temperature have increased at a rate significantly lower than over the previous decades. While confirming cooling of eastern tropical Pacific during the last decade as reported in several recent studies, our results show that the reduced rate of change of the 2003–2013 time span is a global phenomenon. GMST short-term trends since 1950 computed over successive 11-year windows with 1-year overlap show important decadal variability that highly correlates with 11-year trends of the Atlantic Multidecadal Oscillation index. The GMST 11-year trend distribution is well fitted by a Gaussian function, confirming an unforced origin related to internal climate variability. We evaluate the time derivative of full-depth ocean heat content to determine the planetary energy imbalance with different approaches: in situ measurements, ocean reanalysis and global sea level budget. For 2003–2013, it amounts to 0.5 +/− 0.1 W m−2, 0.68 +/− 0.1 W m−2 and 0.65 +/− 0.1 W m−2, respectively for the three approaches. Comparing with the Energy Balanced and Filled (EBAF) data of the Clouds and Earth’s Radiant Energy Systems (CERES) project, we find significant agreement at interannual scales. Finally, using 15-year averages of GMST and total ocean heat content rate, we compute the net radiative forcing since 1970 (this start date being constrained by availability of ocean temperature data). Although the uncertainty is quite large because of considerable errors in the climate sensitivity parameter, we find no evidence of decrease in net radiative forcing in the recent years, but rather an increase compared to the previous decades.”
Nick,was NOT able to find that paper on Kenneth’s list,
” Dieng et al.”
Please show which list you say it came from.
It came from the first page. I quoted the first sentences, you can search the list. Or just search for Dieng; there is only one.
This is the seventh one on the first list:
“Deng et al., 2017 The results indicate that the climate of the Medieval Climate Anomaly (MCA, AD 900–1300) was similar to that of the Current Warm Period (CWP, AD 1850–present), which contradicts previous studies. … As for the Little Ice Age (LIA, AD 1550–1850), the results from this study, together with previous data from the Makassar Strait, indicate a cold and wet period compared with the CWP and the MCA in the western Pacific. The cold LIA period agrees with the timing of the Maunder sunspot minimum and is therefore associated with low solar activity.”
http://notrickszone.com/skeptic-papers-2017-1/#sthash.HKMmjZbO.dpbs
Still can’t find your paper. I counted 55 still not there,went a lot further,still nothing.
“No-one doubts that there is correlation – is 0.88 unbelievably high?”
Nick, there is NO WARMING anywhere that is not directly affected by the AMO and PDO.
Didn’t you know that ???
Are you still that wilfully brain-washed?
They CANNOT have a measure of ocean heat content before 2003 and Argo.
The measurements are way too sparse. Probably are, even now.
“For 2003–2013, it amounts to 0.5 +/− 0.1 W m−2, 0.68 +/− 0.1 W m−2 and 0.65 +/− 0.1 W m−2, ”
So, an immeasurable change. Thanks Nick.
The global temperatures were essentially zero-trend over that period too.
That’s because there was not an El Nino energy release event.
Only slight atmospheric warming has come from those El Nino events..
… and not even you are brain-washed enough to say they are caused by human CO2, ..
or are you ?
“Still can’t find your paper. I counted 55 still not there,went a lot further,still nothing.”

WEll, I can’t see the difficulty; a Ctrl-F search for Dieng goes straight to it. But here is the screenshot:
Nick.
FINALLY you are starting to realise that it is SOLAR and OCEAN CYCLES that drive temperature.
We REALISTS have been saying this like….. FOREVER.
WAKE UP !!!
I thought I would just highlight a couple of things in this supposed skeptic paper of Dieng et al
Nick Stokes October 25, 2017 at 4:33 pm
“I thought I would just highlight a couple of things in this supposed skeptic paper of Dieng et al”
The first sentence of your highlight clearly states that internal variability controls GMST not the external forcing. Do you understand that means CO2 is not what’s controlling GMST? Removing internal variability to pretend the external forcing is in control is nonsense. What is controlling GMST is what is in control! That paper supports the idea that CO2 is not the control knob.
“The first sentence of your highlight clearly states that internal variability controls GMST not the external forcing.”
OK, here is the text leading up to that:
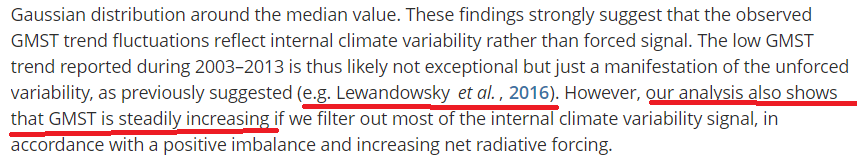
“Short-term trends in GMST computed since 1950 over successive 11-year windows (with 1-year overlap) display important interannual/decadal fluctuations, highly correlated with 11-year trends of the AMO index. The two trend curves are suggestive of a 60-year periodicity. Besides, the GMST 11-year trends follow a quasi-Gaussian distribution around the median value. These findings strongly suggest that the observed GMST trend fluctuations reflect internal climate variability rather than forced signal.”
They are specifically talking about short term trend fluctuations since 1950. No-one attributes those to CO2; CO2 didn’t have short-term fluctuations, just an exponential rise. But a key clue is the reference for support to Lewandowsky 2016. I wonder if Lew’s paper made the 2016 debunker’s list?
Again, they say “GMST is steadily increasing”. That isn’t the fluctuation they are talking about.
Nick Stokes October 25, 2017 at 6:07 pm
– “they say “GMST is steadily increasing”. ”
-Only in the case where they remove internal variability and replace that with “a positive imbalance and an increasing net radiative forcing.”
Their actual conclusion is this-
“We find that over 2003–2013, both global land surface temperature and global sea surface temperature have increased at a rate significantly lower than over the previous decades.”
This is in the face of what you call “an exponential rise” in CO2 levels. You have avoided the fact that the paper shows that internal variability dominates. The net increase in radiative forcing they found was not enough to overcome natural drivers. The paper belongs on the list because of this.
It is noted that Nick has absolutely ZERO counter for the basic facts
There is NO CO2 warming signature in the satellite data.
There is no CO2 warming signature in sea level,
There is NO CO2 warming signature ANYWHERE.,
Solar.. THE SUN, Nick !
CO2 warming of our convectively controlled atmosphere is a MYTH
An UNPROVEN SUPPOSITORY !!
Nick as u well know the answer is 42! I find your misdirection illuminating.
Cheers Russell
“Nick as u well know the answer is 42! “
Well, I didn’t, but thanks. I’ve figured how to count by clicking through occurrences of 2017 in the list. Paper 42 is Orme et al. It describes northerly movement of storm tracks in the N Atlantic, suggesting the cause is decreasing solar insolation in summer. Well, there is no dispute that the orbital cycle is having that effect in the later Holocene. But are they debunking AGW? The final sentence of their abstract says:
“Together this evidence now suggests that North Atlantic winter storm tracks may shift southward under future warming as sea-ice extent decreases and the mid- to high-latitude temperature gradient decreases, with storms increasingly affecting southern Europe.”
And that is debunking AGW? Where are these edebinking papers?
Nick,
To get published, authors have to genuflect toward CACA, the New Rome.
Such obeisance to the prevailing orthodoxy doesn’t mean that scientists actually buy the consensus crock.
“To get published, authors have to genuflect”
I don’t believe that. But what is the point of listing 400 papers which actually don’t debunk AGW, but with a claim that they would have if…
Nick,
If you don’t believe that, then, with all respect, you are either incredibly naive or inexperienced in the ways of academe and government.
And further, please list all of the 400 papers which you have concluded don’t debunk the bogus CACA consensus, and state why. Thanks!
Nick, in the Climategate emails: “the cause” and “the pause” were totally debunked — CO2 (deliberately mislabeled as “Carbon”) CAGW theory is a non-factor.
Anyone with half a brain and a rudimentary knowledge of the Scientific Method knows this.
“please list all of the 400 papers”
Well, I have listed some from the “no tricks” list, and they were random choices. I’m sure here are more. But the AR5 has listed a lot more.
Nick Stokes October 25, 2017 at 6:10 pm
Seriously, Nick, if you imagine that the papers cited here in some way don’t show the anti-scientific CACA consensus false, please say why in each case.
It should be obvious to the most casual observer that CACA is a crock, the most antihuman conspiracy ever hatched since the Cominterm.
“Seriously, Nick, if you imagine that the papers cited here in some way don’t show the anti-scientific CACA consensus false, please say why in each case.”
I did, in detail, for at least three. How about you or someone actually cite just one paper from this list that does debunk something, and if so, what and how?
Nick,
You’ve debunked nothing. That you imagine you’ve done so only shows how divorced from reality you are, which it the normal state for the CACA faithful.
But, OK. here’s my take on one of the papers cited. How can any rational person possibly imagine that “renewables” can replace fossil fuels? This cited paper quantifies that fact:
http://www.sciencedirect.com/science/article/pii/S0301421516301379
Gabro
“You’ve debunked nothing.”
It’s this list of papesr that is supposed to be debunking something. But no-one has shown what or where.
” How can any rational person possibly imagine that “renewables” can replace fossil fuels? This cited paper quantifies that fact:”
No, it doesn’t. The paper is titled:
“Energy Return on Energy Invested (ERoEI) for photovoltaic solar systems in regions of moderate insolation”
and more specifically, Switzerland and Germany. Now the economics of PV are in no way a foundation of AGW theory, and few would dispute that there are places where PV solar is not currently economic. But again, the paper ends with:
“Research and development should however, be continued in order in future to have more efficient conversion from sunlight to electricity and a cheaper, more reliable PV-technology offering increased efficiency and a longer, failure-free lifetime. The market will then develop naturally.”
Nick,
Yet again making my point that even counter-alarmist papers, in order to get published, must bow and make obeisance to the consensus orthodoxy.
Papers PROVE it is the SUN and oceans causing the slight warming, NIck
That DISPROVES anything but a totally insignificant warming by CO2
There is NO CO2 warming signature in the satellite data.
There is no CO2 warming signature in sea level,
There is NO CO2 warming signature ANYWHERE.,
Solar.. THE SUN, Nick !
“Solar.. THE SUN, Nick !”
Have you put that to Leif Svalgaard?
Why would I bother ? The guy is stuck in a world of his own making.
Lief had his “meme” that it couldn’t be the sun..
So he blustered and bullied to get the sunspot series flattened.
Remind you of any other “adjustments”……
….. like the removal of the 1940’s blip?
“Why would I bother ? The guy is stuck in a world of his own making.”
And you’re not?
He does, you know, observe the Sun and tests theories against those observations.
And what do you do?
You just ‘believe’ it’s the Sun.
To my mind that makes you the one ‘stuck’.
You don’t ask because as one of the world’s foremost Solar experts he will tell you it is not.
There is NO CO2 warming signature in the satellite data.
There is no CO2 warming signature in sea level,
There is NO CO2 warming signature ANYWHERE.,
Solar.. THE SUN, Get over it ,
Now off you grovel, Toneb……
…. lick Leif’s feet clean.
I would far rather trust Usoskin or others…
…..than someone you deliberately sets out to tamper with the solar history data to fit his own needs.
My attempt to lighten the mood and give you a number, 42 which was not in your range, but is the answer to everything according to Deep Thought, Adams anyone, failed baddly. I see that 55 was put up, I can’t find a paper at (55+42)/2.
Don’t let them get you down, those nasty deplorables can be so mean.
Just an aside I thank co2 should be at 800 ppm, I like plants.
Have you read them all already?
Really Skeptical sure doesn’t understand what is going on since the moron fails to see the obvious.
He writes,
” reallyskeptical
October 25, 2017 at 2:54 pm Edit
Well, sunny, you seem think I ignore your “look, a squirrel” papers, but keep ignoring the fact that your sun is not helping your position. It’s getting cooler in warming world. All the oceans and El Ninos (remember Bob Tisdale) in the world will not save a cooling sun.”
You have YET to acknowledge that Kenneth’s main point is that there are a lot of recent science papers published that do NOT support the AGW conjecture They look at other drivers,Sun being one they say has a significant to dominant effect of the climate.
Meanwhile it is warmists like you,who keeps ignoring the fact that the IPCC since 1990,push the .30C PER DECADE warming prediction,which never happens:
RSS shows about HALF that rate,which means CO2 couldn’t be the main driver ,since so much CO2 effect isn’t showing up in the Satellite data. This is why the science CAN’T be settled,there are other drivers deserving attention,which apparently bothers you so much, as you fight against the 99.99% source of incoming energy in the system.
since 1990
http://www.woodfortrees.org/graph/rss/from:1990/mean:12/plot/rss/from:1990/trend
since 2001
http://www.woodfortrees.org/graph/rss/from:2001/mean:12/plot/rss/from:2001/trend
The warming rate is slowly declining.
Stop fighting it,RS!
“the sun has been shining less since about 1950. Not much less, but less. But we have been warming since then. So hard to use a cooling sun to cause more warming.”
… unless you know what solar activity level is sufficient for warming and for how long.
Also this.
https://ssrn.com/abstract=3000932
Without the alleged correlation between emissions AGW falls apart.
If there have been 400 dissenting papers in the first ten months of 2017, then by projection there will be 480 for the whole year. It is stated there were 500 in 2016. So output of dissenting papers has declined by 20 in just one year, an annual decline of 4 percent. Help! (Please tell me most of these journals are quarterly and tend to appear at the end of each quarter.)
There is no scientific consensus regarding the AGW conjecture. Scientists never registered and voted on the issue. Even if there were it would be meaningless because science is not a democracy, The laws of science are not some sort of legialation. Scientific theories are not validated through a voting process.
It does not matter how many papers are for or against the AGW conjecture. It is more a matter of what is in the papers that really matters.
The AGW conjecture depends upon the existance of a radiant greenhouse effect caused by trace gases in the Earth’s atmosphere with LWIR absorption bands. A real greenhouse does not stay warm because of a radiant greenhouse effect caused by heat trapping gases with LWIR absorption bands. A real greenhouse stays warm because the glass limits cooling by convection. There is no raadiant greenhouse effect that keeps a greenhouse warm. It is entirely a convective greenhouse effect. So too on Earth. The warming effect of the atmosphere is caused by a convective greenhouse provided for by the heat capacity of the atmosphere, the depth of the troposphere and gravity. As derived from first principals, the Earth’s convective greenhouse keeps the surface of the Earth 33 degrees C warmer than if there were no convective greenhouse effect. 33 degrees C is the amount derived from first princpals and 33 degrees C is heat has been measured. Additional warming caused by a radiant greenhouse effect has not been observed. The rediant greenhouse effect has not been observed anywhere in the solar system. The radiant greenhouse effect is science fiction, hence the AGW conjecture is science fiction. The AGW conjecture is based on only partial science and cannot be defended.
+10
The list is meant to be a compilation of papers that support positions that skeptics of the “consensus” often maintain, which can be mostly whittled down to:
(1) a significant portion of climate changes are natural;
(2) the consequences of burning fossil fuels are likely not dangerous or even climatically/geologically consequential;
(3) the models are not reliable, as uncertainty is enormous in a multi-faceted, non-linear climate system; and
(4) the warming/sea levels/glacier retreat/hurricane and drought intensities…experienced during the modern era are neither unprecedented or remarkable.
These positions are not supported by the “consensus”. Quite the opposite. According to the “consensus” (as gleaned from consistently reading websites like SkepticalScience and RealClimate):
(1) Close to or over 100% (RealClimate claims ~110%) of climate change is anthropogenic, leaving natural attribution at something close to 0%.
(2) Modern warming, glacier and sea ice recession, sea level rise, drought and hurricane intensities…are all occurring at unprecedentedly high and rapid levels, and the effects are globally synchronous…and thus dangerous consequences to the biosphere and human civilizations loom.
(3) The climate models are reliable and accurate, and the scientific understanding of the effects of CO2 concentration changes on climate changes is “settled enough” (Slate), which means that “the debate is over” (SkepticalScience).
(4) The proposed solutions to mitigate the dangerous consequences described in (2) – namely, wind and solar expansion – are safe, effective, and environmentally-friendly.
The papers support the first (1)-(4) positions, and they undermine (“debunk” is too strong) the second set of (1)-(4) positions. The papers do not do more than that. Expectations that they should do more than support skeptical positions and undermine “consensus” positions to “count” as a tally for skepticism (whatever that might mean) are disingenuous.
———————————————————————
If we were to look at the papers that Cook et al. (2013) used to concoct the 97% “consensus” paper, for example, we’d find that Cook and his co-horts actually classified papers (and magazine articles) about cooking stoves in Brazil, phone surveys, asthma-related ER visits in Montreal, TV coverage…as “endorsing” the position that most of the global warming occurring since ~1950 has been human-caused. Really.
http://www.joseduarte.com/blog/cooking-stove-use-housing-associations-white-males-and-the-97
“The Cook et al. (2013) 97% paper included a bunch of psychology studies, marketing papers, and surveys of the general public as scientific endorsement of anthropogenic climate change.”
Why don’t we just go back to basics . The longest continuous temperature records in the world from 1880 to present are in Geneva and St Peters burgh and they show absolutely no warming and they also show that the 1930s were warmer than since 2000 this century . Argue against that . The AWG theory depends on there being no MWP medieval warm period and that has been removed from the climate record yet how did the Vikings farm in Greenland 1000 years ago .The temperature records have been tampered with to fit a theory and the urban heat island effect has not been taken into consideration when measuring temperatures in towns and cities.
So many so called scientists just look at the temperature record supposedly rising and the CO2 rising and then agree that AWG is proven .
“These positions are not supported by the “consensus”. Quite the opposite. According to the “consensus” (as gleaned from consistently reading websites like SkepticalScience and RealClimate):”
That’s the problem here. You say that they contradict impressions that you have picked up from SkS and RealClimate. Well, they might, but that doesn’t mean anything until you clearly show:
1. What the papers say that you claim contradicts
2. What is contradicted. Not just an impression, but an actual statement from someone, with quotes, so we can see what is actually said.
That is is lacking with a lot of skeptic arguments. They just don’t match up. To take just the first item on your list:
(1) a significant portion of climate changes are natural;
(1′) Close to or over 100% (RealClimate claims ~110%) of climate change is anthropogenic, leaving natural attribution at something close to 0%.
In fact (1) does not contradict any consensus. No-one denies there have been plenty of changes before 1750. And (1′) does not assert anything to the contrary. The actual statement (AR5 SPM) is
“It is extremely likely that more than half of the observed increase in global average surface temperature from 1951 to 2010 was caused by the anthropogenic increase in greenhouse gas concentrations and other anthropogenic forcings together. The best estimate of the human-induced contribution to warming is similar to the observed warming over this period. {10.3} “
That is a statement of net effect over a specific period. It doesn’t say there was no natural change. In fact it says that up to 50% of the observed change could have been attributed to natural change. But even for their best estimate, it doesn’t mean there was no natural change. It means that when you add up the natural changes in that period, the total may have been zero. That can’t be disproved by someone finding net change in some other period.
Nick,
According to Gavin Schmidt at RealClimate.org, whom I would assume you would agree is a purveyor of “consensus” climate science, claims that the IPCC has endorsed the position that 100% of climate changes since 1950 can be attributed to human activity/CO2 concentration increases, leaving 0% of climate change attribution to natural factors.
http://www.realclimate.org/index.php/archives/2014/08/ipcc-attribution-statements-redux-a-response-to-judith-curry/
“The best estimate of the warming due to anthropogenic forcings (ANT) is the orange bar (noting the 1𝛔 uncertainties). Reading off the graph, it is 0.7±0.2ºC (5-95%) with the observed warming 0.65±0.06 (5-95%). The attribution then follows as having a mean of ~110%, with a 5-95% range of 80–130%. This easily justifies the IPCC claims of having a mean near 100%, and a very low likelihood of the attribution being less than 50% (p < 0.0001!)."
The first half of the papers on the list do not support the Schmidt/IPCC position that 100% (or 110%) of climate changes are due to CO2 concentration increases or human activity. They assert that natural factors exert a significant influence on climate. This contradicts the “consensus” position as stated by Schmidt/IPCC.
Similarly, the IPCC has endorsed the position that modern warmth is unprecedented for at least the last few millennia. The Panel has also maintained that modern warming has been linear and globally synchronous, and not just regional or oscillatory…in line with the trends in anthropogenic CO2 emissions. There are over 120 graphs and 90 papers published in 2017 that do not support the IPCC position that temperatures across the globe have risen and fallen in correlation with CO2 concentrations. Quite the opposite, actually. Most show that modern warmth is still colder than it has been for most of the last 10,000 years.
Update: The 2017 Explosion of Non-Hockey Stick Graphs Continues
http://notrickszone.com/2017/09/28/update-the-2017-explosion-of-non-hockey-stick-graphs-continues/
And those are just two of the main “consensus” positions: Warming is global and due to anthropogenic forcing. Other commonly-known “consensus” positions about extreme weather events, model reliability, sea level rise and glacier melt…also do not find support here. Going through each one, one-by-one, would be gratuitous.
Did you read the link provided regarding the cooking stove/asthma/TV show papers that Cook et al. (2013) categorized as “endorsing” the position that close to 100% of climate change since 1950 is due to human activity/CO2 concentration increases?
http://www.joseduarte.com/blog/cooking-stove-use-housing-associations-white-males-and-the-97
These are papers that would appear to have almost nothing to do with the IPCC 100% human attribution “consensus” statement were counted as endorsing that “consensus” statement anyway. Do you have a problem with that? Or do you only have a problem with papers that say….
“The emerging causal effects from SS [solar activity] to GT [global temperatures], especially for recent decades, are overwhelmingly proved” – Huang et al., 2017
“Climate … follows SA [solar activity] fluctuations on multidecadal to centennial time scales” – Moreno et al., 2017
“The solar ‘activity’ increase is the chief driver of the global temperature increase since the LIA [Little Ice Age]” – Page, 2017
“A large proportion of climate variations can be explained by the mechanism of action of TSI [total solar irradiance] and cosmic rays (CRs) on the state of the lower atmosphere and other meteorological parameters” – Biktash, 2017
“The activity level of the Modern Maximum (1940–2000) is a relatively rare event, with the previous similarly high levels of solar activity observed 4 and 8 millennia ago” – Yndestad and Solheim, 2017
“The main driver of the large-scale character of the warm and cold episodes may be changes in the solar activity. Four warm periods – 1626–1637, 1800–1809, 1845– 1859, and 1986–2012 – have been identified to correspond to increased solar activity” – Tejedor et al., 2017
…because they aren’t sufficient endorsements of the main skeptical positions identified above?
Now that probably explains why I find some of the CAGW arguments strange, I didn’t realize that was the consensus that the change was 100% man made. Personally I don’t accept that and would go for a percentage probably up to 50% which strangely is what the paper Nick was talking about says.
I guess I need to work out where Nick sits, so 100% man made for you Nick?.
Kenneth,
“The first half of the papers on the list do not support the Schmidt/IPCC position that 100% (or 110%) of climate changes are due to CO2 concentration increases or human activity.”
This is where your claims are just far too sweeping and non-specific, and don’t match up. AFAICS, none of those papers are about the period 1950-2010. GS wasn’t talking about “climate changes” in general. And in any case, the papers I looked at in detail above don’t “not support” anything like that, even for some other period.
Another statement from Gavin in that article is:

““Detection” is (like attribution) a model-based exercise, starting from the idea that one can estimate the result of a counterfactual: what would the temperature have done in the absence of the drivers compared to what it would do if they were included? GCM results show clearly that the expected anthropogenic signal would start to be detectable (“come out of the noise”) sometime after 1980”
And that is what is going on here. It isn’t that the “noise” (natural variation) stopped post 1950, or even reduced. It is that the AGW component increased. Natural variation can be warming or cooling. In the attribution, they model what would have happened with GHG increase, and without. The plot your quote refers to is here:
basically, the dotted line is the expected AGW warming (fraction), and the bell is the uncertainty in the natural variation, which could of course be positive or negative. Gavin is saying that the net natural was probably a bit negative (-10%), but could have been -50%. He’s certainly not saying that natural variation doesn’t exist. Nor that it could have been quite different in other times. That is why your papers just don’t connect.
“Similarly, the IPCC has endorsed the position that modern warmth is unprecedented for at least the last few millennia. The Panel has also maintained that modern warming has been linear and globally synchronous, and not just regional or oscillatory…in line with the trends in anthropogenic CO2 emissions. There are over 120 graphs and 90 papers published in 2017 that do not support the IPCC position that temperatures across the globe have risen and fallen in correlation with CO2 concentrations. “
No they don’t, which shows the importance of quoting. They say, for example (AR5 SPM B.1)
“Continental-scale surface temperature reconstructions show, with high confidence, multi-decadal periods during the Medieval Climate Anomaly (year 950 to 1250) that were in some regions as warm as in the late 20th century. These regional warm periods did not occur as coherently across regions as the warming in the late 20th century (high confidence). {5.5}”
They don’t say, unprecedented for the last few millennia. They say
“For average annual NH temperatures, the period 1983–2012 was very likely the warmest 30-year period of the last 800 years (high confidence) and likely the warmest 30-year period of the last 1400 years (medium confidence).”
LdB
“I guess I need to work out where Nick sits, so 100% man made for you Nick?.”
The problem with % is that people tend to think of it as a set of positive numbers that have to add to 100%, so if manmade is 100%, that means no natural variation. But it doesn’t, as you can see from Gavin’s estimate of man-made at 110%. It’s clearer if you just say that observed is 100 units. Then man-made is estimated (from modelling, mainly) to be 110 units, and natural to add up to -10 units over the time. But it might have added to +50 (so manmade is 60) or even -50 (so manmade is 160 units).
I have no separate opinion; the scientists have worked it out as stated, and that is better than any hunch I might have.
IIPCC make it very obvious that they DO NOT DO SCIENCE
Why are you CONTINUALLY calling up the POLITICAL rantings of AR5 , Nick
They are irrelevant in any scientific discussion
“I have no separate opinion;”
Yes, we all know that you are a brain-washed AGW parrot.!!
Then you haven’t looked, Nick. I could take the time to reference each and every one of the papers that refer to the modern era…or that attribute warming and cooling periods to changes in solar activity. But that would be a waste of time, I see, in your case. You do not appear to be the least bit open-minded or interested in learning about that which you do not already agree. So I refuse to engage you on this.
http://www.joseduarte.com/blog/cooking-stove-use-housing-associations-white-males-and-the-97
Please go through each and every one of the papers on this list of “endorsers” of the 97% “consensus” used for the Cook paper, Nick. See if these papers and magazine articles meet the specific qualifications you identified as necessary for the 97% classification. I notice that I have invited you to comment on this analysis twice now, and each time you have ignored the invitation. Why is that? Do you agree that those papers should not have been used to qualify as “endorsing” the IPCC “consensus” statement? Or do you have different criteria for endorsement due to bias?
You claim: “In fact it [IPCC] says that up to 50% of the observed change could have been attributed to natural change.”
According to RealClimate.org, the IPCC position on the post-1950 anthropogenic attribution has a mean of “near 100%”, while the chance of the warming being up to 50% natural since 1950 is <0.0001%. Apparently you disagree with the RealClimate.org/IPCC interpretation of ~100% attribution. That just means you don't agree with the interpretation of the "consensus" statement as espoused by the "consensus" gatekeepers. Your disagreement doesn't make that 100% attribution interpretation go away. It's the RealClimate.org/IPCC interpretation that the compiled list of hundreds of papers is claimed to undermine. Not yours.
As for my statement that the IPCC endorses the position that modern warmth is globally synchronous and unprecedented on a millennial scale:
“Warming of the climate system is unequivocal, and since the 1950s, many of the observed changes are unprecedented over decades to millennia.”
I used the word “millennia” and “unprecedented” to refer to the warming since 1950 precisely because the IPCC used those words. Considering the IPCC is assumed to be the gatekeeper of “consensus” climate science, and since ~100 of the papers on the list may contradict this “consensus” position, it is my contention that these papers can be classified as supporting a skeptical position on climate alarm, or unprecedented global warming due to human activity.
If you don’t agree, then I can live with that.
If you represent a typical climate scientist Nick S then climate science is in a world of trouble and has trouble explaining itself.
So what you are talking about then is DELTA CHANGE PERCENTAGE or perhaps RELATIVE CHANGE PERCENTAGE I am still not sure which you or in Gavin’s example he is using.
So we have a relative percentage against some moving baseline rather than stay with absolutes .. okay got that. So is the baseline a rolling average, a baseline produced by models or a line mickey mouse just draws on the graph?
If you gave a growth figure I might have expected a RELATIVE PERCENTAGE but you are talking attributions to a group which one would assume is an absolute figure.
Kenneth,
“Then you haven’t looked, Nick. I could take the time to reference each and every one of the papers that refer to the modern era…”
You keep moving the pea. The IPCC (and Gavin’s) statement was about a specific period, 1950-2010, in which natural variation balanced out to about zero trend. It wasn’t about the “modern era”.
“I notice that I have invited you to comment on this analysis twice now, and each time you have ignored the invitation. Why is that? “
Because it’s a classic “look over there” device. The topic is the list you have put up. But FWIW, I am not a fan of the consensus papers classification either. I am surprised that you use it as a model.
“As for my statement that the IPCC endorses the position that modern warmth is globally synchronous and unprecedented on a millennial scale:”
The quote is the intro to section B.1., headed “Observed Changes in the Climate System”. The full quote is:
“Warming of the climate system is unequivocal, and since the 1950s, many of the observed changes are unprecedented over decades to millennia. The atmosphere and ocean have warmed, the amounts of snow and ice have diminished, sea level has risen, and the concentrations of greenhouse gases have increased”
Then follow the sections named there, each with a timescale. Atmosphere was what I quoted:
“Each of the last three decades has been successively warmer at the Earth’s surface than any preceding decade since 1850 (see Figure SPM.1). In the Northern Hemisphere, 1983–2012 was likely the warmest 30-year period of the last 1400 years (medium confidence). “
Each section has a different scale, from decades to millennia. Cryosphere is a few decades. Sea level rise is two millennia; CO2 is 800. That is what is going on here; you don’t seem to care what you are matching up to what. There is a specific statement about atmospheric temperature.
“If you don’t agree, then I can live with that.”
Quite so. And you’ll have supporters here who won’t care about what it is that is being debunked, by whom and how. But there are real skeptics out there who will want to know. And if you can’t tell them, your lists will continue to be widely ignored as they have been till now.
LdB,
I’m not a typical climate scientist; in fact, I’m not a climate scientist at all.
“So what you are talking about then is DELTA CHANGE PERCENTAGE or perhaps RELATIVE CHANGE PERCENTAGE I am still not sure which you or in Gavin’s example he is using.”
The IPCC statement was quite clear, and made no reference to percentage. It referred to Fig 10.4, in which the changes are given in absolute terms, with the change being 0.6°C.
Gavin was responding to a post by Judith Curry, which she phrased in percentages. He used that too. But they are just relative to that 0.6°C rise.
Nick S I also need to ask then the way you guys use percentages. So is the 97% science consensus absolute, relative, differential or something else ???? Just wondering if I should be expecting to one day see a 110% consensus.
So if the IPCC report is absolute value of 0.6C what number do they say is man made … it can only be a number between 0 and 0.6. I would go and read it myself but I will probably assume something to be absolute when it is relative etc because there doesn’t seem to be any logic under what is being used.
LdB,
Well, Here’s the IPCC statement again
“It is extremely likely that more than half of the observed increase in global average surface temperature from 1951 to 2010 was caused by the anthropogenic increase in greenhouse gas concentrations and other anthropogenic forcings together. The best estimate of the human-induced contribution to warming is similar to the observed warming over this period. {10.3}”
They are saying that of the 0.6°C, at least 0.3 was anthro, and their best estimate was 0.6. Unlike papers, the trend contributions could be positive or negative, so there’s nothing to stop 0.7 anthro, -0.1 natural, say.
Natural variation has been going on for hundreds of millions of years. That means it is about equally likely to be warming or cooling in any specific period. It seems 1950-2010 probably came out around zero.
No sorry Nick S that would be wrong you would expect a number of high frequency year to year oscillations decaying into a one or more slow moving oscillations because of the thermal inertia. Even in 1920’s Milutin Milankovic was smart enough to work that out. I don’t believe anyone has conclusively calculated all the cycles but it’s not an area of science that interests me there are far too many quacks operating in that area.
However I am familiar with the LIGO data which has all the various geometric wobbles of Earth and they exhibit similar behaviour.
So I would actually expect a slow moving oscillating baseline with a high frequency year to year oscillation sitting on it. Finally then I would expect if man was having an effect a signal on top of that again.
“It is extremely likely that more than half of the observed increase in global average surface temperature from 1951 to 2010 was caused by the anthropogenic increase in greenhouse gas concentrations and other anthropogenic forcings together. The best estimate of the human-induced contribution to warming is similar to the observed warming over this period. ”
Which translate into
“The best estimate of Nature’s contribution to warming from 1951 to 2010 is zero. It is extremely likely they it account for less than half of the observed warming”
The truth, is, NO ONE is able to compute Nature’s contribution to warming, because we don’t no sh!t about the way it works nor its initial (1950) state, and actually, since it is known to be a chaotic system, even if we knew precisely the way it works (like the double-pendulum) and its initial state, we still wouldn’t be able to calculate final state, not even as a probability.
But the IPCC say that can and has be done, nonetheless. How ? By calculating Nature contribution effect as the difference between observed temperature and some calculated effect of human hand.
which translate this way:
suppose you drive a car on a non flat road in changing wind condition, and your son on the back open his window and plays waving his hand in the airflow, obviously slowing the car.
What the climate scientist aside you son do ? calculate the slowing effect of your son’s hand by using a very precise model of the hand interaction with airflow, discard the hypothesis that the wind has some effect on the car, and assign the residue of changing speed to road slope effect.
And they call that “science” …
Stop feeding the pigeon.
Why are the polar ice caps melting and shrinking in size? Is this “normal?”
The records of polar ice were really inadequate before WWII, and only fairly good since satellites were used, starting in the early 1960’s.Most of the reporting in charts and such start with really good data in the late 1970’s.
The inadequate data from the 1920’s and 1930’s suggest fairly low ice cover in the Arctic. As the increasing amount of data on polar ice coincided with a cold spell, ,and good data coincided with a warming spell, so anyone who is sure they know what is going on is blowing smoke. It could very well be cyclical, but we have good data on only part of one cycle.
That is not the case…
There are good and extensive records going back into the 19th century, which have now been collated back to 1850.
Records show that we now have lower sea ice extent at minimum than in the low point of the 1940s.
Most of the pre-satellite ice extent maps have a great deal of infill, i.e. imaginary ice in areas with no data. As this is just like GISS and HADCRUT surface temperature “records” Griff should find these imaginary records comforting.
Griff, try consulting Tony Heller’s site for print reports of ice prior to satellite mapping. He is a bit strident, but the Grauniad is the same way, only on the other side, and you tolerate that.
Rich,
Arctic sea ice levels are currently in the top DECILE of extent for the current inter-glacial.
That means that they are actually ANOMALOUSLY HIGH.
The late 1970s was actually an EXTREME peak, up there with the extent of the Little Ice Age.
A period that only a very silly or ignorant person would want to go back to.

And REAL , UN-ADJUSTED temperatures to go with it.

Biodata from around the Arctic was collated this year by Stein, 2017.
This biodata clearly shows that current levels of Arctic sea ice are very much at the HIGH end for the last 10,000 years.

From: https://judithcurry.com/2017/08/16/what-do-we-know-about-arctic-sea-ice-trends

Tone,
Arctic sea ice extent has remained the same on average for 11 years now. Since its record low in 2012, it has increased. This was the first year since the dedicated satellite record began in 1979 in which no new record was set within five years.
Thus Arctic sea ice declined from 1979 to 2012, but has grown since then. As is only to be expected, given its natural fluctuations.
Gabro:
I was actually just interested the idea that Arctic sea-ice was low in the 40’s, but also just noticed the “… late 1970’s’was an extreme peak”.
These 3 studies do not support either contentionwith the ’40’s omtradicting each other.
Also it seems the Iceland Sea-ice index was constructed via observation from land.
So I don’t think we can call it a reliable index for the Arctic as a whole.
https://www.dmi.dk/fileadmin/Rapporter/SR/sr05-02.pdf
“The method used by Koch in 1945 to construct his ice index is in fact not known – the details given in Koch’s publication are not sufficient to understand how the index was constructed. However, Wallevik and Sigurjónsson have probably figured out what Koch did. By testing several algorithms on Koch’s original data they have reconstructed almost exactly the index, as published by Koch for the period 1880 to 1939. They have also extended the index using newer data and the likely Koch algorithm, so that the homogeneous index is now available from 1100 to 1990, using work detailed”
“The East Greenland sea-ice has occasionally been observed close to the coast of Iceland. Reports of ice occurrence at Iceland dating back to the early colonisation were collected by several Icelandic authors and summarised by Koch (1945 and references therein) in the form of two time series, i.e. the annual number of weeks with ice observed from land and an index defined as the annual number of weeks weighted according to the maximal extension of the ice along the coast.”
Toneb, here is a published science paper showing that the Arctic sea ice has a clear cyclic pattern:
On assessment of the relationship between changes of sea ice extent and climate in the Arctic
http://notrickszone.com/wp-content/uploads/2017/10/Arctic-Sea-Ice-Extent-September-Alekseev-2016.jpg
http://onlinelibrary.wiley.com/doi/10.1002/joc.4550/full
Arctic sea ice is STILL in the top decile of extent of the last 10,000 years,
Just fractionally down from the EXTREMES of the :LIA and late 1970.s
Face the FACTS, Toneb.. you are starting to look VERY stupid.
The Walsh/Connolly stuff is using incomplete cherry picked data.
Russian data has since come to light, as has DOE data, showing a strong dip during the 1950s, 60s.
Plenty of evidence that it was NOT as extreme during that period.
The DIP can be clearly seen on the Icelandic data, one of the few areas that sea can actually extent itself

Deny real data.. Its what you do.
Toneb October 26, 2017 at 12:12 pm
Arctic sea ice has been lower than now for most of the Holocene. Present level is nothing the least bit out of the ordinary.
But lower is definitely better for people and even polar bears, which can take or leave floating sea ice in summer, but do need land fast ice in the spring, where they find ringed seal snow lairs to break the mama bears’ long winter fast.
“Deny real data.. Its what you do.”
Nope, just saying that the Iceland sea ice index is one of observation from land and in no way of the Arctic as a whole.
Again, from the DMI…
“…. summarised by Koch (1945 and references therein) in the form of two time series, i.e. the annual number of weeks with ice observed from land and an index defined as the annual number of weeks weighted according to the maximal extension of the ice along the coast.”
Do you say different?
“The DIP can be clearly seen on the Icelandic data…”
Indeed it can, but as The DMI say, it is not an index for the Arctic, just how much ice can be seen by eye from Iceland.
The seas around there are particularly subject to the vagaries of the NAO and the NAD. That extends towards the E Arctic seas but the rest of the Arctic basin is free of those effects.
And the data I have posted is real data.
Here is some more….
https://www.cambridge.org/core/services/aop-cambridge-core/content/view/EB43308A2CA1015C4B8B1D3D0B5C4761/S0260305500264513a.pdf/div-class-title-20th-century-sea-ice-variations-from-observational-data-div.pdf
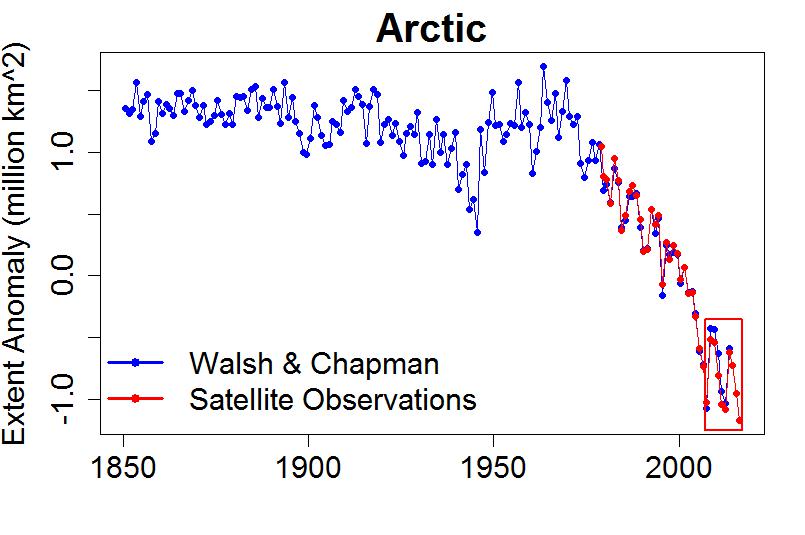
Actual DOE data , mindless Tone-drone
Not some manically biased reconstruction by AGW apostles.

And Actual raw ie REAL, UN-ADJUSTED temperature data to go with the DIP IN ARCTIC SEA ICE during the 1940’s and the EXTREME of the late 1970s.

And one the AGW priests on the growth of Arctic sea ice in the mid-late 1970s

So funny when these AGW arctic sea ice FABRICATION leave out data and REALITY in their DENIAL of the truth.
“And one the AGW priests on the growth of Arctic sea ice in the mid-late 1970s”
You’re not much good at reading, Andy. There is nothing there about sea ice.
Read the last sentence in red shading, you ignorant twerp
You really are getting DESPERATE in your child-minded distracting, aren’t you Nick.
“Read the last sentence in red shading”
I’ll even transcribe it.
“Areas of Baffin Island in the Canadian Arctic, for example, were once totally free of snow in summer; now they are covered year round.”
Baffin Island is quite mountainous, and is not under water.
Nick is making a habit of being embarrassingly wrong. Baffin Island is only given as an example. The ice and snow cover studies referred to by Kukla clearly incorporates sea ice. See here for example: https://climate.rutgers.edu/stateclim_v1/robinson_pubs/non_refereed/Kukla_and_Robinson_1981_accuracy.pdf
Perhaps he will be more careful in future.
” embarrassingly wrong”
It was Andy who was embarrassingly wrong, and insulting to boot. The sentence about Baffin was his choice, not mine. I said there was nothing in the 1974 article about sea ice. I didn’t say that Kukla never ever wrote about sea ice. The article you cite is from 1981.
Nick,
You don’t do your already strained reputation for honesty and integrity any good with this type of response. Andy was right and you are wrong. The sentence before the Baffin example says: “…they found that the area of the ice and snow cover had suddenly increased by 12% in 1971…” Are you somehow claiming that this reference to “ice and snow cover” does not include sea ice? The 1981 article I quoted made it clear that ice and snow cover charts include sea ice. Do you have any evidence to suggest otherwise?
“Andy was right and you are wrong. “
So where does it say that sea ice has grown?
Nick Stokes October 27, 2017 at 2:54 am
Sea ice is mentioned in the same shaded paragraph. It mentions the persistence and thickness of pack ice around Iceland.
Nick,
To repeat my question: Are you somehow claiming that the reference to “ice and snow cover” does not include sea ice? (I now see why McIntyre calls you Racehorse Haynes).
Gabro,
“Sea ice is mentioned in the same shaded paragraph. “
Well, it’s not in the shaded part, but yes, it is mentioned. But I don’t see how any part of this could show the growth of Arctic sea ice, as asserted. Even if Kukla included arctic sea ice in his measure, and I doubt that there was useful satellite data in 1974, it would be a small component relative to land ice and snow.
Nick,
There is satellite data from the 1960s onward, just not from a dedicated satellite. Even after 1979, it took a while to learn how to distinguish meltwater atop sea ice from open seawater, so there were issues of interpretation.
But by the 1970s, there was continuous satellite coverage from spacecraft designed for other purposes.
Despite the generally cold climate of the ’40s to ’70s, there were some years in the 1970s as low as those after 1979. But sea ice peaked in the 1977-79 interval, probably at its highest for the century, except possibly for the 1910s, which also came at the end of a cooling cycle.
Let’s recall that Nick said “…there was nothing in the 1974 article about sea ice”. Nothing. About sea ice.
And he has the chutzpah to accuse others of moving the pea.
Griff posted “And this is meaningless unless we know how many support the accepted science” and spawned literally thousands of words in response (many abusive). Extremely efficient. Nick Stokes and reallySkeptical were less efficient and resorted to sparing matches with their opponents. The overwhelming number of comments on this thread are responses to these three people (if they are individuals and not. consortia). You’ve been neatly and efficiently sidetracked from perhaps what you might have more profitably done – consider the proportion of climate science papers published over the past 10 months the 400 papers actually represents? What is their quality? Is there a standout paper that needs more exposure? Have any evoked responses yet? Are any of especial merit? And so on. Instead you’ve been distracted by three provocateurs. Their job was well done, Griff especially.
I’m not a consortia.
and I think my point still stands.
400 out of 4 thousand is different from 400 out of 400 million (to use absurd extremes as an example)
also, the papers listed very largely describe the climate drivers influencing past climate at particular periods pre 19th century.
Those papers do not preclude a new and additional climate driver coming into play on top of other, previously in ply drivers, with the growth of CO2 in the industrial age.
Science doesn’t care what you think Griff. It doesn’t care how many papers either side have written.
Consortia is plural. Consortium is singular.
Paraphrasing Einstein:
“One paper should be enough”
The effective word here is “should”. Sadly it rarely is.
Why does the climate change?
Fluctuations in:
the albedo, i.e. more albedo = less heat and cooler, less albedo = more heat and warmer,
a 92 W/m^2 ToA variation from perihelion to aphelion due to the elliptical orbit,
a 700 +/- W/m^2 ToA variation from summer to winter due to the tilted axis.
The W/m^2 contribution of GHGs RGHE “theory” amounts to little more than a rounding error.
And mankind can neither cause nor cure it.
“The W/m^2 contribution of GHGs RGHE “theory” amounts to little more than a rounding error.”
Except there is no science to back that statement up.
You could always provide some if there were?
YOU have burden of proof, Toneb, not the one that point at uncertainty:
show us the science to back YOUR statement. You could always provide some if there were?
You cannot. Chaotic systems (like climate is) behave like this, of their own, no forcing required. You cannot prove a forcing is required to explain climate change, because math says it isn’t. You cannot prove that the non existent required forcing is CO2. You only have your unfalsifiable, hence non-scientific, cult credo book
Really. Your analysis is just said. Really SAD. For starters, most of the research articles take about other factors related to the sun. They talk about temperature patterns caused by external factors, but most of them exclude or fail to take about CO2 and greenhouses. If a study fails to take about CO2, you cannot disprove a greenhouse affect.
Second, you are right , science isn’t a democracy, it is fact. The 97% figure represents how many papers and researchers have evidence to prove climate change. If most data proves this true, you must prefer that conclusion, as the consensus is not based on a personal whim but on data based conclusions. Therefore, the 97% figure has nothing to do with democracy. It is the amount of data and analytics that support the conclusion of climate change.