From the EUROPEAN COMMISSION JOINT RESEARCH CENTRE
The annual assessment of global greenhouse gas (GHG) emissions by the JRC and the Netherlands Environmental Assessment Agency (PBL) confirms that CO2 emissions have stalled for the third year in a row.
The report provides updated results on the continuous monitoring of the three main greenhouse gases: carbon dioxide (CO2), methane (CH4) and nitrous oxide (N2O).
Global GHG emissions continue to be dominated by fossil carbon dioxide (CO2) emissions, which however show a slowdown trend since 2012, and were stalled for the third year in a row in 2016.

Russia, China, the US and Japan further decreased their CO2 emissions from 2015 to 2016, while the EU’s emissions remained stable with respect to the previous year, and India’s emissions continued to increase.

-Other greenhouse gases keep creeping up
Information on the other two greenhouse gases, methane (CH4) and nitrous oxide (N2O), is only available until 2012, as international statistics on agricultural activities – the main source of these emissions – are not updated as frequently as on energy and industry-related activities.
Uncertainty is also higher for these emissions than for CO2 emissions.
However, the data until 2012 shows a steady increase in global GHG emissions, with an overall increase of 91% from 1970 to 2012.
CH4 is mainly generated by agricultural activities, the production of coal and gas, as well as waste treatment and disposal. N2O is mainly emitted by agricultural soil activities and chemical production.
In the EU, 60% of the CH4 and N2O emissions are emitted by the top six emitting countries – Germany, UK, France, Poland, Italy and Spain.
The upward trend in CH4 and N2O emissions is also visible in the US, China, Japan and India which all recorded increasing GHG emissions.
-Europe’s downward trend stalling
Over the past two decades, the EU28 has steadily decreased its CO2 emissions, which still represent two thirds of the EU’s total greenhouse gas emissions.
In 2016, the EU’s CO2 emissions were 20.8% below the levels in 1990 and 17.9% below the levels in 2005. Since 2015, the EU’s CO2 emissions have stabilised, representing 9.6% of global emissions.
-Country profiles
The report is based on the JRC’s Emissions Database for Global Atmospheric Research (EDGAR), which is not only unique in its space and time coverage, but also in its completeness and consistency of the emissions compilations for multiple pollutants: the greenhouse gases (GHG), air pollutants and aerosols.
The new report contains country-specific fact sheets for 216 countries. The factsheets show the evolution of country-level CO2 emissions from 1990 to 2016 and the evolution of country-level GHG emissions from 1970 to 2012.
###
Read the full report here: http://edgar.jrc.ec.europa.eu/booklet2017/CO2_and_GHG_emissions_of_all_world_countries_booklet_online.pdf
MAGA
SuperTrump. ‘Crisis? What Crisis?’
Ha! Very rare to hear that album referenced (the original), btw. Great record!
I’m concerned about the stall–foodstuff production was increasing significantly because of increases to atmospheric CO2. It will be a crisis indeed if CO2 plateaus and foodstuff production also stalls.
This is why I call the windmills “pinwheels of death” .
Indeed. This is so reminiscent of the early 1980s and the run-off of the “Ozone Hole” WE ARE ALL GOING TO DIE crisis.
Recall then that after years of nonsense hyperbole about manmade CFCs causing the “Ozone Hole” (a cyclical phenomenon, as suggested by anecdotal evidence going back to 16th and 17th Century Spanish colonial accounts of unexplained blindness occurring in Chilean sheep flocks), the purveyors of the meme started to declare victory. They did so, because (what do you know) the Ozone Hole started miraculously to close!! All because CFCs were removed from circulation….riiight.
Gradually more and more nonsense statistics and flashy graphics were circulated through the Media, and more and more preening of various academics (who had made entire careers out of the utter BS of the “Ozone Scare”) started to occur. Then, after a few years and entirely without fanfare, the meme was dropped.
The same thing is starting now in CAGW. The cyclical top has arrived and probably passed. There is nothing any “climate scientist” can do to perpetuate the gravy train of WE ARE ALL GOING TO DIE so ably publicized by Gore. The global climate will cool, perfectly naturally, for the foreseeable future – so the CAGW Brigade has decided it is going to declare victory while it can…See, we cut CO2 and voila. Success….!!
This way at least when (or if) societies in the Europe and North America in particular wake up to the fact they are vastly under-prepared for a cooler climate phase (not least because of the damage done by anti-CO2 emission policies to power generation capacity for national grids), the CAGW Brigade will be long gone from public memory; and will in any event be able to say it’s not their fault, victory was declared years ago and we cannot be blamed if governments didn’t prepare for the cold since then….
Watch. Just watch.
I agree with you. There is a segment of society that takes advantage of gullible people. Just follow the money!
It will be interesting to see how this relates to measured atmospheric prevalent assumption seems to be that most or nearly all of the rise is anthropogenic. If so then a stall in human emissions increase should be reflected in the atmospheric trend. If not then the assumption may be wrong.
“If so then a stall in human emissions increase should be reflected in the atmospheric trend. If not then the assumption may be wrong.”
As I understand it anthro emission stands at twice what the biosphere can sink. ie it removes around a half. That being the case then we would need to halve emissions to stand still as far as ppm CO2.
https://scripps.ucsd.edu/programs/keelingcurve/2016/05/23/why-has-a-drop-in-global-co2-emissions-not-caused-co2-levels-in-the-atmosphere-to-stabilize/
That’s not correct. If we reduce our emissions by half and the airborne fraction remains close to ~50%, half of what we will emit will still make it to the atmosphere.
It is however likely that the increased sinks will remain activated for some time (more plants will still need more CO2), and the airborne fraction might go down so it is theoretically possible to achieve negative CO2 change in the atmosphere with positive emissions.
Toneb. The claim can be traced back to alamists’ gross misuse of Henry’s law.
The current emission rate is about 10 Gigatons Carbon while the rate of absorption/sinking would be in the 6 Gigaton range right now after the El Nino blip.
The 50% airborne fraction is just a fluke. The rate of absorption/sinking depends on the amount of CO2 that is in the atmosphere, not how much we emit each year.
The natural absorption/sinking rate will eventually rise to the 10 Gigatons Carbon level (the same as we are emitting in the last 3 years) but that will be many decades from now.
anthro emission stands at twice what the biosphere can sink….
“biosphere” is growing exponentially…and the more you feed it, the faster it will grow
Why it isn’t obvious CO2 was limiting is beyond me
Toneb;
Your understanding appears to be flawed, as it seems to assume a balance in Nature, even though that balance has been disrupted by the end of the Little Ice Age. As the Earth warmed from that cold spell, more CO2 precipitated out of solution in the oceans.
Also, when a detrended analysis is performed tod compare the change in concentration of atmospheric CO2 to the amount of CO2 emitted by human activity, on a year by year basis, there is a very low correlation. When there is a very low correlation between the amount CO2 that humanity adds with the change in the amount of atmospheric CO2, that is evidence that human emissions of CO2 do not cause changes in atmospheric CO2. The apparent correlation between the the the amount of CO2 in the atmosphere and the total amount of human emissions of CO2 is false, because it only means that both have increased over time.
While correlation does not prove causation, a lack of correlation does disprove causation.
Sorry about forgetting the link:
http://edberry.com/blog/ed-berry/why-our-co2-emissions-do-not-increase-atmosphere-co2/
Lack of correlation could also point to not including all the variables.
Richard Bell,
By detrending the CO2 emissions and the increase in the atmosphere, one simply removes the main cause and effect. all what remains is the variability around the trend and that has a high correlation – with a lag – of CO2 variability after temperature variability. That correlation does show the cause of the variability, but doesn’t disprove the cause and effect of emissions and CO2 increase in the atmosphere. That correlation is very high over the past 120 years:
http://www.ferdinand-engelbeen.be/klimaat/klim_img/temp_emiss_increase.jpg
While the correlation with temperature is up – down – up – flat…
Over the past 800,000 years, there was a fixed correlation between temperature (proxies) and CO2 levels in ice cores of about 16 ppmv/K, not by coincidence the solubility change of CO2 in seawater. On short term (seasons to 1-3 years), that is about 4-5 ppmv/K. Since ~1850 the increase is over 120 ppmv/K if temperature was the cause, but that violates the observed solubility factor…
See further my comments (my last comments weren’t even published by Ed…) at the link you gave.
Javier — that’s probably pessimistic since CO2 absorption also increases as a function of CO2 levels — it should be necessary for CO2 emissions to not just increase, but actually continue to accelerate, to maintain the observed accelerating trend in measured levels.
If emissions go from “accelerating” to “flat” the trend should bend down pretty fast, barring some giant flaw in the theory that emissions are the primary factor driving concentrations.
Either the emissions numbers are way off (possible), or human emissions aren’t largely driving CO2 increases right now (looking more likely).
Ferdinand Engelbeen
That graph is a bit nonsensical — the blue line implies past emissions are being re-emitted in every future year. It’s as though you bought a mutual fund, and then every year you claimed the difference from your initial investment was income you could put in another account.
“That correlation is very high over the past 120 years:”
Sure, but that correlation exists for any accelerating trend over the last 120 years.
NASA: “The ocean is great at sucking up CO2 from the air. It absorbs about one-quarter of the CO2 that we humans create when we burn fossil fuels (oil, coal, and natural gas.) If not for the ocean, we’d be in even worse trouble with too much CO2.”
https://climatekids.nasa.gov/ocean/
Remember, the oceans and biosphere do not care where the CO2 came from — they absorb CO2 at a rate dependent on the level of CO2 in the atmosphere (and other variables), irrespective of current emissions. If humans emit twice as much as in one year as another, the amount absorbed depends on the current concentration, not the current emission! That’s why the shift from “accelerating emissions” to “flat emissions” should already be visible at Mauna Loa, and its absence must be explained by adjustment to either the claimed emissions or the theory of strong coupling between emissions and concentrations.
The biosphere capacity to “sink” CO2 is limited largely by CO2 availability and water. Satellite imagery evidence shows that the “capacity” to fix carbon has increased as atmospheric CO2 has increased. One of the more dubious assumptions of the alarmist community is the passive nature of biological response to increased carbon availability. The greatest threat to the biosphere is the excess capacity that it has for “sinking” carbon. Geologically, evidence seems to reflect steady draw down of atmospheric CO2, indicating that biology fixes it faster than geology can make it available again. Warmer weather and more CO2 would only make plants happier.
It makes me happy too…more CO2 is good for trees, lawns and crops. Isn’t that what everyone wants?
talldave2
That graph is a bit nonsensical
It shows the total increase of CO2 in the atmosphere if there were no sinks reacting on the extra CO2 pressure in the atmosphere… Or you buy every year a few obligations without selling one…
Sure, but that correlation exists for any accelerating trend over the last 120 years.
Indeed, like the growing population or industrialisation. In this case both the cause of the growing emissions. But the causal link between CO2 emissions and CO2 increase is a lot more likely than with temperature or any other increasing variable…
That’s why the shift from “accelerating emissions” to “flat emissions” should already be visible at Mauna Loa
Hardly, as the reaction of the sinks to the increase in the atmosphere is very small: about 0.02 * the pCO2 difference between atmosphere and ocean surface.
Increase in 2011: 4.2 ppmv – 0.02 * (391 – 290) = 2.18 ppmv
Increase in 2016: 4.2 ppmv – 0.02 * (402 – 290) = 1.96 ppmv
Accuracy of Mauna Loa for yearly averages is +/- 0.2 ppmv
This is exactly what is expected. The atmospheric CO2 increases because of large yearly emissions, not because they’re every year bigger than the previous year.
Should we halve emissions, the atmospheric CO2 should keep stable for some time. Long time sink development is not well known (uncertainty used for scaremongering), so it is hard to know what exatly happens if today’s emissions are kept for next 50-100 years. I believe vegetation will grow enough to start reducing the atmospheric CO2. Some others think that there’s a tipping point waiting even with stable emissions.
Thanks Ferdinand and Javier for trying to explain. +1 from me.
Ferdinamd,
But the causal link between CO2 emissions and CO2 increase is a lot more likely than with temperature or any other increasing variable…
No one can know that. The sample size is one. Maybe this is pretty close to what always happens in natural warming cycles.
That’s why the shift from “accelerating emissions” to “flat emissions” should already be visible at Mauna Loa
Hardly, as the reaction of the sinks to the increase in the atmosphere is very small: about 0.02 * the pCO2 difference between atmosphere and ocean surface.
Increase in 2011: 4.2 ppmv – 0.02 * (391 – 290) = 2.18 ppmv
Increase in 2016: 4.2 ppmv – 0.02 * (402 – 290) = 1.96 ppmv
Again, this doesn’t make any sense as a fairly simple matter of math — the largest increases in the past 100 years happened in the last five years, even though emissions were flat. If the difference in emissions between a flat and accelerating trend are indistinguishable to the trend of the overall concentrations, over five years, a causal relationship is unlikely even if the sinks are small.
talldave2:
Maybe this is pretty close to what always happens in natural warming cycles.
Sorry, impossible: that violates Henry’s law and the resulting solubility of CO2 in seawater which changes with about 16 ppmv/K as also seen over the past 800,000 years in ice cores…
The whole warming of ~0.8 degrees since the LIA is good for maximum 13 ppmv of the observed 110 ppmv increase above the 290 ppmv in equilibrium with the ocean surface for its current average temperature.
If the difference in emissions between a flat and accelerating trend are indistinguishable to the trend of the overall concentrations, over five years, a causal relationship is unlikely even if the sinks are small.
That depends of the time constants involved. The removal of any extra CO2 above equilibrium is a slow process, with an e-fold decay rate of ~51 years. Thus a small change in emissions between increasing and flat rate of change will not be noticed and certainly not if there is a lot of noise.
Take e.g. sea level changes: it takes at least 25 years to mathematically (!) detect a trend of a few mm within a noise of meters in waves and tides. Does that mean that there is no sea level change at all?
Maybe this is pretty close to what always happens in natural warming cycles.
Sorry, impossible: that violates Henry’s law and the resulting solubility of CO2 in seawater which changes with about 16 ppmv/K as also seen over the past 800,000 years in ice cores…
Every warming trend sees a lagging increase in CO2, the only question is how unusual the magnitude of the current interglacial’s has been recently. The warming process is not nearly well understood enough to rule out much of anything — we have reliable, high-resolution data on exactly one of them and we barely understand that one — just look at the spread of climate sensitivities in the literature. Solubility in sea water is one factor among many, many others.
If the difference in emissions between a flat and accelerating trend are indistinguishable to the trend of the overall concentrations, over five years, a causal relationship is unlikely even if the sinks are small.
That depends of the time constants involved.
That argument won’t help you, as it cuts both ways — a larger time constant implies emissions are less important to concentrations. I studied fusion physics data in which some processes had e-folds that manifested in nanoseconds, versus others that took milliseconds to unfold. Guess which processes dominated? 🙂
The removal of any extra CO2 above equilibrium is a slow process, with an e-fold decay rate of ~51 years.
Again, you don’t know that with any certainty and neither does anyone else. The literature of just the past ten years is full of surprises.
Also, as I pointed out before, the “time lag” explanation, in addition to not bolstering the strong coupling argument for emissions and concentrations, requires that the CO2, having been duly emitted, spend that lag somewhere other than the atmosphere, which is the one variable here we can at least sort of reliably measure and do.
Perhaps the CO2 is hiding in the oceans for a few years? 🙂 Hey! I think I found it next to Trenberth’s missing heat!
talldave2,
As you probably are familiar with simple linear processes, here is what is observed:
1959: 25 ppmv above steady state; sink rate 0.5 ppmv/year; decay rate 50 years; half life time 34.7 years.
1988: 60 ppmv; 1.13 ppmv/year; 53 years; half life time 36.8 years.
2012: 110 ppmv; 2.15 ppmv/year; 51.2 years or a half life time of 35.5 years.
Looks surprisingly linear to me, even if some of the underlying processes may be highly non-linear…
Thus, in my opinion, a factor 0.02 in ratio between net sinks and atmospheric pCO2 above steady state between ocean surface and atmosphere is acceptable for current and near-future sink rates (*).
The ocean surface and land surface temperatures have a small, short-term influence of about 4-5 ppmv/K, the deep oceans a very long term influence of 16 ppmv/K, which since the last glacial-interglacial is long past done. If anything, the small cooling since the Holocene “Optimum” should give lower CO2 levels, not higher…
(*) The IPCC uses the Bern model, which includes the saturation of the deep ocean sinks (and vegetation), leading to increasing time constants and a fraction that never will be absorbed. There is currently not the slightest sign of a decreasing sink rate…
talldave2,
Perhaps the CO2 is hiding in the oceans for a few years?
No, the CO2 is simply added to the atmosphere, that is why CO2 in the atmosphere increases.
The problem is that you expect a direct coupling between emissions and increase in the atmosphere, but the bottleneck is the limited deep oceans – atmosphere exchange, while the ocean surface is in fast equilibrium (less than a year) with the atmosphere.
The increase in the atmosphere is the simple subtraction of emissions minus sinks. The sinks depend of the total pCO2 above steady state, not of the emissions of one year. With a relative long decay rate, the sinks are smaller than the emissions and CO2 accumulates further in the atmosphere. That is all.
“The sinks depend of the total pCO2 above steady state, not of the emissions of one year. With a relative long decay rate, the sinks are smaller than the emissions and CO2 accumulates further in the atmosphere. That is all.”
Fortunately there is a constant increase of Carbon Dioxide that creates a growth of sinks. Without that increase of sinks the sinks would deplete the Carbon Dioxide to a starvation point and that creates a decreased growth because flora would adapt by not flowering and creating seeds or root shoots in other plants, by hoarding the Carbon Dioxide availability to them. The stunted flora will produce an increase of leaves to gather more CO2 from the environment in self preservation or die trying. In cold winter climates the flora that go dormant will struggle to recover in spring. Leading to their extinction over time and repeated years of it.
johchi7,
Good for the plants on earth, you are too pessimistic… The sinks only are active on the extra CO2 above equilibrium, not the absolute CO2 levels. The equilibrium over the past 800,000 years was about 16 ppmv/K change in ocean temperature, that was between 180 and 300 ppmv. For the current ocean surface temperature about 290 ppmv.
But indeed, 180 ppmv during the glacial periods is already very low and at the edge of extinction for C3 plants…
Patrick Moore calculates that, given the Neogene trend, CO2 might fall below the 150 ppm level, at which C3 plants start starving, failing to reproduce and eventually die, in about another two million years, as each succeeding glacial epoch gets colder.
Thus humanity is saving the planet by releasing sequestered carbon as CO2. The last thing we need is more sequestration. The risk of catastrophes from more of the essential trace gas is practically nil, where as the end of most photosynthesis-based life on land is a real danger. Only C4 and CAM plants and whatever microbes, fungi and animals could subsist on them would survive at low CO2 concentrations.
The one thing that the last 6 decades should have taught us, is that alarmist from the other end of the debate have been winning over the ignorance of the population by their scare tactics. Being nice and having scientific proof against their demonizing of fossil fuels and carbon dioxide has lost the debate. To get the attention of the population you have to hit them where it hurts to sway them away from their mindsets of indoctrination. I’m not say we should lie to them like their indoctrinators have done. Just persuade them with stronger language the benefits of increasing CO2.
…and by the way. People respond to common language and not scientists that use all their mathematics and symbols they know, but the layman don’t understand a word of it.
johchi7 October 23, 2017 at 3:10 pm
Even highly educated people fall for the “97%” lie, although they should know better. It IMO has been the alarmists’ most effective propaganda weapon. The Big Lie works, as Goebbels taught generations of propagandists.
Gabro I grew up when Saul Alinsky’s new book was still being talked about…”Rules for Radicals” that came after his book decades earlier “Revellie for Radicals” about community organizing and frankly how to set up protests and scare people into doing what you want them to. Going back farther to how John Dewey took control in education indoctrination tactics and that the Frankfurt School came from NAZI Germany to the USA and their indoctrination tactics of Marxism, Hagel and other socialist leaning philosophers changed all the schools in the USA. That Marxism and Darwinism was already prominent in our higher learning institutions since the middle 1800’s that gave us presidents like Theodore Roosevelt and Woodrow Wilson and Franklin D. Roosevelt and Lyndon B. Johnson many of our politicians of that era was what led to those changes in our schools. Back to Saul Alinsky that those Rules for Radicals are the same tactics being used to push these alarmists ideologies. Remember the “If you repeat a lie enough people will believe it.” of Vladimir Lenin….or was it Hitler? Or the “Give me the children and I’ll…” Well that’s how they’ve done it and still do it. Generations of sheeple indoctrinated from birth to conform to what the government says is truth and the media to spread it in nearly every way… “1984” the Orwellian classic comes to mind. How do you fight back against such a mass brainwashing that has demonized fossil fuels and carbon dioxide? Again, people respond to common language and scare tactics. Too much science is like speaking old Hebrew to an audience of Mandarin Chinese.
People will believe what they want to believe. It’s hard to change their minds if they have a vested interest in believing something.
Not sure what you mean by Darwinism. Social Darwinism? Evolution, like gravitation, is a scientific fact, to include darwinian processes, not a philosophy of education or indoctrination.
Unexpectedly I was called to work and no time to reply. You can find it online what Wilson and Darwinism he brought to govern by. Segregation, eugenics and in general racism as the survival of the fittest twisted mind set he had and his view on our Constitution as a living document that the separation of powers wasn’t a good thing…pretty much defined our Democratic Party that has change our society since then.
Thanks for responding.
That Wilson, like most Democrats, was a racist has nothing to do with the fact of evolution. Nor with Darwin, who, contrary to the belief of many in the 19th century, regarded humans as all the same species and opposed slavery.
http://godfatherpolitics.com/charles-darwin-woodrow-wilson-evolving-constitution/
https://fee.org/articles/woodrow-wilson-progressive-and-dedicated-racist/
“Government” he considered “not a machine, but a living thing . . . accountable to Darwin, not to Newton.” Nothing of that sort could, he believed, “have its organs offset against each other, as checks, and live.” Its health was “dependent upon” the “quick co-operation” of these organs, “their ready response to the commands of instinct or intelligence, their amicable community of purpose.” Wilson was the first to call for there to be a “living” political constitution “Darwinian in structure and in practice.”
To this end, in running for the presidency he openly sought “permission — in an era in which ‘development,’ ‘evolution,’ is the scientific word — to interpret the Constitution according to Darwinian principle.”
Ferdinand’s models are ad hoc, contrived, and non-physical. It is very obvious that human emissions have little influence on atmospheric concentration. One day, people will look back on it like we do at witchcraft and phrenology, and wonder how people could have deluded themselves so.
“It will be interesting to see how this relates to measured atmospheric prevalent assumption seems to be that most or nearly all of the rise is anthropogenic. If so then a stall in human emissions increase should be reflected in the atmospheric trend. If not then the assumption may be wrong.”
Sinks have been growing as our emissions have grown just in a lagging in response, if our emissions have stalled and sinks are still increasing in response to past emissions we should see a flattening and then slow decrease in the amount of CO2 in the atmosphere.
If not than our emissions and are not the cause of the global increase in Co2 concentrations and end of discussion.
Bob Boder,
As Bill Illis aready said, the sinks don’t respond to human emissions of one year, they respond to the total extra pressure of CO2 above the solubility of CO2 in seawater which is ~290 ppmv for the current (weighted) average ocean surface temperature, in dynamic equilibrium (“steady state”) with the atmosphere.
Because human emissions increased slightly quadratic over at least the past 60 years, the increase in the atmosphere also increased sligthly quadratic and so did the sinks. The result is an accidental average 50-55% “airborne fraction” in the atmosphere.
If humans should half their emissions, current sinks would be equal and CO2 wouldn’t increase further.
Now that human emissions stall, but still higher than the sink rate, CO2 further increases in the atmosphere and the sinks still increase, with as result a smaller airborne fraction:
http://www.ferdinand-engelbeen.be/klimaat/klim_img/dco2_em6.jpg
The observed net sink rate is about 0.02*Δ(pCO2(atm)-pCO2(eq)), or an e-fold decay rate of ~51 years, surprisingly linear over the past near 60 years…
Now that human emissions stall, but still higher than the sink rate, CO2 further increases in the atmosphere
At exactly the same rate? Nuh-uh.
talldave2
At exactly the same rate?
See the red line: that is the calculated remainder of emissions minus calculated sink rate, based on the extra CO2 in the atmosphere dynamic equilibrium with oceans (and vegetation). The blue line are the emissions, which remain flat in the past years, while the red line goes somewhat down. When the red line reaches zero, sinks are equal to emissions (at ~520 ppmv in the atmosphere), which will take many decades…
Ladies and Gentlemen,
I just plotted global atmospheric CO2 vs time from 1980 to present from this data source:
ftp://ftp.cmdl.noaa.gov/ccg/co2/trends/co2_mm_gl.txt
The atm. CO2 trend continues to accelerate slightly upwards, despite the alleged stall in the emission rate of CO2 for the past several years.
CO2 is truly a wonderful gas, since it seems to fulfill the wishes of all its proponents:
Since 1958, atm. CO2 has increased whether CO2 emissions have increased or not.
Since 1940, increasing atm. CO2 has allegedly caused global cooling, global warming, and near-constant global temperatures.
Are you sure you’ve got this all sorted out?
No wonder so many people think that CO2 should be curtailed – it is making them crazy. 🙂
Ferdinand,
At exactly the same rate?
See the red line: that is the calculated remainder of emissions minus calculated sink rate, based on the extra CO2 in the atmosphere dynamic equilibrium with oceans (and vegetation). The blue line are the emissions, which remain flat in the past years, while the red line goes somewhat down. When the red line reaches zero, sinks are equal to emissions (at ~520 ppmv in the atmosphere), which will take many decades…
Unresponsive. It would take an enormous coincidence for all these factors to balance net out such that an accelerating trend and a flat trend in emissions lead to exactly the same trend in concentrations. And no one knows what the sinks are, they can only be inferred, so you can fit them to any curve you like.
Allan
That is because the ladies and gentlemen are expecting a constant between 1 emission equals 1 co2 in the atmosphere.
The measured seasonal pass through rate / volume at 100km is increasing
Regards
Allan
I always enjoy and respect your analysis on this subject. However it is based on a closed circuit troposphere. That is, what good up always comes down.
CO2 is not like water it passes through the tropopause and at twice in the annual cycle passes out to higher altitudes on a permanent vacation.
If the emmision volume halved overnight, the annual atmospheric rate would continue to climb at a similar rate, if tropospheric temperature profiles remains constant.
Regards
ozonebust,
If the emmision volume halved overnight, the annual atmospheric rate would continue to climb at a similar rate, if tropospheric temperature profiles remains constant.
That certainly seems to fit the data far better than any of the models requiring emissions to dominate concentrations via some magical process that causes concentrations to rise the same way irrespective of whether emissions are flat or accelerating.
ozonebust and talldave2
If the emmision volume halved overnight, the annual atmospheric rate would continue to climb at a similar rate, if tropospheric temperature profiles remains constant.
Sorry, that is impossible. If the emissions halved, the increase in the atmosphere that year would be zero. The sinks don’t respond to the small increase of CO2 of one year, they respond to the total CO2 pressure (pCO2) in the atmosphere above the dynamic equilibrium between atmosphere and the solubility of CO2 in the ocean surface at the average temperature of the oceans.
Thus if in one year humans add 4.5 ppmv CO2 in an atmosphere at 400 ppmv, that is 110 ppmv above equilibrium (290 ppmv), that gives a sink rate of 0.02 * 114.5 = 2.29 ppmv resulting in an increase to 102.2 ppmv above equilibrium (402.2 ppmv).
If in the next year you add 2.25 ppmv CO2, or half the emissions, the sinks get 0.02 * 116.8 = 2.3 ppmv and there is no additional increase in the atmosphere.
If in the next years you add 4.5 ppmv CO2 each year again, that will lead to a smaller and smaller increase in the atmosphere, as the extra CO2 pressure pushes more and more CO2 into the oceans (and plants). But the difference in the first years is small, as you start already with 110 ppmv extra, thus each year the sinks increase with only about 2%. That difference in sink rate is not even observable at Mauna Loa, as that is within the accuracy of the yearly averages.
The factor 0.02 pressure/sink ratio is what is observed over the past 60 years and is surprisingly linear within a fourfold increase of emissions and extra CO2 pressure in the atmosphere over that time period.
The temperature profile of the atmosphere is important for water vapor, but unimportant for CO2: There is hardly a difference in CO2 increase between Mauna Loa at 4,300 m and Cape Kumukahi, Hawaii at 7 m above mean sea level. Only for fast (seasonal) changes, the amplitude at Mauna Loa is smaller due to the necessary mixing time of several months.
The main influence of natural variations on short time spans are land and ocean surface temperatures and on very long periods (glacial – interglacial) the deep ocean temperatures. as that influences the solubility of CO2 in seawater and the uptake/release of CO2 by plants and thus the equilibrium with the atmosphere. But both are not the cause of the current CO2 increase in the atmosphere…
Ferdinand
Your assumptions are without foundation, and your conclusions of equilibrium do not have data to support.
Again you look at the troposphere like it is a closed system, it is not.
The entire vertical column increases and leaks out at high altitudes in a twice annual cycle.
The real carbon cycle is still not well understood. The annual residual increase is what remains in the troposphere. Not one other person has commented on the seasonal trends shown in the OCO-2 images.
The previously unidentified annual pressure cycle that controls this transport process will post that soon.
Here is an detailed view of the real carbon cycle.
Regards
http://www.blozonehole.com/blozone-hole-theory/blozone-hole-theory/carbon-cycle-using-nasa-oco-2-satellite-images
Interesting, Ozonebust. However, something I think you should consider is that the CO2 anomaly is not proportional to temperature anomaly, rather its rate of change is proportional to (appropriately baselined) temperature anomaly.
This relationship has been manifest since at least 1958, when the Mauna Loa site came online. The higher accuracy satellite data produce an even better fit.
What that means is that there is a very long term equilibration process going on, such that on local time scales, the process looks very much like a direct integration. For very long time constants, it is natural to consider the oceans, which exhibit overturning on the order of centuries. That is the basis of my hypothesis for how this is all coming about.
Ozonebust,
There is not much CO2 that leaks into the highest atmosphere, most movements are in the troposphere as measured by balloons even in the 1960’s:
http://www.ferdinand-engelbeen.be/klimaat/klim_img/seasonal_height.jpg
Where it is clear that the amplitude is much smaller when you pass the tropopause.
Further, about 80% of the atmospheric mass is in the troposphere and CO2 gets less and less from 20 km height and up. Thus sorry, there is little CO2 that can hide in the upper atmosphere…
There is a much simpler explanation for the NH-SH transfer of CO2: 90% of the extra CO2 emitted by humans is emitted in the NH, which has the highest amplitude also in de NH, due to more land/vegetation than oceans. At the highest levels in the NH amplitude, CO2 is transported from the NH to the SH. In summer that can be reverse, but anyway smaller than the NH to SH transport over a full seasonal cycle. Look at the monthly CO2 data of a few NH and SH stations:
http://www.ferdinand-engelbeen.be/klimaat/klim_img/month_2002_2004_4s.jpg
In average the NH stations lead the increase of the SH stations.
The stall in CO2 emissions coincides with the current natural cooling. Going forward, the alarmists will be adjusting current temperatures down and past temperature up to make this coincidence seem relevant.
One must wonder how they get accurate CO2 emissions from some areas, China for instance?
David,
you ask the communist regime. They’re good and honest people, why would they lie?
“One must wonder how they get accurate CO2 emissions”
About the only thing they have to base this on is fossil fuel consumption, although global GDP is also a good indicator …
Only about 5% of the CO2 emitted each year is human-caused. So the fact that human emissions have stalled will have almost zero effect on our plants. Fortunately.
Hivemind,
Any bookkeeper would disagree with you: you forgot to take into account the natural sinks… Human emissions indeed are only about 6% of natural emissions, but they are additional and at maximum they are 3% of the natural sinks (as mass, not the original molecules), thus near all increase is from the human emissions, with a small part from increased sea surface temperatures…
Corrected: It will be interesting to see how this relates to measured atmospheric CO 2concentration. The prevalent assumption seems to be that most or nearly all of the rise is anthropogenic. If so then a stall in human emissions increase should be reflected in the atmospheric trend. If not then the assumption may be wrong.
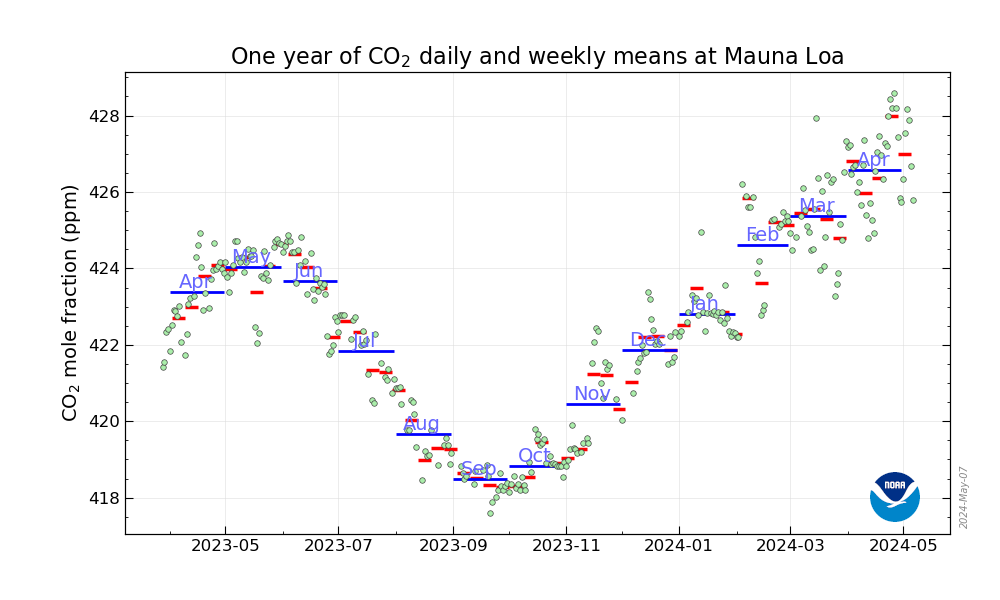
No sign yet of any lessening of the rate of increase at Mauna Loa –
https://www.esrl.noaa.gov/gmd/ccgg/trends/
but it would certainly be expected to take some time to show up as the rate of output is still large, and the uncertainty of the estimates is likely large also. How good are the Chinese figures, given that they are much the largest emitter, annual economic growth is 6-7% (claimed), new (somewhat cleaner) coal generation is being very rapidly added, and old dirty coal generation reduced only a little,?
According to the first graph, there has been little change in human emissions all the way back to 2010. Before 2010, however, human emissions were increasing steadily. The alarmist dogma (welcomed by special interests and UN bureaucrats) is that increasing human emissions are responsible for increasing CO2 in the atmosphere. The emperor just joined a nudist colony.

Whereas human emissions stopped increasing, have scarcely changed for the better part of a decade, the increase of CO2 in the atmosphere didn’t flinch. Atmospheric CO2 has continued to increase – if anything, even faster.
The contradiction leaves little weasel room.
Ian – the point is that human emissions have stopped increasing, but they haven’t stopped, and the year-on-year extra load is not much altered from expectation.. So we wouldn’t expect this to show up in the CO2 measurements in an identifiable signal for a long while yet. The CO2 concentration remains well within the predicted envelope. There are other reasons for doubt, perhaps, but sceptics on this point are far fewer than sceptics of CAGW. I myself still have reservations that the ‘mass balance calculation’ can be regarded as evidence, but I’m not in particularly good company on that one!
mothcatcher — what, is the extra CO2 hiding in the oceans? 🙂 Sorry, this doesn’t make any sense — violent shifts in output from “accelerating” to “flat” should not be completely indiscernible in the trend of concentrations supposedly driven almost entirely by emissions.
Ian
If CO2 emissions halved overnight and seasonal temperatures remained similar the annual Mauna Loa Increase would rain similar.
The first indication of atmospheric reduction will be recorded at the 100km seasonal variation pass through rate / volumes. The entire vertical column growth rate will stall top down.
The current carbon cycle closed circuit is nothing more than an unqualified myth lacking in imagination.
Mauna Loa Increase would remain similar.
ozonebust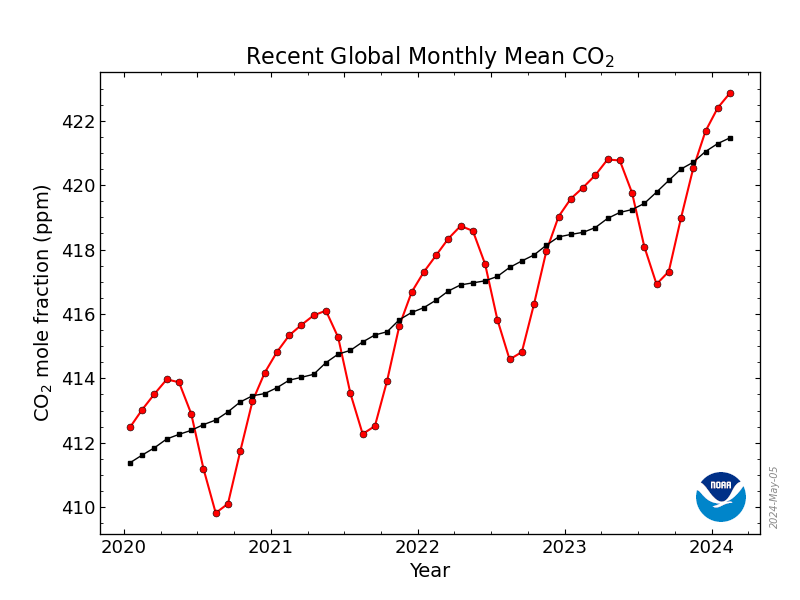
globally it is also 2 ppm per year
Mauna Loa Increase would remain similar.
talldave2,
Indeed most is absorbed by the oceans and also a lot in vegetation, the earth is greening, but that doesn’t not remove all emissions in the same year as emitted. Thus CO2 keeps growing in the atmosphere.
Seasonal and year-by-year variations (Pinatubo, El Niño) are caused by temperature but near zero out at the end of a full cycle or a few years. The long term trend in CO2 is about half of human emissions and its removal follows the extra pressure in the atmosphere, hardly infuenced by temperature.
Further, it would be very remarkable that some natural source increased in exact lockstep with human emissions in the same time span: a quadrupling over the past 60 years…
Ferdinand
The DeVries cycle is 210 years and we have not seen even 60 years of good data, even some changes in equipment during that 60 years….
never mind the Eddy cycle of 1000 years
[there is good historical evidence that the NE or NW passage existed 1000 years ago]
Like the increase of fires and volcanic activities.
Like the increase of fires and volcanic activities.
Ferdinand: “Thus CO2 keeps growing in the atmosphere.”
It’s not just continuing to grow… the increase is still increasing. Not possible.
https://www.esrl.noaa.gov/gmd/ccgg/trends/gr.html
talldave2,
You need to take into account that in El Niño years there is less uptake (specifically by tropical vegetation) and more during La Niña or Pinatubo…
1998 and 2015-2016 were strong El Niño years, 1992 was the Pinatubo eruption.
Despite that, the variability in CO2 increase was not more than +/- 1.5 ppmv around a trend of +90 ppmv, here enlarged for the period 1985-2000, asssuming a response of 4 ppmv CO2 / K temperature change:
http://www.ferdinand-engelbeen.be/klimaat/klim_img/wft_trends_rss_1985-2000.jpg
Henry’s
That is the rate recorded at Mauna Loa. It is the rate used for the global increase.
The curve is controlled by the annual thermally driven tropospheric pressure cycle, as are all sample site curves.
It records the circulating accumulation and then the dilution of oxegenation. Look at the CO2 minimum date.
In April 2017 at a congressional hearing Dr Judith Curry stated quite clearly that there is no understanding of what controls the polar sea ice cycles. Nothing has changed since that time.
 ?w=800
Greg Goodman posted this chart some time ago, it is on the WUWT CO2 page.
It identifies the immaculate relationship between the Arctic sea ice cycle and the Alert CO2 cycle.
They are both controlled by the same annual pressure cycle.
If you do not know what controls the Arctic sea ice cycle – you DO NOT know what controls the CO2 cycle.
I would ask anyone commenting here to please explain why the high latitude CO2 curves go flat (i.e.) the CO2 stops rising) during December in the mid – high NH latitudes for many weeks during winter, then rises slightly in spring before declining. During the flat no growth period NH emissions are at a peak and oxidation is not occurring.Why do the curves go flat?
Logic needs to enter this discussion,may it arrive soon.
Regards
henryp,
Those cycles have an influence on temperatures, thus on CO2 levels, but even the MWP-LIA drop of ~0.8ºC did give only a drop of about 6 ppmv CO2 in the high resoution (20 years) DSS ice core of Law Dome:
http://www.ferdinand-engelbeen.be/klimaat/klim_img/law_dome_1000yr.jpg
If we may assume that the current temperature is not higher than during the MWP, that is all CO2 from warming oceans you have…
ozonebust,
The CO2 cycle and ice surface cycle have a common cause: seasonal temperatures. Sea ice and CO2 don’t influence each other to a measurable extent.
The CO2 cycle definitely is dominated by the biosphere, not by the oceans: highest uptake is in summer and CO2 and δ13C change opposite to each other. If the oceans/ice were dominant, then CO2 and δ13C would parallel each other. Here for Mauna Loa and Barrow:
http://www.ferdinand-engelbeen.be/klimaat/klim_img/seasonal_CO2_d13C_MLO_BRW.jpg
Mr. Englebeen cites Pieter Tans of NOAA asserting that to the extent temperature affects natural emission of CO2 into the atmosphere, this effect is only a short year-to-year effect. The reason advanced is that this natural emission is predominantly the decay of fallen leaves and dead logs in the tropical rainforests, and this material decays very rapidly under tropical warmth and wetness. That temperature and the rate of atmospheric CO2 increase is correlated over longer intervals follows from temperature increasing from the human emissions over time — the anthropogenic signal in Climate Change.
Look at the Great Leveling of the atmospheric CO2 curve in the early 1990s. I see this occupying 4-5 years. Mt Pinatubo “blew” in 1991, cooling the atmosphere. Look at the 2010s where industrial output was affected by the Great Recession. I see hardly any effect. This offers strong evidence of temperature-stimulated natural emissions. There is also field measurements in support of such natural emissions of comparable scale to the human-caused emissions (Bond-Lamberty, B. & Thomson, A. Nature 464, 579-582 (2010). )
Pieter Tans could be correct and the preponderance of the increase in atmospheric CO2 could be human caused. Or maybe not. We could use better models of both temperature-stimulated emission of CO2 from soils as well as the effect of changes in ocean upwelling affecting both global temperature as well as ocean-atmosphere CO2 balance.
Paul Milenkovic,
The main influence of temperature is the short term influence on mainly tropical vegetation. That is visible in the opposite CO2 and δ13C variability lagging temperature variability. See the graph I sent in response to talldave2 just below this series of answers.
Higher temperatures (and dryer conditions) means less uptake and more release of CO2 in the tropics. That is only temporarely during an El Niño and reverses with the end of the high temperatures and increase of precipitation. Net result near zero after a few years, as tropical forests in general are mature forests with little or no real growth or increasing of more permanent carbon in/on the soils.
On the other side, the extra-tropical forests increase their uptake with higher temperatures – increased growing season – and react more readily to the increased CO2 pressure in the atmosphere.
Thus while temperature is the main cause of the CO2 rate of change variability in the atmosphere, due to vegetation, vegetation is not the cause of the increase of CO2 in the atmosphere, it is an increasing sink.
Thus even when temperature increased somewhat over the past 60 years, that is not the cause of the CO2 increase and δ13C decline in the atmosphere. Neither are the oceans, which are a proven sink for CO2 too and their δ13C levels would increase δ13C in the atmosphere, while we see a firm decline…
Ferdinand
With the greatest respect you are missing the point that I am making. The shape and timing of the curves is not controlled by the biospheres. The biospheres and emissions are contributors to the contents of the curves, but not the precise timing of the shape.
Both the sea ice area cycle and the CO2 cycle are controlled by a pressure cycle.
I am yet to see an answer to my question about high latitude NH CO2 curves.
Regards
Ozonbust:
The biospheres and emissions are contributors to the contents of the curves, but not the precise timing of the shape.
I disagree: the timing may be influenced by ice formation/melt, but the bulk of the δ13C drop in Barrow in the above seasonal curve shows that higher temperatures give more plant uptake in spring-summer-fall and opposite in fall-winter-spring. Nothing to do with pressure while ice formation/melt hardly influences the amplitude, that is mainly due to the amount of CO2 going in and out the biosphere, The oceans do react opposite to temperature as what is observed (both for CO2 and δ13C), thus vegetation is the dominant factor.
Moreover, the high seasonal amplitude of the CO2 and δ13C change is not only visible in the High North, but also in the mid-latitudes: the seasonal CO2 amplitude at the former station of Schauinsland (Black Forest, SW Germany) is larger than at Barrow. In the SH, the seasonal amplitudes are much smaller: more sea, less vegetation…
https://www.esrl.noaa.gov/gmd/ccgg/trends/gr.html
Ferdinand Engelbeen October 20, 2017 at 1:33 pm
talldave2,
You need to take into account that in El Niño years there is less uptake
Sure, but this isn’t the first El Nino, and the others mainly happened under accelerating emissions. What’s more likely, that the steady trend in CO2 concentrations is due to factors we don’t understand very well, or that the wildly fluctuating trend in emissions dominates concentrations but in ways that are precisely offset by other factors to produce a steady trend in concentrations even when emissions flatten?
“We don’t know” has a pretty strong track record against barely plausible models.
talldave2
Human emissions don’t change wildy from year to year, to the contrary: year by year emissions vary less than 0.2 ppmv, which is not even trackable in the Mauna Loa data…
The overall increase is a smooth slightly quadratic increase in total emissions over the past 60 years and a near linear increase in the rate of change.
The wild variability is in the year by year increase in the atmosphere, which is caused by the influence of the high year by year variability in temperature: that influences the sink speed, where the variation is mostly in the uptake by tropical vegetation. During an El Niño, tropical vegetation is even a net producer of CO2 as uptake is suppressed due to dryer conditions in the tropics.
Here the clear influence of temperature on the CO2 rate of change which is mainly in vegetation as the opposite CO2 and δ13C changes indicate:
http://www.ferdinand-engelbeen.be/klimaat/klim_img/temp_dco2_d13C_mlo.jpg
Human emissions increased near linear from 0.23 ppmv/month in 1990 to 0.33 ppm/month in 2012.
That means that near all variability is caused by temperature variability, but that near all of the slopes of the trends (both CO2 and δ13C) are caused by human emissions…
Again, “accelerating” is a wildly different trend than “flat.” This is not that hard to follow.
None of the flak you throw out even comes close to a good explanation of how a wildly fluctuating trend in one variable creates a smooth trend in another.
talldave2
None of the flak you throw out even comes close to a good explanation of how a wildly fluctuating trend in one variable creates a smooth trend in another.
1. Human emissions don’t wildly fluctuate, they were smoothly increasing over time with only a few periods of flattening in times of economical reset.
2. Temperature does wildly fluctuate from year to year, but in average show a small increase.
3. The effect of temperature on CO2 levels is small and gives not more than +/- 1.5 of wild variation around a trend of +90 ppmv in the past 90 years.
Thus the net result is that both the trends of CO2 emissions and increase in the atmosphere are slightly quadratic curves, where temperature cuased variability and the influence of small ups and downs in human emissions are hardly visible. The net effect is a high linear correlation between both:
http://www.ferdinand-engelbeen.be/klimaat/klim_img/acc_co2_1960_cur.jpg
Ferdinand,
Again, wildly fluctuating emissions trend.. I’m not explaining the difference again, and I don’t know why you bring up temperature at all.
talldave2
Again, wildly fluctuating emissions trend.. I’m not explaining the difference again, and I don’t know why you bring up temperature at all.
Dave,
Again, human emissions are not wildly fluctuating, neither from year to year nor in trend.
The observed overall trend in emissions is a fourfold increase since 1960.
The observed overall trend in the atmosphere is a fourfold increase since 1960.
The net difference, that is sink rate, is a fourfold increase since 1960.
There are (mostly economical) periods where emissions were flat or even megative during several years and years with more growth. That is not visible in the growth rates of CO2 in the atmosphere, as the variability in emissions is smoothed in the atmosphere, because the sinks react on the total extra CO2, not the emissions of one year.
In the current situation, a change of 10% in yearly emissions gives a less than 1% change in yearly sink rate. That is not detectable in the Mauna Loa data and widely within the huge year by year variability in CO2 rate of change caused by temperature variability…
talldave2,
To make it more clear:
http://www.ferdinand-engelbeen.be/klimaat/klim_img/dco2_em2.jpg
Human emissions are increasing per year, with periods of a few years of small increase and flat or even slightly less increase in emissions.
All the year to year variability and almost all variable trends is in the sinks, which are caused by temperature. That levels off within 1-5 years to near zero around the trend. The variability is maximum +/- 1.5 ppmv around a trend of 90 ppmv since 1959.
2015 and 2016 were El Niño years which give a false impression of an increased trend of CO2 in the atmosphere, while emissions are flat. Remove these two years and you have a flat trend with increasing emissions, just the opposite. That simply is endpoint bias…
Within a few years the increasing trend in the atmosphere will go down if the emissions remain flat.
If this is the trend moving forward, it removes the pressing need to drastically reduce CO2 usage. If this becomes a long term trend, activists will have to invent another looming tragedy to justify their existence.
Regardless, I’m not convinced CO2 has any appreciable impact on temperatures, but it’s certainly had an impact on plant growth. This is a good thing and something we should hope continues.
Joz Jonlin – There is no pressing need to drastically reduce CO2 usage. Now from the rest of your comment, it is clear that you meant to say that there is no support for the argument that there is a pressing need to drastically reduce CO2 usage. But others will continue to believe that your actual words are correct. What annoys me is that once a cause-and-effect idea has been planted in the population’s minds, even when the cause is removed the effect remains – and the planters know this. In this case, the argument has been that CO2 causes dangerous warming so we must cut emissions of CO2. But even when it is shown that CO2 does not cause dangerous warming, the public will continue to think that we have to cut CO2 emissions. It is going to be a long hard road back from the brink.
It’s the same as the false scare-mongering about overpopulation. It’s beginning to take care of itself.
If the globe is starting to cool while human emissions increase, the atmospheric concentration might remain constant. If emissions stabilise and the temperature increases, the concentration will continue to increase.
The current stability in AG emissions is not the business-as-usual scenario we have been told to avoid. The Ehrlichian neo-Malthusians are going to have difficulty with this one.
Crispin,
You need a lot of cooling, every year again, to compensate for human emissions…
At 2 ppmv/year (xurrent emissions – sinks), you need a drop in temperature of ~0.125ºC/year or ~1.25ºC/decade or ~12.5ºC/century…
Is there a refrigeration mechanic in the house. The Earths atmosphere is 5140 trillion tonnes and I want to drop it 0.125 degree C per year give me the power required to do it that I would need per second. That is and interesting calculation.
I am running the calcs to see the best way to get it out to space but I rarely play with Cooling in Air.
LdB,
You need even much more cooling (by changing the radiation balance), as most heat change (~90%) is in the ocean surface layer (average 200 m thick) and only a few % is in the heat content of the atmosphere, the rest in land and ice. See Fig. 3 in:
http://junksciencearchive.com/Greenhouse/grlheat05.pdf
yeah I am wondering how many say albatross airplanes trailing something like a large reflective foil it would take to basically deny the Earth that much energy. Would be an interesting calc.
…and yet the pCO2 MLO observational record keeps steadily moving upward.
hmmmmmm…. maybe more related to a post-LIA thaw and biogeological cycling increases???
While the oceans are likely net carbon sinks, still Henry’s Law can’t be avoided in a kinetics effect of sink uptake.
Volcanos ignore Henry’s law royally. Henry foresaw it wisely in the precise preconditions of his theory.
The US emissions have been dropping since the turn of the century, and are now back in the same range as the 1970’s. EU’s emissions have been downtrending since the 1970’s. Russia flat since the 1990’s. ONLY China has been increasing.
The only country that matters, even globally, is China.
We outsmarted the Chinese by giving them all our nasty industry! That’ll fix ’em! I wonder if they’ll send us care packages.
It would be nice to see a list or table showing why “US emissions have been dropping.”
Some processes are more efficient, some have been exported.
Autos have become better with higher mpg, but there are more of them.
Coal was used for home heating prior to the 1950s, now much gas.
We have an electric air-sourced heat pump; power is from hydro.
Some group must have done such a list. Anyone have a reference?
John,
Lots of information from EIA:
https://www.eia.gov/environment/emissions/carbon/
For 2016 and downloads for previous years
We can, and should do better. The biosphere needs more CO2, not less.
Yes we can!
La Niña is currently developing.
http://www.cpc.noaa.gov/products/analysis_monitoring/enso_update/heat-last-year.gif
Boy, it will be such delight when in 2 or 3 years we have 7 years flat or negative trend in human emissions while the overall CO2 concentration keeps going up. What a scramble that would be to “adjust” the human emissions data. I cannot wait for the spectacle…
It is funny that the scenario where scientists admitting to being wrong is not in the picture.
Ian,
Even if the emissions get completely flat over a century, CO2 will go up in the atmosphere until the sinks equal the emissions. That will be at an about 2.15 ppmv/year extra sink or 2.15/0.02 = ~110 ppmv extra in the atmosphere compared to today or about 520 ppmv in the atmosphere…
I agree with these estimates.
The weird thing is that climate scientists just will not do the proper modelling to get to this reasonably accurate track. They are pushing the zero emissions track when that is not required at all to stabilize CO2. I think it says something about what their real purpose is.
Yes, 520 ppmv would be wonderful.
Rainer:
Yes, 520 ppmv would be wonderful.
1,000 ppmv even better…
Ferdinand, what percentage of the sinks is vegetation?
David A:
Ferdinand, what percentage of the sinks is vegetation?
About 50:50 (deep) oceans and vegetation, based on oxygen use:
http://www.ferdinand-engelbeen.be/klimaat/klim_img/bolingraph.gif
Global emissions have been outsourced to China and no accounting of this fact reflects lower CO2 growth back to Europe and the USA. Europe has also utilized Russian gas to lower its emissions and the USA has also had a large increase in nat gas when shuttering its coal fired electrification. All this ‘accounting’ is bit of mugs game, although China is left with the worst actual air pollution.
Additionally, if a significant La Nina builds and the Oceans cool a bit, then that will reflect on lower CO2 emissions as cooler ocean waters absorb more atmospheric CO2. If we go into a secular cooling phase for multiple natural variation reasons over multiple years, then that will also tend to put a more serious dent in emissions. That’s when the green club will take credit for all the renewables finally making a difference and the proof? Lower growth to atmospheric CO2 levels. It will be a war to the end on the ‘carbon’ debate.
Looks like the funeral of Paris accord.
Looks like the Paris accord is doing exaxtly what it set out to do
Wow, it must be magic to have plateaued even before the agreement.
Nothing to do with the stalling production of course.
bensquared,
“exactly what it set out to do”
Which was to give the illusion of doing something (meaningless in reality of even the IPCC exaggerated methods) in order to throttle Western-style capitalism and transfer wealth to buy participation (bribes to 3rd world).
Yeah, the Paris Accord was the kind of satisfying #2 success that is best flushed down the loo and not allowed to linger.
Pfffft. Like any of the countries that signed have actually done anything they said they would since they signed it. Nice try.
BB, how so, when nobody is following the Paris accords?
Australia is leading the way on the Paris agreement we have invented all sorts of ways to do creative accounting. We have “roll over credits” and “land use change credits” we are a big country there are no limits to where you hide those pesky CO2 molecules.
Nobody implemented these socalled ‘intentions’ from Paris.
“Looks like the Paris accord is doing exaxtly what it set out to do”
I agree, it was only ever a “feel-good” greenie wankfest.
I’m sure you are enjoying it.
And really , only a 2 year old would call themselves benben. !!
We are piling nonsense on top of nonsense. These CO2 emissions numbers are estimates, at best. The whole brouhaha is a political hot potato and my confidence in the objectivity, accuracy and integrity of the reported numbers is pretty close to the square root of nothing at all.
Yikes, if you think the temperature record is subject to manipulation for political goals… the CO2 emissions numbers are hugely more vulnerable.
I would take them with an astronomically sized pinch of salt.
My thoughts exactly
In principle the emissions should be reasonable exact, as these are based on fuel sales, that means taxes… In reality more underestimated than overestimated due to the human nature to avoid taxes… Or for political reasons (China…).
Thus anyway, human emissions by far exceed the increase in the atmosphere in every year since Mauna Loa started, Thus the mass balance, supported by every other observation, points to human emissions as cause of the atmospheric increase…
Yes. It is dung in the air. Be happy. Add some more!
So F.E.
“Thus anyway, human emissions by far exceed the increase in the atmosphere in every year since Mauna Loa started, Thus the mass balance, supported by every other observation, points to human emissions as cause of the atmospheric increase…”
You would contend that without human CO2 from the last 100 years world CO2 levels would be 160ppmv and dropping?
Are emissions estimates based on sales of fuel, or on the production thereof? The latter seems to make more sense.
george lanham,
Without human emissions, the CO2 levels would drop towards the temperature controlled dynamic equilibrium between ocean surface and atmosphere. For the current average ocean temperature, that is about 290 ppmv.
The speed of removal of any CO@ur momisugly above that equilibrium level has an e-fold decay rate of around 51 years or a half life time of ~35 years, surprisingly linear over the past 60 years. Not fast enough to remove all current emissions in the same year as emitted…
Pop Piasa,
Would not give much difference, as what is produced is mostly sold and used within a short time. Sales and use are shorter in time lag than production and use.
Nobody, really nobody, can calculate the exact co2 emissions from humans. And then, who cares. its still 0,04%. Rounded off its zero. Has no influence compared to h2o. The atmosphere only delays heat transfer to to universe.
More co2 leads to more food for nature.. more oxygen and more food. Great, bring it on.
The CO2-induced “greenhouse effect” in the wild does not match its characterization in isolation. The profits of catastrophic anthropogenic global warming will need to add progressive (i.e. monotonic) fudge factors to keep pace with Nature’s underwhelming conformance with their deeply held hypothesis… models’ shortcomings.
Radiosondes on weather balloons (since 1958) and satellites (since 1979) do not support CO2 “control knob” theory. Even computer temperature reanalyses belie CAGW.
I like someone’s introduction of the term “wiggle watching,” referring to people slavishly regurgitating their observations of short-term changes in whatever climate metric they are following. I suggest we give it another 5 years-plus to look at 21st Century trends.
Another reason to thank the Lord that Trump won and not Hillary.
The CAGW’ers have been desperately trying to prop-up a global warming trend to match their theory (CO2 is the climate control knob) for a decade now. To wit, Karl, et al, 2015, Gavin S GISS adjustments, BoM station data diddling, NOAA and NASA model “infilling” missing data with synthetic data in large unmeasured areas, etc. The CAGW’ers pretty much can tread water as long as the real GMST is flat or near flat. But a declining GMST just can’t be adjusted away. By 2020 that should be obvious.
SO, how much yearly increase were the doomsday folks counting on? Obviously they need a doubling of CO2 in the not real distant future, according to their logic.
I’m not certain how much, but the effect of the electrification of the transportation sector (EVs to you) should have a gradual but noticeable effect, even if the cars are fueled from the grid, which was 67% fossil fuel based in 2015 in the U.S. , but since then nat gas has replaced a fair amount of coal, so CO2 emissions have been reduced because of that, which has generally been the reason U.S. CO2 emissions have dropped over the past decade.
OF COURSE, one MIGHT expect, in a logical world, that the doomsday folks would be overjoyed
at this stable emission situation. But NOOOOOO……. that would mean they no longer can be saviors of our planet. Bummer!!!! Eliminates most of the reason for their existence.
Warmists to connect the dots between this and the “Pause” in 3…..2…..1….
Well, It looks like we can thank China for their pause….Perhaps Chow Mein and Mandarin Duck are in order tonight
Can you actually believe any figures produced by China or Russia?
Or the EU.
I’m glad somebody thought to add uncertainty date – but does anyone know how it was determined? I question the accuracy of the data. Do we really know China’s emissions to within 4 Gtons or so per year? That’s very hard to believe.
Why can’t we declare victory, and move on to the next manufactured crisis, so our energy prices can come down?
Co2 levels stall (not human emissions) we cannot measure human emissions, and never have measured human emissions.
ocean sea level rise stalls.
ice recovery in last 3 years.
Sun going to sleep.
Doesn’t take a genius
Also, solar forcing on hurricanes and cyclones, Willie Soon also covered this.
https://youtu.be/Fm6Y5mETVk4
https://link.springer.com/article/10.1134/S0016793217050115
I wonder how much of the SLR stall is due to the recent El Nino taking a lot of heat from the oceans and dumping it into the atmosphere, and from there, into space.
Mark – Helsinki:
we cannot measure human emissions, and never have measured human emissions.
I don’t think the customs will agree in that: a large part of the state’s income is from fossil fuel sales and that is the base for the emissions inventories…
Sales are not emissions though, and globally… lol
Mark Helsinki.
To cherry pick Katrina in one of the most active years does not make their evidence compelling. What they need to provide is a complete overlap of data for every year. This should not be difficult.
However it is very interesting, thanks for the link
Regards
seems to me global CO2 rose by about 2 ppm compared to a year ago?
so no stall, my bad, as is, no matter what we do with emissions, thanks for info.
Though I stand by the fact no one “measures” anything like close to even a 10th of human emissions.
co2 emissions numbers come from
models, not direct measurements. since people
charge for, and pay for, fuel for driving, heating,
etc, and power plants etc have
to report to
the govt, it’s possible to get a pretty good handle on
co2 emissions by modeling it.
And because they are models most countries lie. It is going to be the new political game of much carbon emissions can you lie about and actually get away with. I think Australia is doing pretty well but I suspect a few others may be better than us.
How about the 95% of CO2 not produced by human activity? Any changes there?
for the last 5 years it was about 10 ppm, i.e. also 2 ppm per year.
Business as usual – I am happy to report!
If human CO2 emissions were flat, does that mean this year’s increase in CO2 was natural?
El Nino caused a spike in geometic atmospheric CO2 growth, something human emissions could never do.
NOAA act shocked, lol, but you would be shocked only if you believed the oceans to not largely dictate CO2 levels
and good point, but truth is they have little real idea what is actually emitted.
I am certain China’s emissions are far more than claimed, only a 2 years ago? they claimed they found another 14% of emissions from China that was missing. 😀
India has NO CLUE how much CO2 is emitted and neither does China, as home coal use is used by millions, all they have is sales data.
No, it does not mean that. Let’s say you are adding money to your bank account. Every year you add more money than the year before until 2011 when you only add as much as in 2010. Does that mean your account stays flat? Not at all, what it means is that your account goes up no faster in 2011 than it did in 2010.
Now change you for “mankind” bank account for “atmosphere” and money for “CO2.” That’s what the chart means.
but you’ll find little in the way of sales data for a lot of non fossil fuels use.
India and China wood burning, no data, All of Africa wood dung and other CO2 emitting fuel sources.
Global emissions totals are a joke figure
Tom in Indy
(is that in India or Indiana?}
The first smoke from a kettle with water that you put to boil, is the CO2 escaping,
hence a natural reason for the increase in CO2 is the first most logical reason.
However, I think it is all politics here. It seems that powerful governments in US and Europe have made a shift from blaming CO2 to blaming CH4. I am not sure why: perhaps it is the science of farming where they add CO2 in the green houses to get bigger fruit and vegetables?
we need more CO2, not less, as any sane person knows.
Anyway, I have never seen any report showing us the balance sheet of how much cooling and warming a certain GH causes? Have you? Anyone?
chadb — no, you would have to also assume you are removing money at a faster rate, making withdrawals proportional to the account’s size… if your contributions go from “accelerating” to “flat” the overall balance in your account should actually be dropping, not continuing to accelerate upward as though your contributions were also still accelerating.
talldave2,
The withdrawal indeed is proportional to the total height of your account, but was only half your deposit per year. If that gets flat, still your account is going up and thus the withdrawal increases, thus the increase gets smaller, but still is an increase over very long time to where your yearly deposit and withdrawal are equal.
For CO2 in the atmosphere at the current flat emissions (~4.5 ppmv/year), you need ~520 ppmv in the atmosphere to break even.
The withdrawal indeed is proportional to the total height of your account, but was only half your deposit per year.
Again… no one knows that, and even if it were true it can’t explain why flat and accelerating contributions produce exactly the same trend in your account, as though they were only tenuously related. My advice to the bookkeeper is to get a lawyer, as IRS may be looking askance.
This is nothing more than an attempt to peg the coming El Nina to a reduction/leveling of fossil fuel usage.
Ooops…. that would be La Nina. Latent misogyny?
+100 😀