Guest post by David Middleton
There has been some recent “buzz” about the upcoming Fourth National Climate Assessment (NC4), including some moonbat conspiracy theories that the Trump administration will try to suppress or otherwise interfere with the scientific integrity of the report. The New York Times has already been forced to essentially retract such a claim in a recent article.
If NC4 actually builds upon 2014’s NC3, EPA Administrator Pruitt’s Red Team will have even more material to work with.
Fourth National Climate Assessment
Development of the Fourth National Climate Assessment (NCA4) is currently underway, with anticipated delivery in late 2018. Below you will find information related to NCA4, including a list of chapters, explanation of author roles, and opportunities to participate in the process.
What’s New in NCA4
NCA4 will build upon the successes of the Third National Climate Assessment. Find out more:
The first “sciencey” graphic is titled: Projected Global Temperature Change.
https://debunkhouse.files.wordpress.com/2017/08/nca_01.png
And then just enlarged the Epic Failure bits to get the Red Team’s QED:
https://debunkhouse.files.wordpress.com/2017/08/nca_02.png
https://debunkhouse.files.wordpress.com/2017/08/nca_03.png
The predictive run of the models begins in 2006. By 2014, the observations were tracking the bottom of the 5-95% probability band.
Since 1988, the observations have consistently tracked strong mitigation scenarios, despite a general lack of mitigation. Even if you tack on the 2016 El Niño, the observations only spike into the model-mean area.
I overlaid GISTEMP from Wood For Trees on the NCA3 models to see how these models have fared since 2014:

The NSA3 models are in °F; so I had to stretch the GISTEMP image to fit the models…

The MONSTER 2016 El Niño barely spikes back to the “P50” range of the models. If I use HadCRUT4, the epic failure of the models is even more apparent.

HadCRUT4 clearly demonstrates that the observations are racing back down toward the bottom of the 5-95% probability band.
Yes… I know the datum differences between GISTEMP and HadCRUT4 make comparisons problematic. And I know that I should have converted the temperature data to °F to match the models. But, if I did all that, the Red Team wouldn’t have anything left to do in order to “stick a fork” in this piece of schist.
Addendum
Now that I’ve taken a closer look at the NCA4 draft, there is clear evidence of Adjustocene shenanigans.
https://debunkhouse.files.wordpress.com/2017/08/nca_07.png
They adjusted the observations to match the model in the current draft report.
https://debunkhouse.files.wordpress.com/2017/08/webp-net-gifmaker-2.gif
Vanguard to request climate change impact from corporations.
http://mobile.reuters.com/article/amp/idUSKCN1AU1KJ
Every company can honestly reply – regardless of whether they believe in CAGW : “None. Climate Change will have no noticeable effect within the timescale of our business forecasts”. I think this proves that Vanguard lied when they said their question was not ideologically driven. OK, it’s not their ideology, it’s someone else’s. But it’s still ideology.
Thanks, David. Always interesting to see the models vs Reality comparison. Doesn’t look like a major CAGW event, does it?
It would look even less like CAGW if the “projections” went back to when they were first projected!
+1
what he said
It never does… SOP for extravagant claims supported by little more than arm-waving.
The latest draft began with the admission that the conclusions drawn in the report reflected the “judgment” of the authors. In other words, a small group of people just reviewed a whole lot of published papers and used their opinion to make conclusions not found in any of the individual papers they reviewed.
What self-respecting scientist would adopt a procedure for drawing scientific conclusions so prone to confirmation bias?
The IPCC?
That motley crew call themselves “climate scientists.”
Expert Judgement is the basis of the IPCC claims of likely very likely, etc. The experts making these judgements are of course………
In “The Greenhouse Delusion” – Chapter 6, by Dr Vincent Gray, he commented on Computer Climate Models
“Instead of validation, and the traditional use of mathematical statistics, the models are “evaluated” purely from the opinion of those who have devised them. Such opinions are partisan and biased. They are also nothing more than guesses. Attempts have been made to attach spurious measures of precision to these guesses.
“In this Summary for Policymakers and in the Technical Summary, the following words have been used where appropriate to indicate judgmental estimates of confidence: virtually certain (greater than 99% chance that a result is true); very likely (90-99% chance): likely (66-90% chance); medium likelihood ( 33-66% chance); unlikely ( 10-33% chance); very unlikely (1-10% chance); exceptionally unlikely (less than 1% chance).”
They confess “We fully recognise that many of the evaluation statements we make contain a degree of objective scientific perception and may contain much “community” or “personal” knowledge. For example, the very choice of model variables and model processes that are investigated are often based upon the objective judgement and experience of the modelling community”
In truth, all of their evaluation is subjective, and since it is made by the modelling community itself, suspect.”
How many times can they build a false narrative and get away with it? At what point will the people realize the sky isn’t falling? Makes you wonder.
Maybe when Sol wears eclipse glasses?
And to add to the embarrassment, RCP8.5 is in reality no different than RCP2.6… The atmospheric carbon dioxide growth rate has been tracking with temperatures of the southern ocean for over half a century:
http://www.woodfortrees.org/graph/plot/esrl-co2/from:1958/mean:24/derivative/plot/hadsst3sh/from:1958/scale:0.25/offset:0.1
If the future is anything like the past half+ century, then the growth rate will continue to track with temperature regardless of which RCP scenario happens. (shouldn’t we wait until this correlation breaks down before enacting expensive policies?)…
David, doesn’t the use of fahrenheit make u.s. look like a bunch of hicks?(☺)
I would say no. Fahrenheit is superior to Celsius in many ways: it is a far finer measure (a degree C is nearly twice the size of a degree F). Zero in Celsius is the freezing point of fresh water at sea level and under no other circumstance. Zero in Fahrenheit is the true freezing point of all water, regardless of pressure or previous motion. Besides, I like F temps better than C: 90 really sounds hot, and 0 really sounds cold. We are not the hicks: we are the ones who know what to hold fast to. The supposed superiority of the metric system is, at least in part, snobbery rather than science. Think back to some of the “scientific” measurements adopted after the French Revolution; thank goodness, most of them are gone.
The French Revolution shortened some of their best scientists by about 25 cm.
Interestingly Anders Celsius proposed zero to be the boiling point of water at normal pressure and 100 to be the freezing point of water. Upside down, if you like. Maybe the Celsius scale should be named the suislec scale.
Who wants to model the French?
I want a French model!
noaaprogrammer
Male or Female? 🙂
ooo la la
It always amuses me on graphs like this how well the modeled historical data matches the observations, but from the moment the the future part kicks in, the modeled plot immediately starts to diverge from the observations. It’s been like this for decades. Yet, I am told that there is no curve fitting going on with the past climate.
I am told that the models are just showing significant skill at hindcasting. That is really remarkable. The models can pretty much nail what has happened in the past but have no skill with the future, and it has been like this for almost 30 years! The obvious explanation is that there is a temporal barrier we call ‘now’, that separates two types of climate. On one side of the barrier is a type of climate that climate models can model well. On the other side of the barrier is a completely different type of climate, with obviously different physical laws, that the same models can no longer model. For example, today’s climate models will have no skill at projecting conditions for 2027, but in 2037, these same models will hindcast 2027 very accurately.
Does anyone else find this amazing! (sarc/off)
There’s a very simple explanation. It takes about ten years after a thermometer first records a reading for the adjustments to tell us what that reading really meant. Once that final and necessary step occurs, all your model-to-observation angst will just wash away.
Yes…I am looking forward to the article ‘Why it takes decades to correctly read a thermometer’. That should be very enlightening. Yet, even the manipulation of recorded temperatures cannot entirely explain the uncanny ability the climate models have at hindcasting. We all know that not a single model captured the observed ‘pause’ in warming atmospheric temperatures through the first part of this Century. Not one. But you can rest assured that similar graphs in the NCA5 will show the hindcast model output very close to the ‘observed’ line from 2000 to 2015 (where no model has gone before).
I don’t think it is a conspiracy, but if it was a conspiracy, it would look just like this.
Ha, so true with this crowd.
“But you can rest assured that similar graphs in the NCA5 will show the hindcast model output very close to the ‘observed’ line from 2000 to 2015 (where no model has gone before).”
Again, that’s easy. They are going to adopt a longer low pass filter, say a 10-year running mean instead of a 5-year running mean. which in conjunction with the adjustments to the temperature record, will show a nice tidy graph where there was no pause after all, but just an upwards slope that the models can be tuned to match.
Nah, the models never will change. It will take about 10 years for the “poor quality” observed data to be homogenized to fit the models. We are already seeing the pause, slowly disappear, as it gets homogenized away.
In 20 years, we will all be freezing to death, and starving because new grains are designed to work in the projected warm weather and yet we will still be told 2037 is the hottest year ever by .01 degC
“Does anyone else find this amazing!” +1 that they think they are getting away with it. The models have been around for about 30 years so the record isn’t a secret.
It takes a complicit media to continue the charade.
They are new and improved versions of the model that no track very well the last bunch of years, and our doom is so much more certain.
Abject nonsense or English translation failure.
They are new and improved versions of the model that now track very well the last bunch of years, and our doom is so much more certain. “no” should have been “now”.
Abject nonsense.
The models aren’t getting better. Even when they start the model run in 2006, the observed temperatures consistently track at or below the low end 5-95% range. Observed temperatures only approach the model mean (P50) in 2006, 2015 and 2016.


The ensemble consists of 138 model runs using a range of representative concentration pathways (RCP), from a worst case scenario RCP 8.5, often referred to as “business as usual,” to varying grades of mitigation scenarios (RCP 2.6, 4.5 and 6.0).
https://www.climate-lab-book.ac.uk/comparing-cmip5-observations/
When we drill wells, we run probability distributions to estimate the oil and gas reserves we will add if the well is successful. The model inputs consist of a range of estimates of reservoir thickness, area and petrophysical characteristics. The model output consists of a probability distribution from P10 to P90.
P10 = Maximum Case. There is a 10% probability that the well will produce at least this much oil and/or gas.
P50 = Mean Case. There is a 50% probability that the well will produce at least this much oil and/or gas. Probable reserves are >P50.
P90 = Minimum Case. There is a 90% probability that the well will produce at least this much oil and/or gas. Proved reserves are P90.
Over time, a drilling program should track near P50. If your drilling results track close to P10 or P90, your model input is seriously flawed.
If the CMIP5 model ensemble had predictive skill, the observations should track around P50, half the runs should predict more warming and half less than is actually observed. During the predictive run of the model, HadCRUT4.5 has not *tracked* anywhere near P50…
Note that during the 1998-99 El Niño, the observations spiked above P05 (less than 5% of the models predicted this). During the 2015-16 El Niño, HadCRUT only spiked to P55. El Niño events are not P50 conditions. Strong El Niño and La Niña events should spike toward the P05 and P95 boundaries.
The temperature observations are clearly tracking much closer to strong mitigation scenarios rather than RCP 8.5, the bogus “business as usual” scenario.
The red hachured trapezoid indicates that HadCRUT4.5 will continue to track between less than P100 and P50. This is indicative of a miserable failure of the models and a pretty good clue that the models need be adjusted downward.
In any other field of science CAGW would be a long-discarded falsified hypothesis.
https://wattsupwiththat.com/2017/04/17/the-good-the-bad-and-the-null-hypothesis/
Sorry, I didn’t think I needed to post my sarcastic intent. We agree.
Then, you have my sincere apologies. As an aficionado of subtle sarcasm… I can’t believe I missed it.
“Strong El Niño and La Niña events should spike toward the P05 and P95 boundaries.”? I disagree. If we really understood how the climate works, the models would predict El Nino and La Nina events. The fact that they don’t is another indicator of how poorly we understand it and how unreliable the models are.
Strong ENSO events are P05 (El Niño) and P95 (La Niña) conditions. The model ensemble is a probabilistic distribution. If it had predictive skill, the observations would track the model- mean (P50) most of the time and deflect toward P95 syrong La Niña events and P05 during strong El Niño events.
In reality, the observations track near P95 and revert toward the mean (P50) during strong El Niño events when they are run in predictive modes.
As a recent article on this site stated, the only time a model’s ability to hindcast temperatures should be considered evidence of it’s predictive skill is if it’s the only model able to hindcast temperatures.
If you can hindcast temperatures with any one of 1000 models, none of them can be trusted to predict future temperatures with any skill at all.
With a dozen or so parameters, fitting the past is easy.
Especially since our historical knowledge of these parameters is weak at best.
PS: The fact that the different models have to use wildly different values for these various parameters is just more evidence that none of them are worth anything.
What is actually amazing is the fact the modelers can’t “pretty much nail what has happened in the past.” Look at the ups and downs of the early 20th Century not captured by the models. Look at the differences between the models and the pre-2006 21st Century, a period over which the modelers had the actual data and got it wrong anyway. Look at the fact the IPCC AR5 had to reduce the nearer-term “projections” downward from those calculated in the models. IPCC climate models are bunk.
David, the talk about the Red Team makes me want to post my favorite choice for a non-obvious member:
Sergey Kravtsov – PhD, Physical Oceanography, Florida State, 1998
He has an excellent understanding of the CMIP-5 models and has done extensive evaluations of them at a far more granular level than you do in this post.
He was the lead author in 2015 on a paper that Judith Curry was a co-author on: “Comment on “Atlantic and Pacific multidecadal oscillations and Northern Hemisphere temperatures””
Michael Mann was an author of the paper they were commenting on.
He was a doctoral adviser to Marcia Wyatt who came up with the Stadium Wave Theory.
In April 2017 he published “On semi-empirical decomposition of multidecadal climate variability into forced and internally generated components”
Which ends with “To conclude, state-of-the-art climate models are characterized by a substantial model uncertainty, large sensitivity to aerosol and cloud parameterizations and a possible lack of feedbacks that could amplify multidecadal internal variability, which impedes clear attribution of the observed 20th century climate change.”
He followed that up in June 2017 with “Pronounced differences between observed and CMIP5-simulated multidecadal climate variability in the twentieth century”
In part he says: “the models underestimate the magnitude of the observed variability and misrepresent its spatial pattern. Therefore, our ability to interpret the observed climate change using these models is limited.”
Hi greg
Pls send this note to scott pruitt
Lastname dot firstname at epa dot gov
+Eleventy gazillion!
sent
Greg,
You are to Red Team recruiting, what Billy Beane is to Money Ball!
(The Billy Beane reference was a HUGE compliment.)
Thanks David. As you would guess, I read the book. I’m both a baseball fan and math fanatic, so Billy Beane is indeed accepted as a huge compliment!
I was a Bill James and Strat-o-matic Baseball junkie back in the late 80’s, early 90’s.
The cool thing about Sabermetrics is that it’s all about putting together the best team, rather than the best players… Very Herb Brooks… 😎
David, sounds like you qualify as a baseball and math fanatic! I didn’t hear about Sabernetics until the book came out.
I lived for baseball stats in the late ’80s. This and a degree in Earth Science were my gateway drugs to climate science… 😂
I just noticed Kravtsov has another paper pending publication:
Comment on “Comparison of low-frequency internal climate variability in
2 CMIP5 models and observations” (Dated 28 June 2017)
https://people.uwm.edu/kravtsov/files/2016/05/K2017_Comment-18h8t6r.pdf
[Supplemental info: https://people.uwm.edu/kravtsov/files/2016/05/K2017_Comment_Supplement-1hwvw1g.pdf%5D
“an alterative methodology based on forced signals computed from individual model ensembles produces a much more accurate estimate of the ICV [internal climate variation] in CMIP5 models, whose magnitude is consistent with the PI [pre-industrial] control simulations and is much smaller than any of the semi-empirical estimates of the observed ICV on decadal and longer time scales.”
I believe that sentence is saying he took the CMIP5 model collection and removed the industrial drivers of CO2, aerosols, etc. to see how they behaved. He found they had much less variation than the real world pre-industrial climate.
In other words, natural variation is far too small in the CMIP5 models on decadal and longer time scales.
Kravtsov is really on a roll in 2017 for publishing papers highly critical of the CMIP5 modeling of natural variation.
I hope his work makes it into the IPCC AR6 report in a couple years. It certainly should, but I fear they will cherry pick AGW supporting papers and ignore Kravtsov’s work.
Great post, well written
And with all the relevant links
Thanks
Wouldn’t it be better to use real data when compared to the projections, not skewed / fake data??
What? Am I supposed to so Pruitt’s job for him?
I don’t believe in any of the government data, or models. I was in the Navy and know how data can be manipulated…
J. Philip. I know very well what you say. After 10 years in the USAF an 30 years with the USN. I have been trying to think of any information that was collected by these government agencies that was true. Everyone involved in the formation of data had some reason to “fudge it” and it was. Why should any government agency be any different. We were directed by our supervisors to do so. To my recollection the only person who ever suffered for data manipulation was a senior Marine officer who was found to be fiddling with the V22 Osprey maintenance or operational data. Just like everyone else was and always have been doing.
Here is an opportunity for the Trump Administration to use the Red Team/Blue Team approach to debate the correct interpretation of the scientific data within the draft report. It appears that the data could support alternative conclusions regarding the accuracy and credibility of climate models, as opposed to real data.
Mydrrin…I am assuming this should read “They are new and improved versions of the model that NOW track the last bunch of years very well, and our doom is so much more certain.” And I am assuming this is sarcasm.
I am unaware of continious scientific advances in our understanding that allow modelers to update thier models every few years and then nail the recent past, but still have no impact on their ability to model the future. They are obviously tweeking parameters, like aerosols or cloud albedo, to cover the AGW theory’s misdeeds of the past and get a good curve fit, but it is completely AGW theory from here on out.
The models have no skill to forecast or hindcast, but at least they have a ‘past’ to adjust the models with, giving those with no memory the illusion that there is some skill there.
It seems to me that you conflate two issues. ENSO are natural phenomena caused by Solar irradiance heating the oceans. Possibly a factor of subtle changes in cloud cover, but could be caused and or contributed by subtle changes in wind and/or oceanic current patterns.
This you conflate with changes to global dimming/brightening caused by varying manmade aerosol emissions, particularly SO2.
Whilst I consider that aerosols may well have played a role in the post 1940s cooling and the 1970s warming, I consider this a long way short of substantiating a claim that all ENSO events since 1850 are manmade. You very much over egg the case.
David:
You referred to the 2016 “El Nino” twice in your post.
Since it can be proven that all El Ninos since 1850 are man-made events, it would seem to be prudent to address the cause of their formation, insofar as possible, to avoid their re-occurrence in the future.
The red team should be able to defeat the blue team on other grounds, but global warming would still be with us, without further action.
I love good sarcasm!
David:
“I love good sarcasm”
A strange reply!
I expected you to challenge me to prove my assertions, which I can easily do.
Well then… prove away.
David:
“Well, then prove away”
The proof is really very simple.
Since 1850, there have been 31 American Business recessions, and 2 Depressions.
EACH has coincided with a temporary increase in average global temperatures, due to fewer SO2 aerosol emissions into the atmosphere because of the reduced industrial activity.
The cleaner air allows sunshine to strike the Earth’s surface with greater intensity, causing increased surface warming.
As would be expected, these temporary peaks in temperature also coincide with the peaks in ERRST sea surface temperature.reconstructions.
And all El Ninos since 1850 have coincided with the ERSST sea surface peaks, except since about 1970, when .there have been El Ninos not coincident with a recession.
These, instead, are, unfortunately, caused by worldwide Clean Air efforts to reduce SO2 aerosol emissions from fossil fuels.
For the relevant graphs, Google “Climate Change Deciphered”, and also see Dr. Mark Canes’s graph of the El Nino3 Index in “El Ninos and La Ninas and Global Warming”, Fig. 2,. by D. Rapp (2014)
So… You were being sarcastic.
David:
You said “So you were being sarcastic”
No, just attempting to enlighten you with some obscure FACTS.
Apparently a lost cause.
“Burl Henry August 14, 2017 at 6:28 pm
David:
You referred to the 2016 “El Nino” twice in your post.
Since it can be proven that all El Ninos since 1850 are man-made events,…”
I, as I am sure many, would like to see your proof that isn’t model based.
That’s quite a theory, how did the industrial aerosols regional to the north-east of the US find their way to over the tropical Pacific Ocean?
What I want to know is… What drove the Madden-Julian Oscillation (MJO) before 1850?
You asked “What I want to know is…what drove the Madden-Julian Oscillation (MJO) before 1850.
Primarily volcanic activity, or the cessation thereof (this was the end of the Little Ice Age).
Chris Hanley:
You said “how did the industrial aerosols regional to the north-east of the US find their way to over the tropical Pacific Ocean”
You perhaps are aware of the expression “When Uncle Sam sneezes, the rest of the world catches a cold”
The point is that reduced industrial emissions would not be confined to just the north-east of the United States, but would occur over most of the northern hemisphere, and, of course, the global air circulation would quickly spread the less polluted air around the globe.
You also said “That’s quite a theory”
No, it is NOT a theory, just a recitation of the FACTS. Like it or not, the correlations are real, and must not be ignored.
As discussed in “Climate Change Deciphered” decreases in SO2 emissions precisely match the rise in average global temperatures, 1975-2011 (per latest data currently available)..
The model projections are already roadkill. NASA GISS and NOAA monthly data show the temperature data went back down to their previous baselines, did a “dead car bounce”, and returned back to their baselines.
We need only to wait for the smoothed, or annual data to catch up. This puts the observed line right at the bottom of the range, if not below.
Quite.
And the ENSO meter is now tracking neutral, and that suggests that September temps will not rise. Whether because of lags this has had an impact on August temps is yet to be seen.
Some agencies are giving odds on a La Nina just around the corner so the end of 2017/early 2018 could be interesting.
There could be problems for the writing of AR6 should the PAUSE reappear..
Dead car bounce? Don’t you mean dead cat bounce? Maybe you Aussies have different sayings. A tyre pulled from the bonnet and rollilng downhill gathers no detritus.
I’m noticing on the Enso meter that it is going down. ….. hmmmmm …. wonder what that foretells of the future temp trend. ….. pre adjustment of course.
“The NSA3 models are in °F; so I had to stretch the GISTEMP image to fit the models…”
You don’t need to do all that. Draft 3 of the new report has a corresponding diagram 1.6:
It’s CMIP5 rather than NSA3, so doesn’t hae as long a predictive period, but you can check that the model mean is much the same. And it shows the observations currently very close to the mean.
Now I’m sure some will say, that is just the El Nino. But the downward deviation was also brief, and could equally be attributed to the 2011/2 La Nina. After the Nino, it may slip back somewhat, but so far, they are still well up there.
Thanks Nick. I’ll replot it tomorrow. But the central point will hold. The observations only match the model mean during strong positive ENSO events.
Government and academic exceptions not withstanding, in real science, this is a falsification of the hypothesis.
Nick,
NSA3 was a typo. Should have been NCA3, which compared observations to CMIP3 and CMIP5… too many acronyms and abbreviations… 🙃
The deadline for submission for CMIP5 was July 31, 2012, so 97% of what you have plotted, Nick, is not only meaningless, but also incredibly misleading (and includes an El Nino event which has nothing to do with CO2). You are trying to imply a long-term predictive accuracy for these models that simply does not exist, in fact quite the contrary. None, and I mean not one of the CMIP models predicted the eighteen year pause when the original predictions\projections were made..
And to suggest that we know the global temperature in 1860 to one tenth of a degree Celsius, as your graph suggests, is equally ridiculous and absurd.
Reg N,
“The deadline for submission for CMIP5 was July 31, 2012, so 97% of what you have plotted, Nick, is not only meaningless, but also incredibly misleading”
How so? The diagram I posted was just the NCA4 version to compare with the NCA3 plot shown in the head post. The NCA3 use of past data froze in 2006. And as for the El Nino, that’s just part of the climte record. Like the 2011/2 La Nina which caused the observations to undershoot the modelling in that period.
Nick… The point is that ENSO maxima and minima *should* cause the modelling to undershoot and overshoot the observations.
In Ed Hawkins’ CMIP5 example, the 1998 El Niño spikes to the top of the 5-95% probability band. The 2016 El Niño just reverts to the mean in both Ed Hawkins’ example and NCA3.
Still milking the el nino spike hype, huh nick? Obviously we’re going to have to wait and see yet where temperatures go from here. Spencer already has his globals temps squarely ensconced where they were since ’03. (so his pause is already back) Let’s see where loti(s) go from here. Honestly, nick, you shouldn’t be setting yourself up to fail like that. (you’re likely to end up looking more like a goat than a hero)…
My grandmother would’ve been so relieved to learn that the Dust Bowl was just a figment of her imagination.
I never understood the fascination with means, as when you look at the scatter of how they are made up and the fact that there is only so many realistic values it can come out at, it makes it meaningless to look at a mean. Surely if the science put into the models was an accurate reflection of the system, you would have individual runs in the suite being correct year on year, rather than some being right one year, some being right another year, and then using a mean 10 years later to say they were right, as surely they were all actually wrong.
All models are wrong to some degree.
The purpose of running an ensemble of models, Monte Carlo simulations, etc. is to obtain a probability distribution.
If your range of assumptions is reasonable, subsequent observations should track near the model mean. When we drill prospects, we estimate the maximum (P10) and minimum (P90) likely ranges of reservoir area, thickness, porosity, permeability, etc. This gives us a probability distribution of the volume of oil and gas we are likely to produce from a well.
If we drilled 20 wells and they all resulted in p90 volumes, our assumptions would have been overly optimistic. If we drilled 20 wells and 16-18 fell between p33 and P67, with 1-2 P90 and 1-2 P10, our assumptions would have been reasonable and we would be really happy with having hit 1-2 P10’s.
The temperature observations consistently track near the model ensemble’s P90 and revert to P50 during strong El Nino events (which are more like p05-p10 conditions).
Hi David,
I appreciate the reply, but I believe that the realitically possible values means that some models are always likely to be close to any given year and that the range of realistically possible values would therefore get lost in any margin of error. This is especially true in hind casting and say the next 5 years.
Added to that, supposedly model runs are based on different assumptions or a different level of forcing assumption, so the fact individual runs are correct some years and incorrect other years just highlights the fact that it is completely unreliable and that there is a bigger chance of them all being wrong. This will become more apparent over time, as it would only take nature not cooperating for just a few years to send things massively off.
If I guessed where a football team will finish in a league once out of ten years, am I successful in predicting a result? Nope.
If ten people guess and each of them is correct once, were they successful in predicting a result? Maybe as a mean, but each of them was wrong 90% of the time.
The model runs are based on an array of different assumptions, in much the same manner that we model prospective hydrocarbon accumulations. The purpose of the model ensemble is to produce a probability distribution. If your range of assumptions are good, subsequent observations or drilling results should track around the model mean (P50).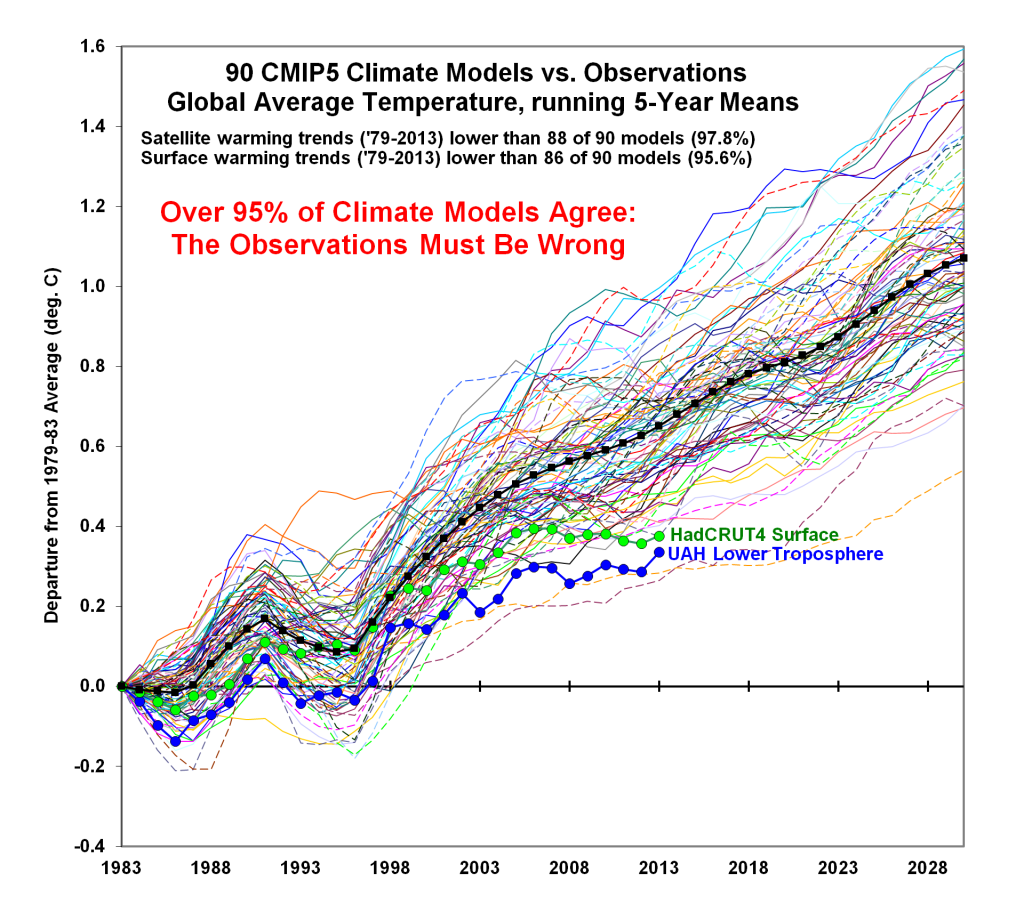


From The Good, the Bad and the Null Hypothesis…
Since it is impossible to run a controlled experiment on Earth’s climate (there is no control planet), the only way to “test” the CAGW hypothesis is through models. If the CAGW hypothesis is valid, the models should demonstrate predictive skill. The models have utterly failed:
Figure 14. “95% of Climate Models Agree: The Observations Must be Wrong.” http://www.drroyspencer.com/2014/02/95-of-climate-models-agree-the-observations-must-be-wrong/
Figure 15. “Climate models versus climate reality.” Michaels & Knappenberger. https://judithcurry.com/2015/12/17/climate-models-versus-climate-reality/
The models have failed because they result in a climate sensitivity that is 2-3 times that supported by observations:
Figure 15. Equilibrium climate sensitivity: Reality vs. Models. https://judithcurry.com/2015/12/17/climate-models-versus-climate-reality/
From Hansen et al. 1988 through every IPCC assessment report, the observed temperatures have consistently tracked the strong mitigation scenarios in which the rise in atmospheric CO2 has been slowed and/or halted.
Apart from the strong El Niño events of 1998 and 2015-16, GISTEMP has tracked Scenario C, in which CO2 levels stopped rising in 2000, holding at 368 ppm.
Figure 16. Hansen’s 1988 model and GISTEMP.
The utter failure of this model is most apparent on the more climate-relevant 5-yr running mean:
Figure 17. Hansen’s 1988 model and GISTEMP, 5-yr running mean.
This is from IPCC’s First Assessment Report:
Figure 18. IPCC First Assessment Report (FAR). Model vs. HadCRUT4.
HadCRUT4 has tracked below Scenario D.
Figure 19. IPCC FAR scenarios.
This is from the IPCC’s Third Assessment Report (TAR):
Figure 20. IPCC TAR model vs. HadCRUT4.
HadCRUT4 has tracked the strong mitigation scenarios, despite a general lack of mitigation.
The climate models have never demonstrated any predictive skill.
And the models aren’t getting better. Even when they start the model run in 2006, the observed temperatures consistently track at or below the low end 5-95% range. Observed temperatures only approach the model mean (P50) in 2006, 2015 and 2016.
Figure 21. Climate Lab Book. Comparing CMIP5 & observations.
The ensemble consists of 138 model runs using a range of representative concentration pathways (RCP), from a worst case scenario RCP 8.5, often referred to as “business as usual,” to varying grades of mitigation scenarios (RCP 2.6, 4.5 and 6.0).
Figure 22. Figure 21 with individual model runs displayed.
SOURCE
When we drill wells, we run probability distributions to estimate the oil and gas reserves we will add if the well is successful. The model inputs consist of a range of estimates of reservoir thickness, area and petrophysical characteristics. The model output consists of a probability distribution from P10 to P90.
P10 = Maximum Case. There is a 10% probability that the well will produce at least this much oil and/or gas.
P50 = Mean Case. There is a 50% probability that the well will produce at least this much oil and/or gas. Probable reserves are >P50.
P90 = Minimum Case. There is a 90% probability that the well will produce at least this much oil and/or gas. Proved reserves are P90.
Over time, a drilling program should track near P50. If your drilling results track close to P10 or P90, your model input is seriously flawed.
If the CMIP5 model ensemble had predictive skill, the observations should track around P50, half the runs should predict more warming and half less than is actually observed. During the predictive run of the model, HadCRUT4.5 has not *tracked* anywhere near P50…
Figure 23. Figure 21 zoomed in on model run period with probability distributions annotated.
I “eyeballed” the instrumental observations to estimate a probability distribution of predictive run of the model.
Prediction Run Approximate Distribution
2006 P60 (60% of the models predicted a warmer temperature)
2007 P75
2008 P95
2009 P80
2010 P70
2011-2013 >P95
2014 P90
2015-2016 P55
Note that during the 1998-99 El Niño, the observations spiked above P05 (less than 5% of the models predicted this). During the 2015-16 El Niño, HadCRUT only spiked to P55. El Niño events are not P50 conditions. Strong El Niño and La Niña events should spike toward the P05 and P95 boundaries.
The temperature observations are clearly tracking much closer to strong mitigation scenarios rather than RCP 8.5, the bogus “business as usual” scenario.
The red hachured trapezoid indicates that HadCRUT4.5 will continue to track between less than P100 and P50. This is indicative of a miserable failure of the models and a pretty good clue that the models need be adjusted downward.
In any other field of science CAGW would be a long-discarded falsified hypothesis.
Hi David,
I agree with your point, but I guess what I’m saying is that in those 10% or 15% were right and the rest were wrong, the chances are those 10% were right based on pure luck rather than anything it was getting right. That’s because there are only so many possible scenarios to arrive at and there are so many individual runs trying. For something to be considered right, I’d want to see the same model run in that 10% or 15% each and every year, or at the very least, more than 80% of the time.
If it was pure luck, the models would randomly miss high and low. They don’t. The models precisely miss high. This is a systemic problem.
Nobody seems to talk about this, but an accurate climate model that included correct descriptions of most of the major mechanisms driving the climate would only require one model. It would have variability similar to observations and both observations and model would consistently track with the P5-P95 band as new observations became available.
It is nonsensical to average 101 models that don’t track each other or the observations and expect to get useful information about the future state of the climate. It’s also nonsense to write a model of a chaotic system and expect anything more useful than- we expect the future climate to consist of glaciations of 80-120,000 years that reach -10C interrupted by warming periods of 10-20,000 years where the temperatures reach 6C.
Whilst our ability to predict ENSO events is very poor, the agencies are no longer predicting an El Nino for 2017 (which would have been a double El Nino following on from the back of the strong 2015/16 El Nino).
Instead, the outlook favours a La Nina. If that comes to pass and if it is a strong La Nina and/or one that persists for a reasonable time the PAUSE will reappear and will be 20 years in duration.
As the PAUSE reappears it follows that the divergence between model projection and reality will widen, because the presence of the PAUSE suggests Climate Sensitivity must be lower than that built into the models. This is why they run hot.
Let us see what happens with ENSO.
Nick,
Which part of the CMIP5 ensemble is historical? When does the predictive run start?
You’re using the wrong metrics. Begin with cynical reasoning to prop up the bureaucracy… The rest is left as an exercise for the reader.
wow so many mistakes.
The model projections are for GLOBAL TAS.. thats global air temps at 2m
The Observations you used ( and they used)
A) Are not GLOBAL ( you have to mask them)
B) Are SAT And SST
When you use the right data and MASK properly, then you’ll see how close the model of models got.
What you really want to do is compare individial models.
“What you really want to do is compare individial models.”
Ahhh, so nice that someone understands this.
Steve,
Maybe you can cite an example?
Wow- somebody with a small modicum of understanding of climate science on this website. Never thought I would see the day…
We’ve already got this statement in another article on this site:
“Environmental Protection Agency chief Scott Pruitt said his staff will gauge the “accuracy” of a major federal science report that blames human activity for climate change — just days after researchers voiced their fears to The New York Times that the Trump administration would alter or suppress its findings.”
Isn’t that political interference? Because this is not an assessment by Federal scientists at the EPA – that’s already been done at the report stage…
It’s not an independent assessment by any scienists. It’s a regurgitation of the IPCC’s crap by Federal “scientists,”
Which independent scientists working for or in the EPA will review it then?
and why would they reach a different conclusion?
a lot of this report is about observed effects, not models, isn’t it?
There are no “independent” scientists working for the EPA. The “report” is a rehashing of IPCC crap as it pertains to the US.
This is from the current draft of the report:
https://assets.documentcloud.org/documents/3920195/Final-Draft-of-the-Climate-Science-Special-Report.pdf
So what? The Earth has been warming up from the Little Ice Age since about 1600 AD. The fact that the “average annual temperature over the contiguous United States has increased by 1.2°F (0.7°C) for the period 1986–2016 relative to 1901–1960” falls under the bleeding obvious.
Their “medium confidence” claim that “recent decades are the warmest of the past 1,500 years” are based on Mannian Hockey Stick reconstructions.
Mann, M.E., Z. Zhang, M.K. Hughes, R.S. Bradley, S.K. Miller, S. Rutherford, and F. Ni, 2008: Proxy-based reconstructions of hemispheric and global surface temperature variations over the past two millennia. Proceedings of the National Academy of Sciences, 105, 13252-13257.
http://dx.doi.org/10.1073/pnas.0805721105
Mann is cited at least five times. While none of the competent reconstructions are cited (Moberg, Esper, Ljungqvist, etc.).
These “findings” are then misreported by the media:
https://www.usatoday.com/story/opinion/2017/08/14/climate-change-trump-administration-editorials-debates/562985001/
A “medium confidence” finding from a fraudulent reconstruction becomes a fact according to the USA Today.
The ENSO cycle has yet to complete with a full blown La Nina.
For quite some time the ENSO meter has been tracking around the +0.5 degC mark but these past two weeks it has slipped back to Neutral. The agencies had suggested that El Nino in 2017 was probable ( this would have meant a double El Nino following on from the back of the strong 2015/16 El Nino). However, they have now pulled back on that prediction
It is now claimed that a La Nina is a real possibility. Obviously, our predictive powers/models are hopeless at predicting in an advance the ENSO cycle.
Whilst we cannot predict whether we will have a La Nina in 2017/early 2018 , we can predict what will happen if we have a strong La Nina or one that persists for a long time. If we do have such a La Nina, the PAUSE will reappear but will by then be around 20 years in duration.
That will be extremely embarrassing for this report, and it will make AR6 difficult to write. As the pause reappears, it becomes ever more obvious that Climate Sensitivity to CO2, if any at all, is low. It also shows an ever widening gap between model projections and observation. It emphasises that model projections are unreliable because they run too hot because they have over egged Climate Sensitivity.
In conclusion 2017 could prove interesting if a La Nina develops. Watch this space as they say.
They’ll just reset the start date of the predictive run of the model, putting the La Niña at P50. This will enable them to claim that the models confirm that everything is worse than previously thought.
David, any evidence they have done that previously? Not asking to be a troll, just curious, as so many adjustments to the temperature series happen, I just wondered if adjustments to the model series happen as well.
I was being somewhat sarcastic… But they do periodically re-initialize the models. I was being sarcastic when I said they set the P50 at La Nina events.
I don’t think they intentionally fudge the models. And I don’t think most of the modelers grasp the full meaning of the relationship of temperature observations to the model probability distributions.
In the private sector, this is an utterly failed model:
http://images.remss.com/figures/climate/RSS_Model_TS_compare_globev4.png
http://www.remss.com/research/climate
In government and academia, it’s just off a little bit.
In the private sector, “Mike’s Nature Trick” gets you fired, probably sued and possibly prosecuted for fraud. In government and academia, it’s “a statistical method used to bring two or more different kinds of data sets together.”
Now that I’ve taken a closer look at the NCA4 draft, there is evidence of Adjustocene shenanigans.

They adjusted the observations to match the model in the current draft report.
That sums it up very well, David.
That’s really CREEPY, David (just plain ‘orwellian’ creepy)…
Do industrial engineering red-teams commonly investigate scenarios where they assume the blue-team will lie through their teeth, including lying about the red team? I have my doubts, but would gladly learn otherwise.
It seems to me that the game theory of the red team/blue team is predicated upon an industrial setting where both teams work for the same company and both have an incentive and desire for the company to do well and prosper.
No such ethos exists in the game of death-by-climate. The blue team are actually aiming to lose. By some strange calculus they think they might win personally, but they actually want ‘the company’ to fail. They actually want Western post-industrial civilisation to decline and regress.
Trump and Pruitt need to bear in mind that one side of any red team/blue team approach is, a priori, committed to not playing by Queensbury Rules.
Add an extra rule:
Anyone found to have been lying (even at any time in the remote future) will be fined $100K and spend 2 years picking up litter on the streets in stripey pink overalls wearing a dunces cap with media welcome to photograph every single day (but not speak to them).
In philosophical terms this article is an example of an “equivocation,” that is, an argument in which one or more terms change meaning in the midst of the argument. Though an equivocation looks like a syllogism it isn’t one. Thus though it is logically proper to draw a conclusion from a syllogism it is logically improper to draw a conclusion from an equivocation. To draw such a conclusion is the “equivocation fallacy.”
Abject nonsense.
Application of proof-by-assertion fallacy
That would be this comment…
An application of proof-by-assertion fallacy.
When this NCA was put together I suspect the people thought they were working only with other biased folks. As such they have used their typical cherry picking, half truths and favored data. Having it reviewed by real skeptical scientists and the review published by the EPA will tear a hole in their imaginary consensus.
If done right this could be a major win for skeptics.
Since their assessment treats the IGPOCC report as something to be deferred to, or virtually holy writ, it would be good to have Donna Laframboise on the red team, or on the bench anyway. Her two books, starting with “Delinquent,” rip away the emporer’s curtain.