![]() Energy
Energy

Michael Bastasch
Eastern China is in the midst of a two decade-long cooling trend, according to a new study, which labeled it a continuation of the “warming hiatus” that global temperatures experienced in the early 21st Century.
“During the past two decades since 1997, eastern China has experienced a warming hiatus punctuated by significant cooling in minimum temperature (Tmin), particularly during early-mid winter,” researchers with the China Meteorological Administration wrote in their July study.
An incredibly strong El Nino warming event largely ended the 15-year global warming “hiatus” in global average temperatures — and the two-decade hiatus in satellite data warming — but not in eastern China.
“There is no evidence indicating a termination of the recent warming hiatus in eastern China,” researchers found. “The question of when the accelerated warming trend will resume needs to be answered by climate model prediction.”
The study found from 1998 to 2013 “the domain-averaged Tmin exhibited the strongest cooling trend and the number of significant cooling stations peaked.” There was “significant cooling” in minimum temperatures through 2016 in northern China, the Yangtze-Huai River Valley and southern China.
“This sustained hiatus gave rise to increasingly frequent and severe cold extremes there,” researchers wrote.
“Concerning its prolonged persistency and great cooling rate, the recent warming hiatus over eastern China deviates much from most historical short-term trends during the past five decades, and thus could be viewed as an outlier against the prevalent warming context,” researchers stated.
The Chinese report comes amid media fervor over a new study claiming a less than 5 percent chance the Earth will avoid “dangerous” levels of global warming by the end of the century.
“The likely range of global temperature increase is 2.0-4.9 [degrees Celsius] and our median forecast is 3.2 C,” Adrian Raftery, the study’s co-author, told CNN.
“Our model is based on data which already show the effect of existing emission mitigation policies,” Raftery said. “Achieving the goal of less than 1.5 C warming will require carbon intensity to decline much faster than in the recent past.”
CNN warned that warming above 2 degrees Celsius above pre-industrial temperatures would result in “[r]ising seas, mass extinctions, super droughts, increased wildfires, intense hurricanes, decreased crops and fresh water and the melting of the Arctic are expected.”
“The impact on human health would be profound,” CNN reported. Rising temperatures and shifts in weather would lead to reduced air quality, food and water contamination, more infections carried by mosquitoes and ticks and stress on mental health.”
CNN reported on Raftery’s study ahead of a town hall the network was holding with former Vice President Al Gore to highlight his new film “An Inconvenient Sequel.”
Follow Michael on Facebook and Twitter
Content created by The Daily Caller News Foundation is available without charge to any eligible news publisher that can provide a large audience. For licensing opportunities of our original content, please contact licensing@dailycallernewsfoundation.org.
To be fair, it is probably all that pollution caused by coal power and making solar panels whot dunnit!
“a happy little debunker on August 3, 2017 at 5:11 am
To be fair, it is probably all that pollution caused by coal power and making solar panels whot dunnit!”
Happy, I thought the same thing. SO2 is a good light reflector. If you go visit, except to return home feeling under the weather.
If you go visit, don’t necessarily expect to get back home.
The company I used to work for had a research center in Beijing. After visiting there for a week or more, you would always come back with a cough. They called it the Beijing flu.
Here’s an Idea for Trump, Start selling China low Sulfur coal from some those semi idle mines in the west. And then sell them some of our modern scrubber technology. We can help clean up the planet and reduce our trade deficit at the same time.
So if this regional cooling is due to pollution dimming , the late 20th c. warming was probably due to global brightening due to the beneficial changes early environment rules made in cleaning up air and water quality. Also contributed to by purging of pollution from the stratosphere by Mt Pinatobu and El Chichon eruptions.
Cliff
There is an article on Judith Curry website – climate etc, about carbon forcing in the NH causing a temperature imbalance between the hemispheres. Based on model’s.
Yeah, at first I thought that, but I’d think that would cause daily highs to decrease, not decrease nite-time lows.
How soon will it be before the gate keepers adjust China’s temperature records upward under the excuse that they need to counter the effects of pollution?
Perhaps the Chinese meteorologists do not alter [cough] homogenize their meteorological observations to match their ‘climate models’ to justify their existence.
Are you coming down with the Beijing Flu?
Are you and Ian related? Lol
Just updated the Japanese temperatures to July. They ain’t going anywhere
+10…a new regional graph, thanks.
Looks like it’s going down slightly.
To be fair, I do have to point out much of Chinese cooling can likely be attributed to their very high levels of aerosols.
You mean the ones from the manufacturing of pseudo-renewables?
Low level aerosols have a significant warming effect. That is why orange Grove owners make smudge pot fires when the temperature drops just below zero.
My understanding is that the soot released into the atmosphere was the common belief, but not the actual function in how smudge pots protected crops.
Smudge pots, later clean burning gas fired pots disrupt pooling cold air and add minor warmth to the orchard grove, but mainly circulate and mix air.
Current technology focuses on wind machines aimed above the crops, disrupting and mixing upper layers of warmer air above pooling cold air with the lower cold surface layers.
When sufficient water is available, wind machine technology combined with misting the groves is effective at protecting crops.
Need to also concern ourselves with temperature pre-industrialization in China. The reconstruction quickly shows much warmer times and recovery from the little ice age.
http://www.weather.gov.hk/blog/en/img/20100625_fig1.jpg
http://www.weather.gov.hk/blog/en/archives/00000059.htm
Interesting cite of Chinese records.
Perhaps Steve Mosher may like to see that one.
Duncan, why not include the entire newspaper quote to accompany that graph?
The graph is based on the work of a meteorologist who passed on in 1974.
But the graph includes modern temperatures.
Basically, another nature trick where modern temperatures are pasted onto the end of someone’s subjective reconstruction.
That China experienced optimal weather conditions is proven by crops, freeze records and swallows. Exactly what the temperature and humidity profile was during those periods is guesswork.
Stick with China’s modern temperature tracking: Though it does have a rather odd appearance.
Interesting that the 2015-2016 El Nino spike is lower than earlier temperature spikes.
T-min….at night…when the sun doesn’t shine….when there’s no sunshine for aerosols to bounce back
….and flies in the face of global warming theory that says nights get warmer…..in China’s east that’s the most highly developed…and would have the highest UHI
Maybe if they switch to roll-on?
So much bullcrap, all in one place!
CNN. = 100% Bullcrap.
In this article, I mean.
“An incredibly strong El Nino warming event largely ended the 15-year global warming “hiatus” in global average temperatures — and the two-decade hiatus in satellite data warming — . . .”
As the two El Nino’s went up and down almost symmetrically, it had little effect on the running average and there really has been no significant warming since 1988, that’s 29 years. The hiatus is indeed over only because we are cooling, which started gently in 2002 and actively in 2006. China is simply experiencing what many others are denying.
This is the most interesting quote for me:
“Our model is based on data which already show the effect of existing emission mitigation policies,” Raftery said. Big ha ha. In other words, they are claiming that reduced emissions have already slowed temperature changes. Hmmn, meanwhile CO2 has slowly increased over 400 ppm, and the only place that has reduced its emissions is the US via substituting gas for coal.
This approach of course is in preparation for if / when temperatures turn downwards, and it will be claimed it is because of policies rather than natural variability. This needs to be pointed out loud and clear for the hypocrisy it is.
Oh, speaking of emissions, did you all catch that story that the UK is going to change over to all-electric vehicles in all categories by 2040? Does that mean that they’ll ban apartment tower fires, too?
Just a question about that: during the Industrial Revolution, London was more polluted than the rest of the country, but there were at least two episodes of 19th century winters so cold that the Thames froze over. Now, somehow, the pollution and bitterly cold winters seem to refute the climate change theories of these control freaks, so what gives?
Sara
What gives is that the cagw folk’s are trying to fit a theory, based on assumptions, into reality.
It is similar to the ozone hole expert’s, with all confidence telling us the hole as they call it will heal by 2060, and yet they cannot predict what this year’s size will be, or any other year.
Same sort of scientific voo doo.
Exactly!
The Stadium Wave Theory calls for regional differences like that: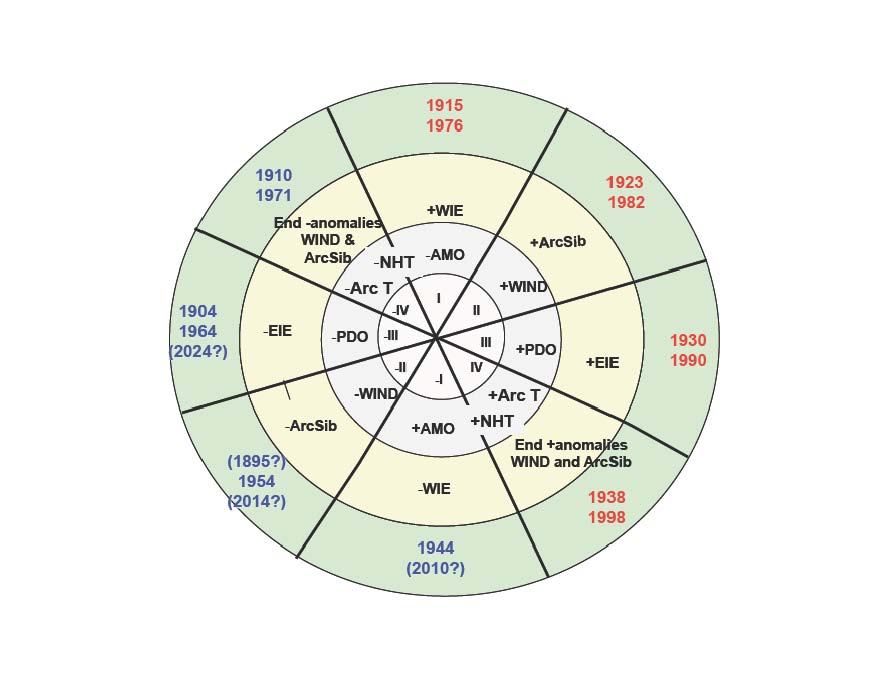
They don’t have a specific index for eastern China’s climate, so I don’t know if this supports the theory or contradicts it.
Wouldn’t that region correlate with Siberian climate shifts?
The period 2014 about 8 o’clock appears to be correct. This has been and still is a wind dominant period, and remains so currently.
Oh dear….
““The question of when the accelerated warming trend will resume needs to be answered by climate model prediction.”
Really? A model needs to answer that? Really? And we trust that model? Reallllllllly? Can we not just, erm, take some measurements and base something on that? I know, it’s a crazy approach.
We can. However, there’s no reason to believe either method works. Predicting the future is a notoriously difficult task with a high failure rate.
Climate model prediction… OKay, well, weatherman can barely predict the weather for next week accurately, despite the advanced equipment available to them. I know, I know: the climate pseudoscience peeps have to justify their existence or lose that grant money and get real jobs, but – well…. That noise you just heard was me falling off my chair laughing.
I am more and more convinced that people involved in that need some serious counseling and time-outs on the quiet chair.
Virtually all human activity leads to some warming. (except CO2, imo). Clearing of land, burning of fuels, light pollution, heating and cooling, all vehicles, etc. They each produce energy that must be dissipated, while clearing of land soaks up more thermal energy from the sun. There is no human activity that can produce ‘cooling’. Only nature can do that.
At some point, the ‘warming hiatus’ will be called what it actually is – the other half of the warming cycle – the cooling cycle. That, of course, is completely natural and expected. Although history shows us that climate cycles between warming and cooling for as long as we have records, it is totally amazing to me that the cooling cycles have been ignored. I have always said that the best way to dispel the global warming myth is to dip into cooling – there is no model that allows for cooling to occur. For cooling to occur in spite of human use of energy is pretty significant. There’s the canary in the mine…
This concern that we may actually enter a cooling period is the reason for the frantic ‘homogenizing’ (aka adjusting or faking) of temperature observations to ensure that there is no cooling in the records. (cf recent fuss over BOM adjusting low minimums upward but not high maximums down)
Cooling as in the 1940 to 1970’s period would be mildly discomforting and result in some fairly substantial crop losses in the Northern Hemisphere, not much worse than that. We are however, very likely on the downhill side of this interglacial and there is no reason why we can’t just go straight downhill into the next glaciation as no one really knows what the exact timing or triggers are. That would be disastrous on a scale never seen before in recorded human history, with billions dying. The idea that a tiny amount of CO2 could overcome that is ludicrous.
We can plant trees and plants. We can put carbon back into the soil to rejuvenate the soil so more plants and trees will grow. We could add aerosols to the atmosphere. There are lots of things we could do and we do some already.
Yeah, we could plant all kinds of things, but CO2 does not warm the climate. So, other than liking plants, what’s the point? Add aerosols? Again, what’s the point? To prevent warming that is not happening because of our activities, or to fight the natural cycles of the planet; we will lose if it is either goal.
I thought aerosols were bad…..
Higley 7
There is no evidence that CO2 likes plants, however plants do like CO2.
“CNN reported on Raftery’s study ahead of a town hall the network was holding with former Vice President Al Gore to highlight his new film “An Inconvenient Sequel.”
Talk about your fake news! What’s next? Will CNN have town hall meetings to discuss the impending threat of flying monkeys before screening the Wizard of OZ?
After an irrational list of terrifying threats that will supposedly come about after one more degree of warming from pre-industrial temperatures, they conclude with “and stress on mental health.” I had to laugh. CNN is a far bigger stress on mental health than man-made global warming will ever be. Maybe we should develop policies for CNN mitigation, and tax people who watch it.
Whoops! Posted under the wrong story. Sorry for the non sequitur.
No. It is the right story. I need to go back to bed.
Yes, this is a slightly confusing mash-up of two stories.
Your comment is pretty much on target and appropriate.
Is there any region or country in the world where the real actually recorded temperatures genuinely show a long term warming trend, from long duration stations in rural locations with no UHI effect? No infilling, homogenization, or any other type of adjustments. If there is not a significant proportion of the world showing real long term increasing temperatures, how would it be possible for there to be “global warming”?
The Swiss are meticulously good record keepers:
http://www.meteoswiss.admin.ch/product/output/climate-data/climate-trends-processing/ths200m0/swiss/year/1864-smoother/climatetrend_ths200m0_swiss_year_1864-smoother_e.png
That didn’t work. Go to their main site and scroll down.
http://www.meteoswiss.admin.ch/home/climate/present-day/climate-trends.html
It,explains why AGW is treated as a given in most of the EU.
From the website
“The data from these stations is available homogeneously and is adjusted for effects arising from changes in the measurement conditions. In order to obtain an average for the whole of Switzerland or defined sub-regions, the measurement data from the individual stations is combined.”
Might be nothing, but this looks like the “data” is anything but.
Hi Alan, I saw a Russian Gov. climate model going back to the sixties from dim memory and unlike all the warmist models it relied on raw data and guess what? Not only did they get the modest pre 2000s warming, they also got the post 2000s cooling and pretty much absolutely nailed it. The model was shown on a graph alongside many other warming mania models the loony brigade still hold as gospel despite complete evidence to the contrary…and it stood out as being a complete departure from ALL of the IPCC models, and is as close as you could possibly ask for.
Sorry I cant pass on more detailed info, maybe someone out there knows more about it? Have a look anyway, you might be able to find it.
They also do ice records based on fact…etc.
I saw on Twitter that the US has RAWS (Remote Automatic Weather Stations) distributed throughout many remote areas. From what I could gather, their primary function is the estimate forest fire risks, but they do report temperatures.
I don’t know if there has been any systematic evaluation of the RAWS network, or how long the record would be, but that seems like a good place to look.
Hmm. I’ve heard of that network, but never checked it out. My bad! I’m going to dig this weekend to see if they have downloadable products. They only go back to 1991 at the earliest – but could be a very good source of real data. (Firefighters do NOT want “adjusted” numbers; their lives, not their salaries, depend on REALITY.)
Rural stations – no UHI (except, I would think, possibly in some high tourist areas that might spike certain times of the year). Hourly observations – no TOBS problems. Temperature, wind speed / direction – average and max, dry and wet bulb (as well as RH), precipitation in the preceding hour. Photos of the station locations.
Some stations have apparently added TSR instruments in recent years.
VERY interesting.
As with all temperature sensors, ask yourself what their purpose is? Because this determines the resolution and uncertainty of the readings. Climate science requires sub 0.1K uncertainty, in fact 0.01 K for decent signal to noise as many readings are averaged. Of course this uncertainty and level of resolution doesn’t exist; hence it has to be invented by making assumptions (i.e. hypothetical guesses) about how uncertainty can be reduced.
And sadly far too many people don’t see the difference between repeatable and verifiable uncertainty and a “scientific” or really, hypothetical, uncertainty. Even people here who go on and on about the surface temperature record. It is only a scientific guess and not even one backed by good empirical data.
We don’t have any idea about the details of how temperature varied over the last century, except with indirect methods such as changes to ice, reports on weather, etc. And the satellite data is much better but doesn’t cover a substantially long period of time.
Climate science is not the problem. Nor is adjusting temperature records. The problem is that it is “weaponised” as Bill Whittle put it, and used on society. This stuff should be ignored.
But once the idea of Global Warming, the meme essentially, has taken root, it is very hard to dismiss. Too many people “feel” it is right. They believe in it.
The genuflections to the warmist agenda are a bit over the top. The hiatus is of course a ‘warming in waiting’, not a ‘current cooling’.
Since when is a cooling trend for 20 years a ‘hiatus’? Is that what ‘hiatus’ means? Cooling?
I guess we have to wait for a bag of hammers to work out what is happening then report. Having experienced the ‘hiatus’ in Beijing last November I concur that it is cooling.
Here in higher and dryer Ulaanbaatar it is more than ten degrees cooler than Beijing today and it will be snowing before the end of September. There have been multiple catastrophically cold winters since 2000. The claim for the hiatus seems valid.
If the major contributor is cleaner air allowing significant additional cooling at night, that too seems reasonable. The time of day, the time of year point to a cleanup of the emissions from domestic coal stoves which have much higher emissions in early winter because they are ignited several times per day. It is the ignitions, not the mass burned that is the major cause of PM in the air.
The worst emissions are when it is cold but not all that cold. It is the same in other cities where the coal stove is king. A cleaner urban environment matching exactly the 20 year hiatus may be entirely anthropogenic in origin and effect.
Historical data showing the effect of changing 90% of the small urban stoves to ones with far lower ignition emissions is available at UB_Air.com. The temperature drop at night when it is clear, is punishing.
I’m actually amazed their temp data isn’t a state secret , last thing China needs is for the western world to realise that CAGW is crap .
Entertainingly, a large component of the climate damage models that the social cost of carbon are based on is the increased cost of air conditioning in China.
It’s the clash of the media titans, CNN vs. Chinese state run media. Thinking people and fact checkers lose in the process.
I have heard it before. Human Sacrifice, dogs and cats living together, mass hysteria. It has always worked before in cases of solar eclipses, droughts, floods, famines, epidemics, and global warming/cooling.
+1 for paraphrasing Venkman.
I’m pretty sure the weather stations have been attacked by Chinese hackers. Or could it have been the Russians? Did Trump collude in this? We need another FBI investigation ASAP.
If that growing Cold Spot in Eastern Siberia continues to show up in the Fall as it has in the last two years, then I would guess that China should be concerned about a deeper cooling period in the next several decades.
A region downwind of the centre of the largest landmass would be the first place to look for any change in global temperature trend whether towards warming or towards cooling.
For the Southern Hemisphere that would be in Antarctica but for the Northern Hemisphere it would be Eastern China.
Not many temperature sensors in Antarctica but lots in Eastern China.
The temperature trend then spreads slowly and erratically outwards from there depending on air circulation variability.
“An incredibly strong El Nino warming event largely ended the 15-year global warming “hiatus” in global average temperatures” I thought El Ninos were outliers and did not count. The warmist hold their breathe and turn blue if the skeptics start with the 1998 El Nino, calling it “cherry-picking”. How can there be any trend out there when the data ends with an El Nino?
And of course applying Mannsophistry, we can say that because there are a few regions that have not warmed or have actually cooled, modern global warming is not significant or global in scope.
They just need the Australian meteorology standards of data stations to eliminate this cooling issue.
It’s an Easterly Thing. Very definitely East.
Really it is and even I am a bit puzzled. That *is* serious.
A supercomputer somewhere will bust its gut (if not a few CPUs) working it out. Desperate stuff
Because, I’ve been watching some of the longer lived Wundergound stations, seeing as I was while in Cumbria, next-door-neighbour to one of their (in the UK anyway) longest running stations.
The ones I watch in Eastern England (Bedford and Suffolk, both 12 year records) show zero trend but the Western ones (Somerset, Lancashire & Cumbria (with records 14 years in length) are falling at about 1 degC per decade.
Curiouser and curiouser.
How that will blow Mosh’s hommerodgerations out of the water, England is not a very big place
Slightly OT but in another thread recently, someone was wondering about working out averages of temp records – how it affected the result if only 2 daily readings (max and min) were averaged or if readings from every 5, 10 or 15 minutes were averaged.
Wunderground is brilliant for that because that’s how they report, every 5 minutes. 288 readings per day.
Not least as I wanted to find fault with the UK Met Office only providing 2 numbers to cover an entire month – 3 months after the event compared to WU pumping out data in real time every 300 seconds.
From my little fiddlings some while, it was amazing how close the results were from the 2 different methods.
More curiosity innit