Guest Post by Willis Eschenbach (NOTE UPDATE AT END)
There’s a recent and good post here at WUWT by Larry Kummer about sea level rise. However, I disagree with a couple of his comments, viz:
(b) There are some tentative signs that the rate of increase is already accelerating, rather than just fluctuating. But the data is noisy (lots of natural variation) and the (tentative) acceleration is small — near the resolving power of these systems (hence the significance of the frequent revisions).
(c) Graph E in paper (5) is the key. As the world continues to warm, the rate of sea level rise will accelerate (probably slowly).
This question all revolves around whether the rate of sea level rise is relatively steady, or whether it is accelerating … so how do we tell the difference?
Well, how I do it is to fit two models to the data and see which one works better. The first is a straight-line model (a linear fit), and the other is an accelerating model (a “quadratic” fit). Figure 1 shows an example of some pseudo-tidal data which in fact has an accelerating rate of sea level rise. I’ve created it by simply adding an accelerating trend to an actual tidal record.

Figure 1. Artificial pseudodata of a tidal gauge recording an accelerating rate of sea level rise.
As you can see, the blue line showing an accelerating (quadratic) fit matches the data much better than the linear fit (red). How much better? Well, that’s measured by something called “R-squared” (R^2). This is a value between zero and one which measures how well the given line explains the dataset.
The R^2 for the blue line (0.88 ± 0.02) is much larger than the R^2 for the red line (0.77 ± 0.02). And since the difference between the two values is greater than the sum of the standard errors of the two values, we can say that the difference between them is statistically significant. In other words, in the Figure 1 case, we can say that there is a statistically significant acceleration in the dataset.
So that is what I planned to look at—whether the difference between the R^2 for the linear and the quadratic fits is greater than the sum of their standard errors.
With that as prologue, let me discuss my methods. I took the full tidal dataset from the Permanent Service for Mean Sea Level. It has 1,505 tide station records in it. However, as with most historical datasets, there are lots of gaps and stations with short or spotty records.
So I had to use a subset of the data. Because the long lunar tidal cycle is just over fifty years, you need at least that much data to get a serious estimate of the rate of sea level rise. And we are interested in any recent acceleration. So I limited my analysis to tidal stations with data starting before 1950 and ending after 2015. This cuts the list down to 171 stations which cover the period of interest.
However, some of these are missing a lot of data, some with over half of the data gone. I wanted enough data to have faith in the analysis, so I further limited the dataset to those stations having 95% or more of the data during 1950-2015. This further reduced the number of tidal stations to 63. Figure 2 shows a sample of 10 of these.

Figure 2. Typical records which fit the criteria of the ex-ante data selection process (95% data coverage from 1950-2017)
Now, my Mark 1 Eyeball says that if there is acceleration there, it is minor … but let’s look at the numbers. Here is a scatterplot of the R^2 values of the linear fit versus the R^2 values of the quadratic fit:

Figure 3. Scatterplot, R^2 of the linear fit vs. the R^2 of the accelerating (quadratic) fit. Dots above the diagonal line are stations where the R^2 of the accelerating (quadratic) fit is larger than the R^2 of the linear fit.
As you can see, in almost all cases the gain in the goodness of fit when we go from linear to quadratic fits is trivially small, invisible at this scale. And when I examined the gain in R^2 versus the standard errors for each of the 63 stations, in every single case the accelerating fit was NOT statistically better than the linear fit.
In other words, not one of these datasets shows statistically significant acceleration.
And that is why at the top I said that I disagree with the following statement from the other post, viz:
There are some tentative signs that the rate of increase is already accelerating …
Simply not true. Figure 3 shows clearly that the tidal gauges contain no such “tentative signs”. NOT ONE of these 63 full tidal datasets shows statistically significant acceleration, and more to the point, most of them show only a trivially small difference between acceleration and a simple linear fit.
The other statement I disagreed with was:
As the world continues to warm, the rate of sea level rise will accelerate (probably slowly) …
Look, this is just the same nonsense that the alarmists have been peddling for the last thirty years, that in the future the sea level rise will accelerate, that New York will be underwater, and the like … but it has been thirty years since the first bogus prognostication was made, and there is still no evidence that the sea level rise is accelerating.
Look, I’m all in favor of taking care about the future … however, call me crazy but I need EVIDENCE before I start hyperventilating about Miami sinking into the ocean.
5 PM, the dreaded global warming has cooled down now. Me, I’m going to post this and then go outside to lay some pavers in the new level space I just made with my own sweat. Plus a rented backhoe. I could have hired someone, but why should illegal immigrants have all the fun? I like living in the hills … but this is the first and only flat spot on my land, so I’m making it nice.

What a universe!
Best to everyone,
w.
PS—The Usual: When you comment, please QUOTE THE EXACT WORDS YOU ARE DISCUSSING, so that we can all be clear about your precise subject.
DATA—I’ve put the 63-station data here, as a CSV file so that anyone can use it in Excel or any other program.
[UPDATE] Over at Tamino’s website, where since about 2009 I’m barred from commenting because I was asking inconvenient questions, he points out that there is a simpler and more accurate method for finding out if a dataset contains acceleration. This is to see if the squared term in the quadratic equation is statistically significant after correction for autocorrelation, duh … he is correct.
My thanks to him for pointing this out, although I do have to deduct points for his repeated ad hominem attacks on me in his post … haters gonna hate, I guess.
Using his method I identified seven of the sixty-three stations as having statistically significant acceleration and three stations with statistically significant deceleration. However, the average value of their acceleration is 0.015 ± 0.012 mm/yr2 … which is not statistically different from zero. Here are the stations and their accelerations:
       VLISSINGEN         BALTIMORE            SMOGEN          KEY WEST         KETCHIKAN

           0.0605            0.0542            0.0676            0.0477           -0.0543

WEST-TERSCHELLING        SANDY HOOK            JUNEAU             SITKA         KWAJALEIN

           0.0979            0.0510           -0.1052           -0.0573            0.1258
I note that one station he says has significant acceleration doesn’t appear in this list (Boston). I find that the p-value of the acceleration term for Boston is 0.08, not significant. I suspect the difference is in how we account for autocorrelation. I use the method of Koutsoyiannis, detailed here. I don’t know how Tamino does it.
I would also note that the average acceleration of the entire 63-station dataset is 0.014 ± 0.008, still not statistically significant. And if this turns out to be the long-term acceleration, currently the rate of rise is on the order of a couple of mm/yr, or 166 mm (about 7 inches) by the year 2100. IF this increases at 0.014 mm/yr2, this will make a difference of 48 mm (under two inches) this century.
Curiously, in the previous fifty-year period 1900-1950 there are only three sites with significant acceleration out of 38 datasets covering the period, and none are in the first list:
NEW YORK (THE BATTERY)              HARLINGEN                SEATTLE

                0.0976                -0.1182                 0.0959
Whatever any future sea level acceleration turns out to be, it is very unlikely to put the Statue of Liberty underwater anytime soon …
Man, I love writing for the web. All my errors get exposed in the burning glare of the public marketplace of ideas, I get to learn new things, what’s not to like?
Willis, thank you for your essay.
Ok. Though this is a statistical methods argument this truck driver has a more direct question.
Where the hell is the water coming from? Most of the Antarctic is gaining SMB. Though Greenland ice sheet SMB was decreasing a little it is now gaining. Neither can account for the amount of SLR it seems to me.
Thermal expansion and ground water are accounting for the bulk of the rise?
Thermal expansion and creative accounting are apparently the two main drivers of SLR… 😉
Thermal expansion, ground water pumping, and melting of high altitude glaciers are all contributors. There probably is some net accumulation of ice in the Antartic, but I think Grace data continues to indicate net loss in Greenland. That said, claims of more than a meter sea level rise before 2100 are utterly bonkers…. more likely is somewhere under 50 cm by 2100. The Statue of Liberty is safe…. though the liberty the Statue celebrates is truly threatened by those who insist people must “fundamentally change” how they live their lives to ‘avoid catastrophe’. It’s just science being subverted and corrupted to advance green/left policies..
Thank you to those that responded.
GRACE data on ice masses overlaying areas like some in Greenland which have ongoing active geological/ Geothermal processes seems to have been less than optimal.
Afonzarelli.
Your chart runs to 2014 but there has been more than one paper published since then which has indicated the SMB of Antarctica is actually growing slightly. That would indicate that the contribution from Antarctica would be negative.
As for the Steric contribution that would correlate with the higher SSTS.
I guess over all one should expect that if that chart ran to the present the total would be somewhat less?
Forrest,
It’s not clear that you understand what Willis is doing. You are correct that a linear model might not be the best model for sea-level rise, but Willis isn’t trying to model sea-level rise. He is looking for evidence of acceleration.
As you may or may not know, any finite and continuous function can be represented by a power series. So whatever the correct model for sea level is, it can be represented by the series d(t) = a0 + a1*t + a2*t^2 + …. a0 would be a constant sea level, a1 is a constant change in level, a2 is a constant acceleration, etc. If there is any acceleration in the data, it will show up as a nonzero a2, no matter what the correct model is. That’s why the linear vs. quadratic fit is the right test to do.
It’s true that such a fit would not work prior to 1950, but it does allow Willis to conclude–correctly–that there is no evidence of acceleration between 1950 and 2015. That’s all his post is about and he did the test the way it should be done.
Forrest,
I can see that you don’t understand what I’m talking about. I am not presenting some “ideas.” I am stating basic mathematical facts, known to anyone with a decent knowledge of calculus.
If sea level can be calculated at all (which you are assuming when you speak of a model), it is certainly a continuous and finite function of time. If sea level is definable at all (such as the average of sea-level gauges around the world), it is calculable for every moment in time. Since it is nonphysical for the sea to suddenly be, say, three inches higher without going through intermediate heights (such as 1 inch, 2 inches, etc.), it is certainly continuous. And since it is also nonphysical for the sea level to be infinitely high, it is also finite. Any accurate model of sea level, then, would also be continuous and finite. Again, these are not ideas, just simple facts based on common sense and basic calculus.
So why is Willis justified in stopping at the quadratic term? Because he’s only looking for evidence of acceleration. Suppose the actual model is more than quadratic. The we could rewrite the series as
d(t) = a0 + a1*t + (a2 + a3*t + a4*t^2+..)*t^2.
The third “constant” (the part in parentheses), which now depends on time, is the true acceleration. For Willis’s best fit, it will be calculated as a single number, basically the average acceleration over the chosen time interval. But it will be nonzero if there is any acceleration at all. If it is zero, then all true constant terms (a2, a3, a4, …) must be zero also.
Take a look at Willis’s update based on Tamino’s criticism. The direct approach is to see if the term in parentheses is actually zero. It is. But what Willis did originally is still correct, if less direct.
Your analysis seems to show that an accelerating fit is perhaps marginaly better than a linear fit (a few more points above the line than below it), but essentially both are just as good. It seems that this simplistic analysis is unable to differentiate between linear and rising, and it is not possible to distinguish between them using this method.
Thus an accereraing sea level is just as likely as a linear one, from this analysis.
This seems to show that this is not a good way to distinguish between linear and rising rates.
Those interested in a professional view of what Walter Munk calls the “enigma’ of sea level should read: http://www.pnas.org/content/99/10/6550.full
Those seriously interested in the question of accelerating SLR on a global scale will recognize that a sparse sampling of tide gauge records examined only via regressional methods applied on a time-scale dictated solely by data availability doesn’t provide a scientifically satisfactory answer.
On a Friday afternoon, I can’t take the time to replicate a longer comment explicating these two issues, which totally disappeared, because WUWT was “not responding” to my submission.
1sky1, they’ll eventually show up… (it’s been happening to everybody of late)
I’ll believe it when I see it. Another comment disappeared on this thread early this afternoon.
Willis is an a-hole.
…
There is no such thing as a” lunar tidal cycle is just over fifty years”
…
No wonder he can’t get anything published. he’s an idiot.
The Metonic cycle is 19 years.
Willis may be a lot of things, but one thing he ain’t is an idiot. (watch your manners steve)…
Steve Heins July 22, 2017 at 10:25 am
Steve Heins July 21, 2017 at 7:05 pm
Good heavens, you are such a charming fellow. Do you talk to your momma with that mouth?
Moving on from your pathetic boorishness, on the point of the lunar cycles, none of the longer lunar cycles repeat exactly. There’s a cycle at about 18 years, which is called the “Saros Cycle” It returns fairly close, but not exactly, to the same point where it started.
In addition, there is a cycle which is three of the 18-year cycles, so it’s just over fifty years (54 years 34 days, if you’re interested). It returns even more closely to where it started.
And as a result, you need about fifty years of data so that you can remove the tidal effects from the data to determine the true sea level.
If you actually would like to learn about this and not just persist in your ignorance, I wrote an entire post on it here.
Finally, as to whether I “can’t get anything published”, a quick google search would have disabused you of that stupidity. In addition to a short “Communications Arising” in Nature magazine, I have five other articles in the scientific journals … and there are over sixty citations to these articles in the journals.
Nice try, though, Steve. See Vanna White on the way out, she’ll tell you what gifts we have for failed contestants …
w.
The “here” link does not seem to work.
Thanks, Menicholas, fixed.
w.
Willis fails again….
“In addition, there is a cycle which is three of the 18-year cycles, so it’s just over fifty years (54 years 34 days, if you’re interested).”
…
The Nodal tide cycle is 18.6 years, so please try multiplying 18.6 by three. The answer is 55.8.
..
http://geology.geoscienceworld.org/content/1/3/141
..
But seriously, there is no 50/54 year cycle. Three revolutions the minute hand on a clock is not one minute, it’s THREE.
“a short “Communications Arising” in Nature magazine?”
…
Congratulations on getting a comment published.
…
Maybe if you try real hard, you can get an article published.
Whoof…tough crowd.
Rob and Steve must be great fun at parties.
Keith Sketchley July 22, 2017 at 6:00 pm
It is clear that, like many people, you don’t know the difference in Nature magazine between a Brief Communications Arising, a Letter to the Editor, and a Comment. And why should you? You’ve likely never needed to know.
What’s not clear is why you wanted to reveal that fact to us. In future, you might want to consider Mark Twain’s advice, “It is better to keep your mouth closed and let people think you are a fool than to open it and remove all doubt.”
Moving on to the issue at hand:
A Letter to the Editor has to be very short, and is not peer reviewed. From their guidelines:
Note the difference …
A “Brief Communications Arising” is longer, up to 500 words, and is allowed one graphic. More importantly, it is PEER REVIEWED.
Finally, a “Comment“, contrary to your naive view, is written and commissioned by the magazine’s Editors. So no … I didn’t write a Comment.
If you are interested in attacking your ignorance regarding Brief Communications Arising in Nature, see here … or not …
Regarding your charming and wildly incorrect statement that “Maybe if you try real hard, you can get an article published.”, I have over 60 scientific citations to the analyses that I have published in the scientific journals …
Regards,
w.
PS—You might want to reconsider this kind of ugly ad hominem attacks. They do a couple of things you might not have noticed.
First, they show that you don’t have any relevant scientific objections. Or as I put it, when a man starts throwing mud, you can be sure he’s out of real ammunition..
Second, they damage your reputation. This is particularly true as in this case, where you had your facts on backwards. If you are simply wrong about something, everyone understands that. We’ve all been wrong.
But when you get all nasty, and you crank up the personal attacks … and then you get your head handed to you because you didn’t understand what you were talking about … well, you can bet that folks in the peanut gallery are pointing and laughing.
Thank you Willis for your link to Communications Arising.
..
I especially like this sentence: “Critical comments on recent Nature papers may, after peer review, be published online as Brief Communications Arising”
…
Please note I highlighted the most important word in the description for you. A “comment” is a “comment” even if it is “peer reviewed”
Keith Sketchley July 23, 2017 at 12:02 pm
That’s it? That’s your brilliant insight???
Let me try to explain this one more time.
I think we can both agree that if I say “Hi, Keith, you’re looking good today”, that is a comment. So with that as my starting point, let me highlight the difference between me and you.
Me, I once read an article in Nature that seemed erroneous. I went out and researched the subject. Then I developed a hypothesis. I collected the data to support it. I put the data into the form of a graphic. I wrote up my claims and submitted them to Nature magazine. It was read by three peer reviewers, two of whom wanted further changes to the manuscript.
I made some of the changes. Then I resubmitted it, and after further discussion, I made one further change and convinced them that one change wasn’t necessary.
After all of that, it was published.
So that’s what I did.
And what did you do?
You claimed that what I had produced and gotten published was nothing more than a “comment”, and since in your world all comments seem to be equal, you are claiming that what I did was no more valuable or impressive than to say “Hi, Keith, you’re looking good today”, because they are both comments … riiiiight …
There are two parts in this play. I’m playing the guy who actually did the hard yards and persevered through opposition and accomplished something.
You’re playing the guy who turns himself inside out and defies logic to try to diminish my accomplishments in other peoples’ eyes.
I know which part I prefer to play … what I don’t understand is the nasty spiteful nature of your attack. What do you get out of trying to bite my ankles? Surely you must know it makes you look petty, like a child defacing a painting because he can’t paint himself.
Up to you, amigo. I’m gonna let you have the last word … but I promise I’ll answer you as soon as you notify me that you have had something published in Nature.
And on that mythical day what would I do?
Call me crazy, but I would hope to congratulate you on the achievement because I know that getting published in Nature is never easy.
Until that distant day, my best regards to you and yours,
w
PS: For years there was no citation of my Brief Communications Arising. In it, I’d said that the change in the Lake Tanganyika fisheries was NOT due to climate change. Anyhow, a year or so ago it got cited … in a full article in Nature which said that the change in the Lake Tanganyika fisheries was NOT due to climate change. I was quite proud to have seen that a full decade before.
And meanwhile, you’re tying yourself in knots vainly trying to prove that what I did was meaningless … like I said, I know which part in this play I prefer …
Wow, so your comment got cited?
…
It’s still just a comment. That’s what the link says……”Communications Arising” are peer reviewed comments.
PS, if it took you all that time effort and energy to get a simple comment published, can you imagine how many YEARS it would take you to get a real research article published in Nature?
Rising sea vs. water pump. Pump won. Dutch drained the sea in Flevoland (1,419 sq. km.)
King Canute at work. Who’s laughing now?
I suspect the difference is in how we account for autocorrelation. I use the method of Koutsoyiannis, detailed here. I don’t know how Tamino does it.
I think Tamino models the autocorrelation as ARIMA(1,1) noise.
https://www.researchgate.net/publication/265467321_Time_and_tide_analysis_of_sea_level_time_series
Thanks, Phil, that’s a clear explanation of the autocorrelation method.
However, my repeated tests have shown me that I get much more accurate results using the method of Koutsoyiannis, as I described here. This is because the Koutsoyiannis actually measures the effect in the particular dataset, while the ad-hoc method uses the value of the autocorrelation to estimate the effect.
In short, the method I use is theoretically developed a priori, while Tamino (if he’s using the method you’ve cited) is using an ad-hoc adjustment.
Regards,
w.
After modeling the sample autocorrelation as an ARIMA(1,1) process, Tamino proceeds with the quaint notion that geophysical power spectra need to be compensated for autocorrelation, akin to the compensation of confidence intervals for linear regression. Since the power density of a random signal is defined by the Wiener-Khintchine theorem as the Fourier transform of its acf, his ensuing chain of calculations and conclusions is inane.
Koutsoyannis fares scarcely better, because he posits an AR(1) process a priori as characterizing the acf, thus making it totally dependent upon the sampled value at lag one. This greatly oversimplifies most geophysical data, especially when wave motion is involved.
Acceleration is intrinsically a high-frequency phenomenon, since it is determined by the second derivative in the case of analytic functions. In the practical case of discretely sampled signals, its power transfer function is distinctly high-pass, being proportional to sin^2 in the baseband interval 0 to pi/2. If we are to discuss acceleration of SLR scientifically, an objective choice needs to be made for any smoothing to be applied to best display the salient signal characteristics. The smoothing supplied by linear regression over the length of available data does not meet that requirement.
Oh, the “dazzle them with bullsh!t” approach, is it now?
No matter how you slice it, or how many times you pass your high dollar value word salad through the vegematic slicer dicer, the Mark 1 eyeball still shows the truth, plain as daylight.
No acceleration is evident.
Sorry that should be ARMA(1,1).
See the smoothed 15-yr rate of change of sea level: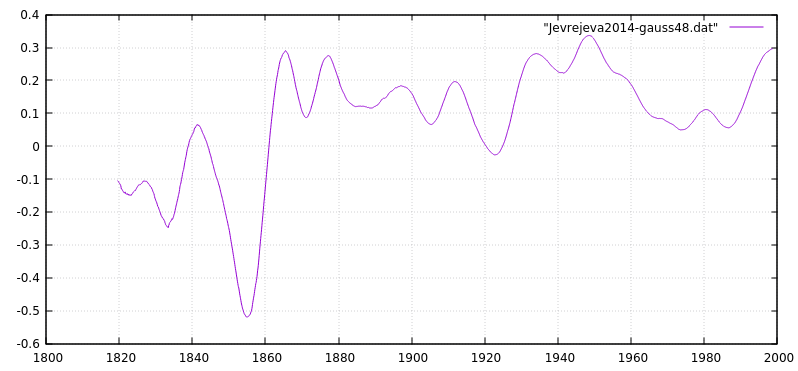
If there were no accelerations and decelerations, the plot would be nearly flat.
To rank amateurs, most scientific descriptions are just “high dollar value word salad.”
Reposted from a comment to the Larry Kummer article from 20 July:
Perhaps the author(s) are unaware of the Gregory et al. assessment from a few years ago:
http://journals.ametsoc.org/doi/abs/10.1175/JCLI-D-12-00319.1
Abstract
Confidence in projections of global-mean sea level rise (GMSLR) depends on an ability to account for GMSLR during the twentieth century. There are contributions from ocean thermal expansion, mass loss from glaciers and ice sheets, groundwater extraction, and reservoir impoundment. Progress has been made toward solving the “enigma” of twentieth-century GMSLR, which is that the observed GMSLR has previously been found to exceed the sum of estimated contributions, especially for the earlier decades. The authors propose the following: thermal expansion simulated by climate models may previously have been underestimated because of their not including volcanic forcing in their control state; the rate of glacier mass loss was larger than previously estimated and was not smaller in the first half than in the second half of the century; the Greenland ice sheet could have made a positive contribution throughout the century; and groundwater depletion and reservoir impoundment, which are of opposite sign, may have been approximately equal in magnitude. It is possible to reconstruct the time series of GMSLR from the quantified contributions, apart from a constant residual term, which is small enough to be explained as a long-term contribution from the Antarctic ice sheet. The reconstructions account for the observation that the rate of GMSLR was not much larger during the last 50 years than during the twentieth century as a whole, despite the increasing anthropogenic forcing. Semiempirical methods for projecting GMSLR depend on the existence of a relationship between global climate change and the rate of GMSLR, but the implication of the authors’ closure of the budget is that such a relationship is weak or absent during the twentieth century.
Notice the final sentence. Such honesty is rare these days.
I’ve been having a running debate on this on Twitter with those who think there is acceleration. When I posted that not one surface station shows acceleration, the rebuttal from some is GLOBALLY together they show acceleration. So, 300 cars with a speed of 50kph collectively show an acceleration to 100kph, even though not one speedometer shows anything but 50kph. Got it.
Another demanded I show all stations to see there is no acceleration. I post a handful from around the world and state categorically that’s all I need to do to show not one station shows acceleration. That for there to be acceleration at some stations and not others would mean those with no acceleration are some how defying gravity.
Yep, in the world of AGW alarmists the laws of physics dont apply.
They also look for ANY acceleration at all, as if even a tiny little temporary acceleration is proof there will be a 2 meter rise by 2100. Again, this shows their complete lack of understanding and their desperation for anything to grasp.
To get to 2 meters by 2100 would require an acceleration (compound growth) of 3.7% per year. The least understood concept is compound growth. All compound growth has a doubling period. Each doubling period is the same as all previous doubling periods combined. This means that by 2099 sea level would have to be rising 8cm in that one year alone. Impossible.
Lastly, if you look at their graphs they show a rate of 1.7mm per year until 1990, then suddenly in that year, the rate of rise DOUBLED (100% acceleration) to a stable 3.3mm per year. No explanation how that could happen.
(I’d like to post some graphics, but have no idea how to do that, can someone post how, pls?)
If you have a link that is a jpeg from a host website, just copy the web address on a separate line where you want the graphic.
You cannot post graphs you have saved on your computer…they have to be in the form of links to a website.
Or so I believe.
Up top, just below the site name, there is a row of tabs…one is to a test page…use it to test out what you want to do to see if it will work.
I am no eggspurt, but I know those few things.
As for sea level rise…the amount they claim is ludicrous…not based on evidence, just makin’ stuff up.
Many predict rates of rise that would rival meltwater pulse 1A.
Personally, I have mostly given up on arguing with people I do not know on social media sites.
It is truly pointless.
But sites like this and a few others are different…they are places that people can go for non-fake news, and false statements should not go unchallenged.
Even at congressional hearings run by guys like Ted Cruz, or news network programs like Tucker Carlson…many false statements go unchallenged, just slide on by, perpetuating all matter of *insert your favorite phrase for crap that aint true*.
Thanks, lets see if that works.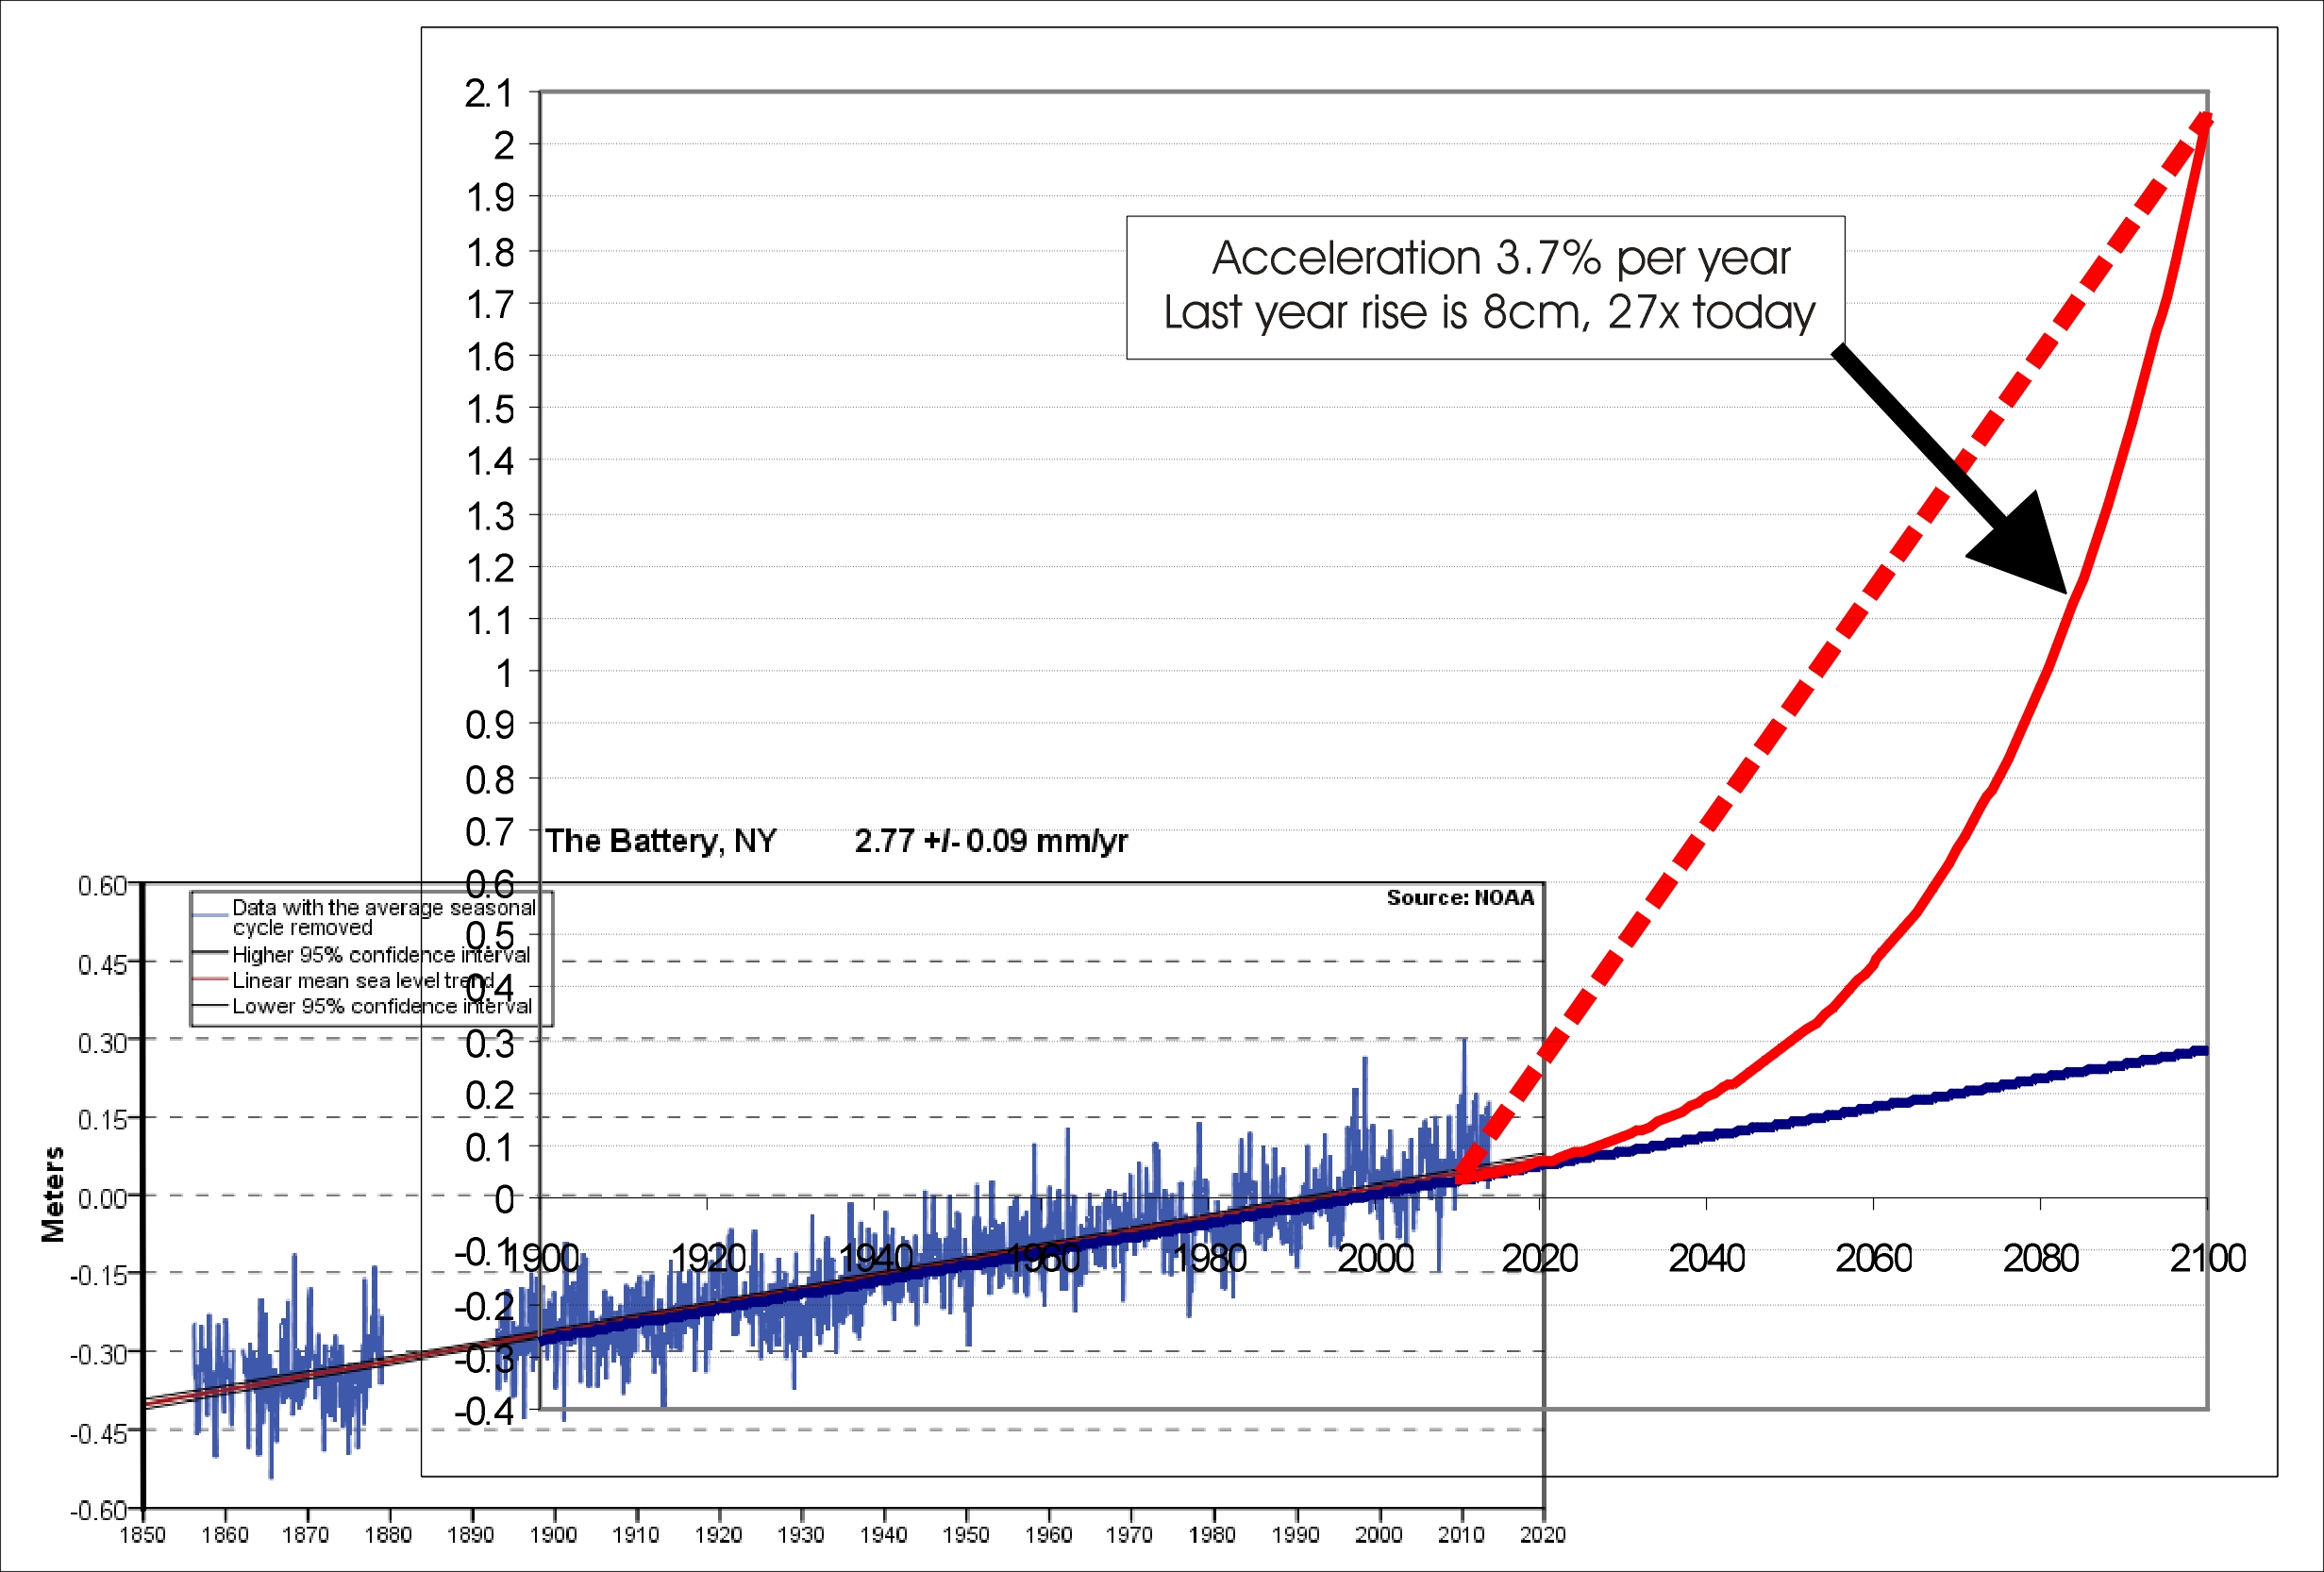
It does so here is another. This is what surface stations should look like if the rate doubled in 1990:
This graphic is common showing sea level rate accelerating instantly in 1990. With some comments I’ve added.
Oh I get it…you hate children.
Why do you hate children?
/sarc off
I have perhaps a stupid question. Could not plate tectonics contribute to sea level variation?
It does, which is why Alaska’s land is rising (sea level falling).
And what about those ever growing mid oceanic ridges?
There are spreading centers, but also subduction zones.
Some seem to think Earth is expanding.
What it comes down to is, the total change in the level of the ocean over the past 150 years would not be even detectable if all you went by was pictures or where the beaches are.
Except for places where land has been displaced vertically by geologic forces, and where erosion has taken place…there is no place in the world where anyone could live in 1867 that they cannot live now because the ocean is too high. No one’s house has been flooded due to gradually rising oceans.
Storms…different story.
Has anyone applied ‘Tamino’s method’ to the UC satellite data record?
Whatever any future sea level acceleration turns out to be, it is very unlikely to put the Statue of Liberty underwater anytime soon …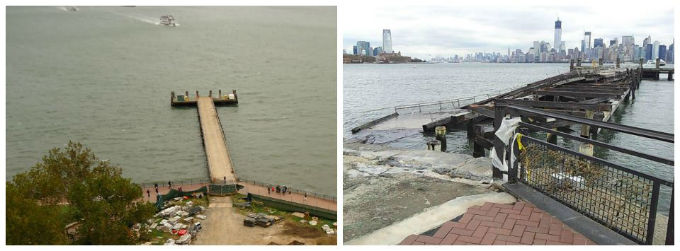
As long as we don’t get any storms. Sandy closed Liberty Island for 8 months (75% 0f the island was flooded) and much of the infrastructure was destroyed. Here’s the dock before and after.
We will get storms. No matter what.
Did you have an idea that events which have always occurred can be stopped by political decree or virtue signaling obeisance?
Menicholas July 22, 2017 at 1:21 pm
We will get storms. No matter what.
Did you have an idea that events which have always occurred can be stopped by political decree or virtue signaling obeisance?
Flooding of Ellis Island and Liberty Island haven’t ‘always occurred’. Perhaps the rise in sea level there of a foot or so over the last century had something to do with it?
You could use the Holgate-9 series of stations, as those stations are well known and spread around the globe.
Thanks, Svend. I’ve looked for a list of those stations in the past. Do you have a link?
w.
The best i can do is ask you to look at http://climate4you.com/
And specifically sea level and this one: http://climate4you.com/images/Holgate-9_Since1900-NEW.gif
It is mentioned which stations are used.
I belive it is the same stations all the time, so even if the rate could be a little different from other compilations, the change of rate must be usefull and valid.
Thanks, Svend, I can get the names from there. However, I was surprised that there is only one southern hemisphere series ..
w.
Rob Bradley July 22, 2017, at 3:24 pm
Fails again? You haven’t established that I failed before.
Sorry for my lack of clarity. What I meant was that the longer cycle is about three of the 18-year cycles. It’s not exactly three because we’re dealing with a solar system, not a clock.
..
But seriously there is no Nodal tide cycle. By that I mean it’s only approximate, it doesn’t return to the exact same point, although it’s close. And the 54+ year cycle returns even more closely to the same point. So both are more properly termed pseudocycles … and both are entirely different from the sweep of a minute hand on a clock. That’s a simple sine wave. These are not.
Did you bother to read the post I linked to? In that post I described all of this in detail. I also overlaid a series of 54+ year cycles to show that they are indeed real.
w.
PS-Let me suggest that you lose the ‘tude, it doesn’t look good when you’re spouting nonsense.
You don’t get it. I’ve spent hundreds and hundreds of hours studying the moon cycles. I had to because back in the 90’s I ran a shipyard on a remote atoll in the Solomon Islands. When you have a slipway you need tide tables. The SI Government produced tide tables … but usually only printed them in September or something.
So I had to make my own. I took the previous year of tidal data and entered it by hand in my ancient Mac. Then I spent a couple months crunching the data and learning about lunar cycles … from my Encyclopedia Britannica, a necessity on a remote island.
And at the end of that I was able to produce a set of tide tables for each year of the time I worked there … and I published it and sold it in the capital city of Honiara as well.
Now, at some point in the future when you have amassed enough knowledge to take a years of past tide tables and create this year’s tide tables on them … well, you’ll have earned the right to use some ‘tude on folks as innocent as you are today … but not on me.
1) ” that the longer cycle is about three of the 18-year cycles.”
2) “there is no Nodal tide cycle.”
…
Therefore there is no 54/55 year cycle
…
(basic logic Willie) …
…
PS, Google is your friend, I suggest browse the 1660 results you get for a search on “Nodal tidal cycle”
…
PPS, the solar system is darn good clock. We have things called “days,” and “years” based upon the clock like precision of the movements of the planets. The orbit of the moon is quite predictable.
Rob, if you read the post and the actual words Willis used, you will see he referred to the saros cycle, which is a period of 223 synodic months.
This cycles has been known since ancient times, and was what allowed certain cultures and not certain others to be able to predict eclipses.
Willis did not refer to the somewhat longer period known as the nodal tidal cycle. You seem to have translated one into the other inside your own head…those words are yours, not his.
BTW…223 synodic months is an interval known to great accuracy.
It is “approximately 6585.3211 days”.
Or, more simply, 18 years, 11 days, and 8 hours.
Three times that gives an even number of days.
And that three saros cycle period is exactly the number Willis cited.
I do not even have to break out my mark one pencil to do that multiplication.
Although I did do something you seemed unable or unwilling to do…I looked up stuff before I decided i was remembering correctly and criticized anyone.
You should try it sometime.
https://en.wikipedia.org/wiki/Saros_(astronomy)
https://en.wikipedia.org/wiki/Lunar_standstill
Menicholas: re-read the post, and focus on this: “Because the long lunar tidal cycle is just over fifty years”
…
See the word “tidal?”
…
You claim “if you read the post and the actual words Willis used, you will see he referred to the saros cycle”
….
Nope, he mentions that in a comment, but not in the post. Do you know the difference between the post, and the comments?
Ba-zing!
Ooh, you got me there!
I think it is worth noting that your rude comment was attached to his comment (did i use the right word…um, yup, I think so this time), not to the headline post.
Notice when you make a comment on a post, or on another comment…just what the little oblong button thingy says that you hit in order to …um…POST IT…says?
That one right down there on the bottom right as you POST your next rude-ass COMMENT to me.
See it?
What does it say?
If I had known this was grammar N@zi day, I would have peer reviewed each word of the comment I um…posted.
My bad.
So, your rude ass comment you posted in which you pulled the phrase no one else had mentioned out of your, uh, hat and attributed it to someone who had not said that…that was a reference to the top article?
But the words you quoted were not from up top.
So, like all warmistas…you just make crap up all day long.
It is like a reflex with you guys, aint it?
If you have a point, could you please make it?
…
There’s not much point in talking about sea level, which is measured with tidal gauges, and confusing it with an eclipse(s) that follows a saros cycle. Maybe you should direct your ire at Willis, since his sloppy writing and confusion about different cycles would best be solved with your help.
Just admit it…you did not know the difference between saros and nodal tide cycles. Or that there was one.
You conflated them and made a false attribution.
It is right there in black and white for all time.
If it will make you happy Menicholas, I will admit that Willis did confuse the two.
“And the 54+ year cycle returns even more closely to the same point.”
I love this graphic animation, which illustrates the variation between one eclipse and the next one in that saros series:
http://eclipse.gsfc.nasa.gov/SEsaros/SEsaros136.html
Turns out NASA is still good for something.
A few somethings…just not anything related to climate.
Oh, wrong link.
This is the one:
Link broken …
I do not know why it is that little square, but when I click on it I get the GIF from a wiki article.
it is the progression over one saros series of the path of each eclipse n the series.
Interesting pattern.
I wonder if each saros has a similar pattern?
Do you not see the GIF if you click the link?
Huh … works now.
Interesting graphic …
w.
Willis, to get the acceleration, did you remember to multiply the quadratic coefficient by 2?
Yes, and thanks for checking.
w.
Willis, it looks like you have simply assumed that the 50+ year cycle you refer to has a significant effect on tides. I don’t think you have justified that assumption, so it looks like you have simply declared it so that you can ignore 95% of the 1,505 tide stations. Is there a paper that shows the effect of this cycle on tides?
Martin, you come here and without a scrap of evidence you’ve accused me of bad faith, of trying to rig the game so I can ignore some station. You can stuff that false accusation where the sun don’t shine.
As to the substance, it is well known in the study of the tides that we need about 50 years of data in order to get mm level accuracy regarding sea level rise. Hang on … OK, there’s a good exposition of this in the section of this paper called “Asymptotic Trend Evaluation”. See also the graphic of the same name at the end of the paper.
And next time you want to ask a scientific question, just leave out the nasty untrue assumptions about my motives, OK? You have no clue what my motives are, they are irrelevant in any case, and it demeans you to be making such accusations. Stick to the science …
w.
I apologize for giving you that impression, Willis, but I was careful not to accuse you of anything. If you reread my comment, you will see that I did not accuse you. I said that your blog post “looks like” you are trying to ignore most of the data because you did not include the justification which you have just now provided. However, the word “lunar” does not appear in the paper you provided. The word “moon” does appear exactly once, and it does appear in the context of an 18.6 year cycle, but there is no mention at all of a 50+ year cycle, so you still have not justified your claim that this 50+ year lunar tide cycle is of significance. I’m afraid it still looks like you are trying to ignore most of the data. I’m not accusing you; it “looks” that way to me because I can’t see that you have justified your assumption.
But you are certainly wrong about your readers not having a clue what your motives are. We have all your blog posts.
Martin Smith July 24, 2017 at 11:26 am
Oh, I get it now. So if I were to say “It looks like Martin Smith spends most of his time ignoring the truth and spreading lies”, I’m not actually accusing you of doing anything wrong, because I put some weasel words in the sentence? …
Maybe that worked with your mom or your sister or someone. Won’t work here in the real world.
Dude, half the time neither you nor I know what ourown motives are. The idea that you can determine my motives from my writings, when I cannot clearly delineate them from this side of my eyeballs, doesn’t even pass the laugh test.
w.
From reading only two comments from me, do you really think you can reasonably make this claim?: “It looks like Martin Smith spends most of his time ignoring the truth and spreading lies”
You actually have not justified your claim that there is a 50+ year lunar tide cycle that has a significant effect on sea level rise. You haven’t done that, but your argument depends on it.
Martin Smith July 24, 2017 at 11:51 am
I didn’t say you were a liar. To use your excuse, I didn’t say you are spreading lies. I said it “looks like” you’re spreading lies … hey, if you can deny responsibility on such a bogus pretext, why can’t I?
You don’t get it. It would be a damaging insult if I were to say
and if I were to say that, which I wouldn’t, I also wouldn’t get to deny responsibility by claiming “Hey, I didn’t say you WERE a child molester … I just said it’s POSSIBLE, which is clearly, obviously, and demostrably true …”
Did you read the citation that I posted? Obviously not, since it said you need fifty years of data to get mmm accuracy:
They say you need fifty years in order to get accurate estimates of “the tidal amplitudes and phases” … which is WHY I SELECTED THE FIFTY YEAR DATA LENGTH.
w.
>They say you need fifty years in order to get accurate estimates of “the tidal amplitudes and phases”
No they don’t.
I accept that you will not address the point I raised, so I will conclude by stating my understanding of your analysis: You throw out almost all the SLR data, and then you conclude from the remaining small fraction of the data that the SLR data do not show a statistically significant acceleration in SLR.
Martin Smith July 24, 2017 at 1:10 pm Edit
Martin, they not only state you need fifty years of data to get mm accuracy as I quoted above, they give a clear explanation of why, plus a graphic showing the relationship between length of tidal data and accuracy. The apparent fact that you are unable to understand that does not mean that the rest of us are.
Not address the point you made? I want some of what you’re smoking. I’ve answered repeatedly, in detail, with citations. I’ve also pointed you to my analysis of the actual tidal forces which clearly shows the longer tidal cycles.
I do note that you’ve gone back to attacking my motives, claiming cherry-picking without a scrap of actual evidence. What is it you want? Hey, you can use all of the 1500 or so datasets … are you arguing for that?
Because if not, that means that you need to make some ex-ante choices about which tide stations to use. I made my ex-ante choice (stations with 95% data over the last 50 years), which is totally justifiable given our knowledge of the relationship between tide data length and accuracy.
However, making such an ex-ante choice IS NOT CHERRY-PICKING AS YOU FOOLISHLY ASSERT. Unless we are going to use a dataset with only a few years of data, like some among the 1500 candidates, we have to set up a standard of which to use.
Don’t like my choice? No worries. You get to make your own choices. I’ve given you the link to the data source in the head post. I await your analysis of this data.
I also note that you are returning to your baseless ad hominem attacks. When you have a scientific argument, please come back and we can discuss it.
Why do I think that despite all of your whining about my analysis, we’re never going to see your analysis of this data? …
w.
Willis, here again is my understanding of your analysis:
You throw out almost all the SLR data, and then you conclude from analyzing the remaining small fraction of the data that the SLR data do not show a statistically significant acceleration in SLR.
You did throw out almost all the SLR data. That’s a fact. Did you conclude from analyzing the remaining small fraction of the SLR data that the SLR data do not show a statistically significant acceleration in SLR? Is that your conclusion, based on the data you analyzed?
For those actually interested in the question of tidal data length and accuracy, which by all accounts doesn’t include Martin Smith, see here.
Best to all,
w.
I’ve got an interesting debate going on at your friend’s site. Seems they dont like the fact that sat data shows a doubling of sea level in the 1990-1993 period and flat since. https://tamino.wordpress.com/2017/07/24/boston-sea-level/#comment-99191
Too bad you’re banned. Guess I will be too soon.
J, why don’t you prove your claim (I think you mean doubling of sea level rise rate, not doubling of sea level) instead of just declaring it?
The doubling of the rate of rise, from 1.7mm up to 1990 to 3.4mm afterwards comes from the sat data. Surface station data shows no doubling. The sats are wrong.
No it doesn’t, J. Tamino has explained where and why your claim is wrong. I won’t repost Tamino’s work here, but you now know why your claims are wrong, so it is really disingenuous to make the same claims here.
No he has not. He’s trying to shoehorn an acceleration curve onto a clear straight line data set. It is his OPINION that fits better than a straight line. ?itok=amqLr7zW
Here is the sat data, again. How you dont see a straight line is beyond me. Interesting how your side has turned into the deniers.
J, the straight line you see is computed by simple linear regression. It always computes a straight line through any set of data. The straight line is the trend. There is always a straight trend line through the data. It is the trend. It always exists, but it says nothing about whether sea level rise is accelerating.
Re: “the sats are wrong”
local sea rise from local gauges is contaminated by local changes in land height, which can be significant. sats are clearly superior.
If they are superior, how come a calibration went unnoticed for 20 years? Sat data is rot with a lot of uncertainty and noise.
“In addition, the amplitude of the residual trend pattern is significantly lower than the expected error in trend patterns from satellite altimetry (in the order of 2 mm/yr to 3 mm/yr) and therefore suggests that satellite altimetry measurement is still not accurate enough to detect the anthropogenic signal in the 20 year tropical Pacific sea level trends. ”
https://tel.archives-ouvertes.fr/tel-01317607/document
“Sat data is rot with a lot of uncertainty and noise.”
Remember that, next time you tout satellite data as the best temperature data we have.
I’ve never relied on sat temp data. The only measurements I accept are the direct ones on the ground.
Good for you. Then you know there was no “pause” or “hiatus” in global average temperature rise, and you know the global average temperature rise is accelerating.
And what is the rate of this acceleration? Do we expect the earth’s temp to double in the next few decades?
No, I dont see temps “accelerating” anywhere on the planet. If anything Tmax is down or flat:
I don’t know what your graph represents, J, because you don’t provide any links or citations. Clearly, it is not the global average temperature, which is what you and I are talking about. Apparently your graph shows the summer maximum temperature for somewhere. It says nothing about the global average temperature, which, again, is what you and I are talking about. Here is the complete explanation you are missing. It shows the global average temperature is rising, and the rise is accelerating. But no, I have not done the statistical analysis Tamino has done. The data are also available for each graph:
http://data.giss.nasa.gov/gistemp/graphs_v3/
And here is the statistical analysis by Tamino:
http://tamino.wordpress.com/2017/01/18/global-temperature-the-big-3/
So I say to you again: Good for you. Then you know there was no “pause” or “hiatus” in global average temperature rise, and you know the global average temperature rise is accelerating.
Willis, won’t you answer my question? Here is my understanding of your analysis:
You throw out almost all the SLR data, and then you conclude from analyzing the remaining small fraction of the data that the SLR data do not show a statistically significant acceleration in SLR.
You did throw out almost all the SLR data. That’s a fact. Did you conclude from analyzing the remaining small fraction of the SLR data that the SLR data do not show a statistically significant acceleration in SLR? Is that your conclusion, based on the data you analyzed?
You have to throw out incomplete data, or records of too short a period. You cant include them because it incorrectly skews the results.
I think we should allow Willis to answer for himself, J.
For example, in Canada only 13 stations in the Environment Canada’s database have a complete record of temps going back to 1900, even though at the height EC had 1300 stations in the mid 1980s. Now they are down to less than a third of that. Hence when looking at an as complete record as possible one can only use the 13 stations.
Martin Smith July 25, 2017 at 11:32 pm
Truly? You think all satellites face the same noise issues? What, all satellites are the same? Does this affect satellites taking photographs too?
Dear heavens, Martin, you truly need to up your game and do your homework before uncapping your electronic pen. The idea that a passive microwave reading satellite has the same noise problems that an active radar sending and receiving satellite has doesn’t even pass the laugh test.
w.
No, Willis, not the “same” noise issues, different noise issue. But yes, all satellites face noise issues. The noise issues for “passive microwave reading satellites” are probably worse, yes? Multiple altitudes; multiple frequencies; clouds… That’s harder than bouncing radar waves off the ocean, isn’t it? Clouds don’t bother radar so much, do they? And there is only the one sea level to measure. There waves and wind conditions, of course.
But let’s return to our discussion. Will you answer my question? Here is my understanding of your analysis:
You throw out almost all the SLR data, and then you conclude from analyzing the remaining small fraction of the data that the SLR data do not show a statistically significant acceleration in SLR.
You did throw out almost all the SLR data. That’s a fact. Did you conclude from analyzing the remaining small fraction of the SLR data that the SLR data do not show a statistically significant acceleration in SLR? Is that your conclusion, based on the data you analyzed?
Martin Smith July 26, 2017 at 9:47 pm
No, Willis, not the “same” noise issues, different noise issue. But yes, all satellites face noise issues.
My friend, EVERY dataset has noise issues … but that doesn’t mean that all satellite datasets are equally bad as you are claiming. You have claimed that if we do not accept the sea level satellite data we also perforce cannot accept the MSU satellite data, saying:
Sorry, but that’s as dumb as a bag of ball bearings.
I already answered that, perhaps you weren’t paying attention. In addition, I pointed out that YOU HAVE THE LINK TO THE DATA. So I invited you to put your money where your mouth is, do the analysis as you think it should be done, and report back to us your station selection criteria and your results.
Instead of doing that you want to continue to whine about boo-hoo Willis isn’t doing it right, and about poor, poor you, Willis is not answering my questions … get a grip! Question time is over! If you think there’s a better way to do it then DO IT and quit your bitching about my analysis.
Sheesh … talk about all hat and no cattle …
w.
Willis, you wrote: “…but that doesn’t mean that all satellite datasets are equally bad as you are claiming.”
I did not claim that. In fact, I claim the satellite datasets used for inferring temperature are much more noisy than the satellites used for measuring sea level. I don’t know for sure, of course, but doesn’t it seem reasonable given the more complicated problem for inferring temperature from irradiance data measured at different frequencies for different altitudes, and given the problem of clouds getting in the way?
And now you write: “I already answered that, perhaps you weren’t paying attention.”
No, you didn’t. Will you answer my questions? You throw out almost all the SLR data, and then you conclude from analyzing the remaining small fraction of the data that the SLR data do not show a statistically significant acceleration in SLR.
You did throw out almost all the SLR data. That’s a fact. Did you conclude from analyzing the remaining small fraction of the SLR data that the SLR data do not show a statistically significant acceleration in SLR? Is that your conclusion, based on the data you analyzed?
willis, when you did a rank2 polynomial
fit, did
you multiply the quadratic coefficient
by 2 to get the acceleration?
Crackers, you asked this question above, and I answered “Yes” …
w.
thanks; for some reason
that reply didn’t reach me;
or I
missed it. cheers willis.