Guest Commentary by Kip Hansen
The New York Times has set a new standard of scientific misrepresentation in this front page title to the latest climate change consensus salvo from Justin Gillis. On the front page of the online edition of the NY Times for 26 June 2017, the title is given: “Sharp Rise in Levels of Earth-Scorching Carbon Dioxide”
The actual title of the article, once one clicks through to it, is “Carbon in Atmosphere Is Rising, Even as Emissions Stabilize”.
Who knows who at the NY Times thinks that characterizing CO2 as “Earth-scorching” is a valid scientific description of one of the absolutely necessary-for-life trace gases in the Earth’s atmosphere. It certainly is not a proper journalistic description.
My objection is that it is a serious violation of Society of Professional Journalists’ Code of Ethics specifically:
What do you think the phrase “Take special care not to misrepresent or oversimplify in promoting, previewing or summarizing a story” might mean in this context?
It is simply scientifically false to label CO2 as “Earth-scorching” in so many ways that it is difficult to begin to write about it. Journalistically, even if it were anywhere near true, it would be an oversimplification.
Is Mr. Gillis blameless? He doesn’t write the front-page headlines. I wish I could say that but I can’t. Gillis writes: “The excess carbon dioxide scorching the planet rose at the highest rate on record in 2015 and 2016. A slightly slower but still unusual rate of increase has continued into 2017.” — this is Gillis’ misrepresentation.
Are CO2 concentrations particularly high? Looking at the NY Times graphic, we see that they are at mountainous heights:
Looking at NOAA’s graphic, not so mountainous:
The NY Times art department (or whomever is making the graphics) has taken data from the NOAA graphic and stretched it vertically to increase the appearance of a large increase.
Re-scaling the NY Times graphic helps some:
Better this:
I must say I can’t see that incredible dangerous increase in rate of rise in the second NOAA graphic — because it is in reality an increase in fractional parts per million. Note that the current spike in the two bar graphs matches a spike from the last El Niño in 1998 and the recent 2015-2016 El Niño .
Is the planet scorching?
No, it is not. For the year so far, we are running about 0.4 °C or 0.72°F above the 1981-2010 thirty-year average, down considerably from the 2015-2016 El Niño peak.
How about the US?
Oddly flat from the 1920s thru the 1980s — [adjusted?] up to flat again in the new century, centering on 53.5 °F or 12 °C — is that “scorching”? It is a bit chilly for me. Note that Global Average Temperatures are in the same absolute temperature range…still not scorching.
But, but, but they say, what about those summertime high temperatures?
For the United States, reader Steve Case “compiled [the data] from NOAA Climate at a Glance data”…then saved a text file of all the states June through September Max temperatures Alabama to Wyoming. Trends in high temps produce this map:
So, maybe not scorching in the US either.
Actual observational stats on extreme weather are not on rising trends – at least droughts (US), hurricanes, tornadoes (US), flooding, etc. Reference Pielke Jr.’s evidence presented to the Senate Committee.
Gillis at least asks the right question:
“If the amount of the gas that people are putting out has stopped rising, how can the amount that stays in the air be going up faster than ever? Does it mean the natural sponges that have been absorbing carbon dioxide are now changing?”
Good question, Mr. Gillis.
Let’s see if the readers here can answer it for you —
Here’s the question:
“If the amount of the gas [CO2] that people are putting out has stopped rising, how can the amount that stays in the air be going up faster than ever?”
Readers: Your answers in comments please.
# # # # #
Author’s Comment Policy:
I am not a climate scientist — I am an essayist, a writer. I have some ideas, but not an answer.
I think that the question is apt and extremely important — it may be, or contain, the key to the current climate dilemma.
I’ll be interested in reading the answers you share in comments, but probably won’t be responding much. [ I may moderate a bit if the discussion devolves into name-calling.]
# # # # #
This article is a scorcher.
This is not “sponges” it’s oceanic outgassing. It is the higher temperatures leading to CO2 increase not CO2 emissions leading to higher temperatures.
At least he’s noticed there is an “anomaly” in attributing dCO2 to emissions. Although he apparently thinks this indicates some other kind of environmental catastrophe.
Look like Gillis has just discovered what most readers here have known for years. Short term dCO2 is strongly correlated with SST.
That graph is NOT showing CO2 concentrations , it is showing the annual change in CO2 ie rate of change.
Maybe you should not have cropped off the title of that NYT graphic when you reproduced it here. 😉
The years 1964 and 1990 needs to be explained.
The only way they can pin the increase of CO2 on human caused emissions is to postulate a ridiculous half life of 1000 years. In other words, the extra human caused CO2 has to stay in the atmosphere forever or their arithmetic doesn’t work.
It is probable that CO2’s residence time is much shorter than is needed for CAGW to work. link
The geological record shows that CO2 lags temperature. That’s exactly what we’re seeing as the planet rebounds from the LIA. Here’s a possible explanation.
There are reasons why CO2 increases with increasing SSTs at a rate greater than can be explained by Henry’s Law.
Greg June 27, 2017 at 12:07 am
HA, I will agree that most readers here have been told about that correlation between dCO2 and SST for years and years, …….. but very, very few of said readers have ever admitted to actually knowing about or agreeing with that direct correlation.
And on the contrary, quite a few of said posters hereon have specifically stated their disagreement and/or disbelief in/of said direct correlation between dCO2 and SSTs.
Most claim or infer a belief that human emissions (anthropogenic) of CO2 into the atmosphere directly correlates to the increase in CO2 ppm ………. but there has never been any evidence provided that defines a “human signature” in any of the measured/recorded CO2 ppm data or proxy records, graphs, etc.
commieBob June 27, 2017 at 3:45 am
The following was excerpted from your above cited “possible explanation” hyper link: https://wattsupwiththat.com/2017/03/15/study-why-co2-levels-are-lower-during-global-cold-periods/
The simplest explanation for the above stated “scientifically factual observation” is that the rate-of-microbial-decomposition of dead biomass is severely restricted when the near-surface air temperature averages remain below 60F, …….. as well as does the reproduction rate (population increases) and the biomass ingestion rate of most every species of land based animals: insects, reptiles, birds, etc., etc., and humans.
Greg,
If humans emit about twice the increase in the atmosphere, where does the human emissions get? Into space?
Indeed temperature does influence the sink rate into the oceans and even more into (tropical) vegetation. The latter is even a net CO2 source during El Niño years. That is the year-to-year variability in the rate of change you see.
Even so in all years of the past near 60 years, nature was a net sink for human CO2 at a surprisingly linear rate (e-fold decay rate of ~51 years) with the excess CO2 level above the equilibrium CO2 level (~290 ppmv) for the current ocean surface temperature:
http://www.ferdinand-engelbeen.be/klimaat/klim_img/dco2_em2.jpg
BTW, both the oceans and vegetation are proven, measured sinks for CO2…
The repeated use of hyperbole has the opposite of the intended effect. We are bombarded with exaggerations of all kinds every day. The advertising industry specializes in this sort of dishonesty. Look at every ad for a new car. They all start with this statement: “Introducing the all-new XXX” where XXX is the brand name. How long could an automobile manufacturer stay in business if it had to create an “all new” model every year? Following that absurd claim, we see the car speeding down a beautiful country road with not another vehicle in sight. The reality? You drive it off the lot into the daily commuter traffic jam.
Just ignore this kind of noise. It’s a sign of desperation on the part of the alarmists.
Hysterical warmist headlines are making their shrinking pack of True Believers look just as nutty as the Purple Shroud People at this point. I honestly think most of the world as long since moved on. We’re three weeks out from the Paris Purge and the number of articles in any media touting “climate change” have greatly decreased, which leads me to believe they’re just not getting the clicks anymore.
Are you referring to Heaven’s Gate? Their dead bodies were covered by squares of purple cloth.
Mass delusion has happened at all times and places. The problem is well documented. link
CAGW may go down as the greatest mass delusion ever.
http://www.express.co.uk/news/science/824088/Stephen-Hawking-Donald-Trump-climate-change-venus
professor hawking says trump is going to make earth 250degrees hot with boiling sulfuric acid skies.
i heard in on his speak & spell.
Termites like warmer weather ?
Yes, and help prevent desertification. https://pindanpost.com/2015/05/21/termites-worms-winners/ “Termites and other ecosystem engineers may buffer the effects of anthropogenic global change in some of the world’s most environmentally and socioeconomically sensitive regions” …
Because people aren’t the only source of CO2?
Brogie62
You are correct about that. The annual natural total is about 92 Gigatons. We provide about Gt 3. If our rate drops to 2.9 and the natural rate rises to 92.2 (0.2%) then the AG reduction is smothered by the natural rise.
This is one of the things I’m most confused about. I seem to recall a WUWT article some considerable time ago claiming figures like you claim here but the figures were later retracted and adjusted to show a considerable fraction of atmospheric CO2 now having a human origin. Can we get to the bottom of what the true figure is and how it is measured or calculated?
cephus0,
You are entirely right, too many people fall in that trap: the natural input is about 150 GtC (as CO2) per year and the human input is about 9 GtC/year. That is about 6%. So human CO2, measurable in the atmosphere as that has a much lower 13C/12C ratio and zero 14C, can never be higher than 6%. But we measure around 9%, what’s up with that?
The point is that not many people are bookkeepers which do show the total balance: the 150 GtC/year natural input is more than compensated by 154.5 GtC/year natural output. Thus the net balance of all natural fluxes together currently is -4.5 GtC/year… In all years of the past 60 years, nature was a net sink for CO2 and (near) all increase in the atmosphere is by human emissions. The temperature increase of the ocean surface was good for about 10 ppmv of the 110 ppmv increase since ~1850.
See further for a comprehensive background:
http://www.ferdinand-engelbeen.be/klimaat/co2_origin.html
One simple answer was provided by Jamaal Munshin in one of his many highly readable pieces on climate statistics: there is no indication of a causal relation between CO2 and temperature, using a statistical method often used by economists to disentangle a possibly causal relation from a simple noncausal but high correlation.
Lance Wallace ==> Link to Jamal Munshin’s paper “Unstable Correlations between Atmospheric CO2 and Surface Temperature“.
Lance,
Does that mean that there also is no reverse causal relationship between temperature and the CO2 increase (rate)?
Overstatement to say the least. There are serious questions about how the NOAA historical temperature chart was created, as it seriously differs from US historic temperatures, and most other places where people were actually keeping records. Tony Heller has gone on at length on that topic, and I am not quite up on the criticism of his work, but he does make a prima facie case that there has been fitting reporting to theory, not vice versa.
I agree with this.
Global average temperature trend component includes both global warming component [IPCC says it started in 1951] and the ecological changes component [warmer component is over emphasised in ground based data series] which is present starting from even before industrialisation. The ecological changes component has nothing to do with CO2 but this is part of the correlations.
Dr. S. Jeevananda Reddy
Tony has done a spectacular job of resurrecting past climate/weather records and newspaper articles that Warmists would prefer remain buried and forgotten.
He enjoys insulting people on twitter, but when people have legitimate criticisms of his work, he has responded by changing some of his analyses. I good example would be how he went from talking about average temperatures to talking about maximum temperatures to talking about % of daytime records over specific temperatures. This was in response to criticisms about time of observation bias not being captured in the historical temperatures that he is most expert in.
He has also published temperature records using only stations that have been continuously recording since year 19XX, or only stations that were reporting morning temps back in the 1930s. I think he has done a remarkably nimble job of hammering home that historical temperature records from the US, which are some of the only legitimate long-term temperature records on earth, strongly contradict the narrative being sold by the Warmists.
The main criticism of Tony seems to be that one time Anthony Watts said something bad about him. Most establishment Warmist steer well clear of engaging Tony, and certainly won’t debate him or his data.
+1
I would agree that Tony has done some good work, but his main failing is refusing to admit when he is wrong.
This was the basis for the WWT angst towards him on the freezing of CO2 in Antarctica discussion. https://wattsupwiththat.com/2009/06/13/results-lab-experiment-regarding-co2-snow-in-antarctica-at-113%C2%B0f-80-5%C2%B0c-not-possible/
I have experienced something similar when he tried to use old photos of Pacific islands as proof of no sea level rise damage on Twitter, but when I pointed out he was comparing two different islands….just crickets. It would have been easy for him to say my mistake but add there is still no proof of sea level rise damage in the Pacific which would have been perfectly acceptable.
All that aside…what he does is important work and I admire him for being so persistent and remaining strong under adverse circumstances in the climate debate.
Some of Tony Heller’s graphs were used in a presentation for President Trump, before Trump pulled out of the Paris Accord. I would love to have been a fly on the wall at that presentation. 🙂
The NOAA graph needs fixing (or at least a note that the label is wrong). The title says it’s since preindustrial times, but it looks like only the satellite record time slice.
Bob ==> The link to the NOAA graph is

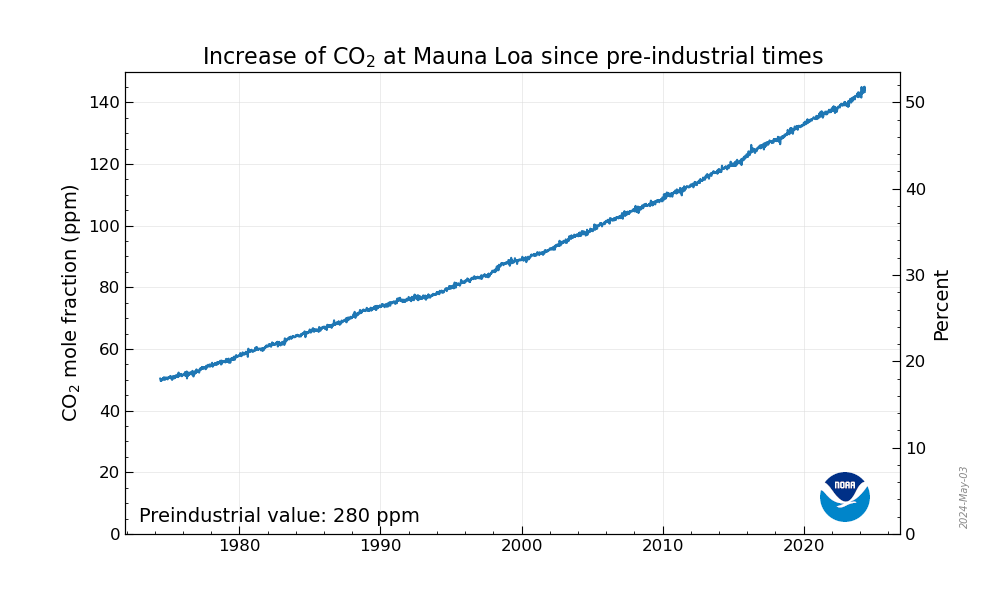
If you open the image alone at that link, you see the tiny print that says “Preindustrial Value: 280 ppm” in the lower right hand corner. So the graph represents the increase from that time, from that value.
Poorly titled, as you say.
So… I wonder if Justin Gillis and the NYT think Earth used to be Venus?

Venus has a sulfuric acid cycle instead of Earth’s hydrologic cycle. Much higher temperature with such working fluid.
Venus is 40 million KM closer to the sun. Venus rotates clockwise in retrograde rotation once every 243 Earth days. Venus’s atmospheric pressure is ninety times that of Earth.
Sharp Rise in Levels of Earth-Scorching Hyperbole
CO2 outgassing from warmer ocean, especially during El Nino a contributing factor.
Less CO2 taken up by warmer surface water . . I think ; )
“If the amount of the gas [CO2] that people are putting out has stopped rising, how can the amount that stays in the air be going up faster than ever?”
Nature is in charge of the production of 96% of the CO2. Variations in this can dwarf what man produces. If the temperature rises, the oceans will expel more. If it cools, the oceans will suck it up.
ntesdorf,
Wrong reasoning, Nature sucks up 97% of all emitted CO2, for 94% natural + 6% human alike. Thus about 3% remains in the atmosphere. Natural variability is +/- 1.5% in the past 60 years, thus smaller than current human emissions, except for the extremes like the 1998 El Niño.
Sadly, the New York Times stopped employing journalists in the late 1990s. I never read the rag anymore. It used to be the gold standard of “all the news that’s fit to print.” Now it’s full of politically-slanted hyperbole. What a fall.
(all the news that’s printed to fit)…
The NYT has become a linchpin of the Blue Bubble Circle-Jerk; all they do is quote each other, round-robin:
WashPo, The New Yorker, The Atlantic, New York, NPR, HuffPo, and NYT. It really is laughable when you track each others’ references from day to day. It’s like a bunch of cultists sitting on a desert island, convincing each other that the sky is really green and the water orange.
The New York Times has been a partisan, political rag since at least the Vietnam war. They have been pushing the socialist agenda since at least that time. As have all the other news media outlets of the time. They are all propaganda organs for the Democrat party.
They wouldn’t know a “gold standard” if it walked up and bit them.
Piper ==> Cute.
One of the funniest ‘cartoons’ I’ve ever seen, still laughing…
https://youtu.be/jdP8TiKY8dE
Fake news Trump/Russian story more important to CNN than Trump/Paris Climate story. Apologies if this stuff is well known in US but even surprised me.
It’s just breaking here, som . . on top of the already collapsing narrative, and a widespread *CNN is fake news* sentiment . . O’Keefe is an eviscerator
Climate change is just business, perhaps not as big as Russia is to the mainstream media, but to climate scientists it’s all they have, which keeps them employed (gainfully).
Major government labs are usually run by big business, not the government, at least in the U.S. It’s not unheard of for top administrators to make around $1 million/year in salary, benefits, bonuses. Their corporate bosses make even more. Jagadish Shukla has been able to benefit himself and family members by millions, but he really isn’t a worse offender. Substitute climate change for Russia and climate science for media in these videos and realize that climate change is business too.
http://www.veritaslive.com/06-26-2017/americanpravdacnn.html
Warming oceans hold less co2 thus co2 will continue to rise in rhythm with the warming of the oceans . Anthropogenic sources have little or nothing to do with it
https://climategrog.wordpress.com/ddt_co2_sst/
There is strong link between short term changes in CO2 and SST. How much of the underlying long term rise can be attributed to out gassing is uncertain, though it clearly is not zero.
Thanks for you heartfelt, unsubstantiated assertion.
Greg,
Per Henry’s law: the influence of the ocean surface temperature on atmospheric CO2 levels is about 16 ppmv/K at steady state. Proven by over 3 million seawater samples taken in the past century and the temperature/CO2 curves over the past 800,000 years.
For the current average seawater temperature, the CO2 levels would be 290 ppmv at steady state. That means about 10 ppmv increase over the past 60 years, the rest comes from humans…
The answer to his question is in Harde 2017 and Salby’s videos and Humlum 2014. The increase in atmospheric CO2 is not due to human emissions and in fact does not correlate to our emissions. Human emissions are less than 2% of the annual flux from natural sinks to natural sources. They are lost in the noise of the system and have to date only accounted for about 4% of the increase in atmospheric CO2 not 100% of the increase as assumed by the IPCC. The message will become apparent as human emissions plateau as they have for three years and atmospheric content stays on its long time trend because it is controlled by an integral function of global temperature. The natural sinks are increasing not failing as shown by the greening we have seen.
DMA,
Hardem Salby and Humlum are all wrong, simply as a correlation between the noise around a trend doesn’t say you anything about the cause of the trend, only about the cause of the noise.
And comparing the non-detrended temperature increase with the detrended CO2 increase is completely unphysical…
Scorchio!
After all, The New York Time and The Pulitzer Prize were founded by an illegal migrant!
“Red Herring” strawman; specious claim to support Justin’s sophistry and scare tactics.
Justin is very similar to a fraud yelling “fire!” at the back of a filled theater; where fire does not exist.
Thirty years on and alarmists still rely upon imaginary future disasters.
Justin sources this as his future disaster fantasy basis.
An activist who runs a “carbon” web site devoted to anthropogenic carbon molecule emissions.
This activist, Canadell, was quoted in an article speculating on little to no evidence or science.
From a quick look, the alleged research conducted by Canadell’s group is of no better quality than speculation with lots of anthropogenic blame assigned.
No oceans involved.
No ocean calcium dense basins are involved.
No incredibly massive inestimable limestone reservoirs are mentioned.
No apparent definitive carbon dioxide measurement systems, just guesswork.
No definitive or specific mankind emissions tracking mechanism.
All to demonize an increase of 1.2-1.3 molecules of carbon dioxide per 10,000 molecules of atmosphere; before relating what an increase of 1.2-1.3 molecules of carbon dioxide to Earth as a total; including land, ocean and 9,996 molecules of atmosphere.
Canadell cried “rabid dog” and Justin screamed “rabid bear(s)”.
Not of, by or for science, instead it is all for their cause.
In Canadell’s case it is to keep funds flowing to his “global carbon project”, in Justin’s case it is to foment teeth gnashing and unrest.
Clean, green, renewable CO2.
CO2 – the fuel of life.
Three sister planets’ atmosphere:
Venus 95% CO2
Earth 0.04% CO2
Mars 95% CO2
Which one currently supports CO2 consuming Carbon Based Life?
To identify flows that cause changes in atmos co2 we need a co2 budget but we don’t have one. The IPCC carbon budget is fiction because it does not take uncertainty into account. For details …
https://papers.ssrn.com/sol3/papers.cfm?abstract_id=2654191
It also understates volcanic CO2 emissions by an order of magnitude or more.
Jamal,
You do make an essential thought mistake in your work: the errors in the original fluxes are not propagated into an overall error, as you have calculated, but the overall error is known as the sum of only two errors: the error in the measurements of CO2 in the atmosphere and the error in the emissions inventory. The first is less than +/- 0.2 ppmv, the second is less than +/- 0.25 ppmv, or even summed up less than +/- 0.45 ppmv…
That is by far more than sharp enough to have an accurate budget…
People should read you more. There is not much skeptical space in the carbon budget. The ocean is a sink, and a warming ocean is still a growing sink unless one talks about short, El Nino or ENSO affected periods.
The oceans have orders of magnitude more CO2 that the atmosphere and events like el nino can make CO2 emissions from humans look like a burp and a warming planet drives CO2 levels?
In the past CO2 levels have been more than ten times what they are today and in those times there were both warm periods and ice ages. There is no real evidence that CO2 has any effect on climate and plenty os scientific reasoning to support the idea that the climate sensivity of CO2 is really zero. Hence CO2 cannot be scorching, In terms of the AGW conjcture, H2O is the primary greenhouse gas so water, clouds, fog. snow and rain must be scorching too.
Indeed! There is a stunning contradiction as the “dangerous” part of the claimed warming effect of CO2 is the model-driven amplification by water vapor, yet direct emissions of water vapor are dismissed as not significant. I did the math a while back, to find that a typical coal-fired power plant using evaporative cooling would emit on the order of 5 times more water vapor (by mass) than its CO2 emissions from combustion. So we have the absurdity of the EPA (in its endangerment finding documents) arguing correctly that anthropogenic emissions of water vapor are not significant, not realizing that for the same reasons, CO2 cannot possibly have the claimed effect with such an excess of water available on earth’s surface and in the atmosphere to help drive the atmospheric heat engine. Imagine the NYT screeching “RISING LEVELS OF EARTH-SCORCHING WATER VAPOR!” as summer has arrived with its higher humidity.
In reality the feedback effect of H2O is negative. Besides beig the primary so called greenhouse gas, H2O is a primary coolant in the Earth’s atmosphere moving heat energy from the Earth’s surface which is mostly some form of H2O to where clouds form via the heat of vaporization. According to some energy balance models, more heat energy is moved by H2O via the heat of vaporization then by both convection and LWIR absorption band radiation combined. The cooling effects of H2O is further evidenced by the fact that the wet lapse rate is significantly less than the dry lapse rate and hence more H2O allows more heat energy to flow up into the atmosphere where it is radiated out to space. So much of the AGW conjecture is just wrong.
oh and NOAA were “stunned’ apparently, by the el nino caused CO2 spike. That suggests they dont understand the oceans very well when it comes to releasing CO2
Trump should defund stunned scientists. We don’t need stunned people.
Back many years ago, Earth processes were stagnate and/or in decline because of a lack of Carbon Dioxide in the atmosphere. Human activities began to add CO2, slowly at first, then more rapidly with industrial processes using coal, oil, and natural gas.
Earth processes that use CO2 picked up usage. For example, green plants grew faster and more lush. With CO2 going from 300 to 400 ppm, rapid response processes reached the upper-right breakover point of the “S”-shaped or sigmoid curve.
Other slow-response Earth processes, plus the former rapid-response ones, continue to take CO2 from the atmosphere. I think this is what Mr. Gillis is trying for with his wording “… the natural sponges that have been absorbing carbon dioxide are now changing.” Still, it does not mean catastrophe like he thinks it means.
PS: It is a very good thing that Pres. Trump did not use the word “sponges” in any of his tweets. The twits of the twitterverse would have gone ballistic.
This reminds me of George Carlin’s – The Universe Wanted Plastic.
http://www.drroyspencer.com/wp-content/uploads/c13-analysis-results.jpg
The official party line is that the interannual variability has a differing source than the longer term anthropogenic trend. (shouldn’t a NYT journalist know this?)
Maybe it is that co2 follows temperature rise by about 800 years we are getting the outgassing from the oceans from the end of the Medeaval warm period.
Kip Hansen:
You ask
I refer you to one of our 2005 papers; viz.
Rorsch A, Courtney RS & Thoenes D, ‘The Interaction of Climate Change and the Carbon Dioxide Cycle’ E&E v16no2 (2005)
It provides six models of the carbon cycle system. There are three basic models and they each assume a single mechanism dominates the carbon cycle system. In each basic model it is assumed that
1. the rise is purely natural
and
2. there is a significant anthropogenic (i.e. from humans) contribution to the rise in atmospheric CO2 concentration.
Thus we provided six models.
Each of the models in that paper matches the available empirical data without use of any ‘fiddle-factor’ such as the ‘5-year smoothing’ the UN Intergovernmental Panel on Climate Change (IPCC) uses to get its model (i.e. the Bern Model) to agree with the empirical data.
The superior performance of each of our models over the IPCC’s Bern Model results from our modelling assumption. The Bern Model uses the assumption of anthropogenic CO2 emissions being in excess of what nature can sequester (which is now refuted by the OCO-2 data). Our models assume something has altered the equilibrium state of the carbon cycle system.
The carbon cycle is always moving towards its equilibrium state but never reaches that state because the equilibrium state is constantly changing.
Some processes of the carbon cycle system are very slow with rate constants of years and decades. Hence, the system takes decades to fully adjust to a new equilibrium. The observed rise in atmospheric CO2 is easily modeled as being continuing slow adjustment towards an altered equilibrium.
This raises the question as to what may have altered the equilibrium of the carbon cycle.
One possibility is the anthropogenic CO2 emission. In our models the short term sequestration processes can easily adapt to sequester the anthropogenic emission in a year (which is now confirmed by the OCO-2 data). But, according to our models, the total emission of that year affects the equilibrium state of the entire system with resulting rise in atmospheric CO2 concentration as is observed. This possibility is real but unlikely.
Natural factors are more likely to have caused the alteration to the equilibrium of the carbon cycle system. Of these, the most likely cause is the centuries-long rise in global temperature which is recovery from the Little Ice Age.
Almost all the CO2 moving in the carbon cycle is in the deep oceans and the limiting rate of change of atmospheric CO2 concentration is the rate(s) of exchange of CO2 between deep ocean and the ocean surface layer. Indeed, the drop in decadal atmospheric CO2 growth rate for the 1990s (see the horizontal bars in your plot of annual growth rates) is to be expected because global temperature did not rise between ~1940 and ~1970
Richard
Interesting. Two questions:
1. Do your models account for changes in the carbon isotope ratio?
2. The ice core records seem to max out at about 280 ppm CO2, even during periods that were warmer than the present. How do you account for that?
Thanks, M.
Michael Palmer:
You ask me two questions pertaining to the models in one of our 2005 papers. I answer each question in turn.
Q1.
“Do your models account for changes in the carbon isotope ratio?”
A1.
The models (e.g. as used by the IPCC) which assume the sinks for CO2 are overloaded provide atmospheric carbon isotope ratio changes that disagree with observations by a factor of 3. This is overcome by assuming “dilution”. Our models provide similar discrepancy but require less assumed “dilution” to obtain agreement with observed reality.
Q2.
“The ice core records seem to max out at about 280 ppm CO2, even during periods that were warmer than the present. How do you account for that?”
A2.
Stomata data indicate the ice core Indications (n.b. NOT “records”) of paleo atmospheric CO2 concentration are wrong. There are several reasons why the ice core data of CO2 are misleading. For example, it takes many years for the firn to solidify to sealed ice and atmospheric pressure variations ensure mixing of the gases in the firn during that time which the IPCC says is 83 years. If the sealing time is 83 years then rise of atmospheric CO2 observed at Mauna Loa since 1958 could not be observed because data points would be average CO2 concentrations from two adjacent 83-year periods which as yet do not exist. If you are not familiar with the stomata data then this is a good introduction: As David Middleton there says
Richard
Michael Palmer:
My link did not work for some reason. It is
https://wattsupwiththat.com/2010/12/26/co2-ice-cores-vs-plant-stomata/
Richard
Thanks, Richard. I wasn’t aware that the IPCC models don’t fit the changes in isotope ratios.
You are of course right that the ice core CO2 levels are smoothed in time. I’d go further and say that nobody really knows for certain exactly what the smoothing interval would be. As an aside, I also don’t buy the oft-repeated point that in the ice cores changes in CO2 lag those in temperature – too many assumptions go into this determination to be certain.
Still, whatever the smoothing interval, one would expect sustained periods of high temperatures – the Holocene optimum, or most of the Eemian – to show higher CO2 levels than those following the little ice age.
Thanks for the link to David Middleton’s piece on plant stomata, very interesting.
Michael Palmer,
I have had years of discussion with Richard about their models, but have not seen much progress since then…
About the human isotope “dilution”, that is quite simple: about 20% of all CO2 each year is replaced by CO2 from the oceans and vegetation with for the (deep) oceans a much higher 13C/12C ratio than what human emit. One can use that difference to calculate the total deep ocean – atmosphere exchanges, which gives following curves:
http://www.ferdinand-engelbeen.be/klimaat/klim_img/deep_ocean_air_zero.jpg
Thus at ~40 GtC/year deep ocean CO2 throughput, the current drop in 13C/12C ratio with human emissions is completely explained.
The same ~40 GtC/year deep ocean – atmosphere exchange was independently calculated from the decay of the 14C spike of the atomic bomb tests in the 1950’s.
Ice core data are far more reliable than stomata data and Richard is completely wrong on his remarks: there is even a 20 year overlap (1960-1980) between high resolution (less than 10 years) ice core CO2 data from Law Dome and direct measurements at the South Pole:
http://www.ferdinand-engelbeen.be/klimaat/klim_img/law_dome_sp_co2.jpg
Richard refers to the article by Dave Middleton about stomata data, but I have commented there too:
https://wattsupwiththat.com/2010/12/26/co2-ice-cores-vs-plant-stomata/#comment-559340
Ferdinannd:
NO! You are “completely wrong” in your trust of the misleading ice core data and dismissal of all the information that refutes its misleading indications. But you always ignore anything that refutes your mistaken narrative which pretends to know the cause of the recent rise in atmospheric CO2 concentration.
I again refer readers to the excellent comparison of GEOCARB, stomata and ice core data of paleo atmospheric CO2 concentrations provided by David Middleton that can be read at
https://wattsupwiththat.com/2010/12/26/co2-ice-cores-vs-plant-stomata/
and concludes
I agree ( indeed, I said) that assumed “dilution” can explain the gross disagreement between the expected and observed isotope changes. But so what? The discrepancy is a factor of 3 and the “dilution” explanation is merely a possibility that cannot be known to be true,
Richard
Richard,
Geocarb has a “resolution” of thousands of years, thus can’t show any short term variability and completely based on proxies of which absolute level one can have a discussion. Stomata data too are proxies, which need to be calibrated to… ice core data, still the gold standard, even for stomata people. Stomata data show the CO2 variability over land where the plants grow, not the global CO2 variability.
Simply said, if the stomata data have an average that differs from the CO2 measurements over the period of the ice core resolution, then the stomata data need recalibration, not reverse…
Ice core CO2 are direct measurements of CO2 in the ancient atmosphere, not a proxy, be it from a mix of years, not of one moment or one year (neither do proxies, but stomata have a better resolution). Ice core CO2 measurements are done with the same measurement equipment (NDIR, GC, mass spectrometer) as direct CO2 measurements in air.
BTW, the difference in CO2 levels, averaged over a year between Barrow, Alaska and the South Pole is less than 5 ppmv, with an increase of ~2 ppmv/year, starting in the industrial NH. During deglaciations the “speed” of CO2 increase was 0.02 ppmv/year, thus ice cores show global CO2 levels, be it mixed over one to several decades.
I know, your “knowledge” of ice core data is highly influenced by the late Prof. Jaworowski, but his main objections from 1992 against ice core data were completely refuted by the work of Etheridge e.a. from 1996 on three ice cores at Law Dome with extreme high resolution.
Etheridge used three different drilling techniques (dry and wet), measured CO2 in atmosphere and firn down to closing depth and in the ice. No differences found between air in still open pores and already fully enclosed bubbles at closing depth. The difference between average air age in the first fully closed ice and the atmosphere was only 7 years, while the ice surrounding it was already 40 years old. The 40 years closing time and the less than 10 years resolution have nothing to do with each other, only that both are influenced by the local snow precipitation rate.
Even the 560 years resolution of the 800,000 years Dome C ice core are sufficient to show the current increase in CO2 over the past 165 years, be it with a smaller amplitude.
And the 13C/12C ratio “dilution” is as good a proof for the human contribution as adding an acid to a solution and expecting a lower pH…
Richard Courtney ==> Thanks for the thorough reply — interesting.
Kip Hansen:
My pleasure.
In 2008 at the First Heartland Conference I gave presentation of the work, and a video of me doing that can be seen at
https://l.facebook.com/l.php?u=https%3A%2F%2Fwww.youtube.com%2Fwatch%3Fv%3DeQtRB60kU60&h=ATObYgy_MOvn8v_bXywxJvXiDXI72PNMaVhk3Kjjk0yNrZGTFxx6gqZibKQ2XmB7Willoh_p9HTzOLg-U4y2x_Wqtg-hgU3jGcOP0Y4FVSRKVofIyHDGAtJHHqDKUrSVNDI4
The video fails to show the visual illustrations I presented but it is comprehensible despite that, and it commences with my providing a parody of a ‘fire ad brimstone’ sermon which may amuse you.
Richard
Richard,
I have looked at that presentation (and the following about the ice cores). Indeed it is mathematically possible to have human emissions as main cause of the CO2 increase as good as mainly natural causes or any mix in between.
What decides is in how far the different solutions match with all the observations. That is only the case for human emissions, which fits all observations. Natural causes as main drivers all fail one or more observations…
Ferdinand:
The ‘overloading’ hypothesis is no better fit to observations than any of the many other possible causes of the recent rise in atmospheric CO2 concentration. Assumptions must be made to obtain a fit of any of them to e.g. the isotope data.
The ‘overloading’ hypothesis (which you promote) is the only one of the suggested causes which is directly refuted by observations; i.e. the satellite data indicates that anthropogenic CO2 emissions are completely sequestered near to their emission sources.
Richard
Richard:
the satellite data indicates that anthropogenic CO2 emissions are completely sequestered near to their emission sources.
Sorry Richard, the OCO-2 satellite has a resolution of about 0.1 ppmv. Human emissions are 0.01 ppmv/day. Even if most emissions are in 10% of the earth surface and the satellite can focus on specific areas for a longer period, enhancing the resolution, it will be a hell of a job to detect any human emissions.
Thus using that as an argumentmakes no sense, the more that in every year in the past 60 years nature was not able to sequester all human emissions, or the increase would be not more that 10 ppmv, as that is the change in solubility of CO2 in seawater with increased temperatures in the past 60 years…
What happened to that O-C-O illustration?
I have since looked for it but it seems to have been removed from the,NASA website
“The New York Times” is an anagram of “The Monkeys Write.” The monkeys make stuff up, too.
Climate4you is brilliant at presenting climate data with great clarity IMO.
The annual changes in CO2 concentration appear to trail the temperature changes by maybe 4m – 6 months in this presentation:
http://www.climate4you.com/images/DIFF12%20GlobalCO2%20HadCRUT4%20HadSST3%20Since1958.gif
How can anyone look at that graphic and not conclude that a (very) temperature sensitive ‘thing’ is creating the CO2, I Do Not Know.
Maybe those with their eyes closed, fingers in ears and going lalalalalala – those afflicted by magical thinking.
Those who cannot be bothered to think, cannot be bothered to do and/or those who pass their thinking buck to others and go with the prevailing crowd.
The temperature sensitive ‘thing’ being soil bacteria.
Is it not a rather wierd coincidence that the temp inside your fridge – below 5 degC (when bugs stop working) is also the temperture that farmers, gardeners and growers know to be the same temp where seeds don’t germinate and plants stop growing.
Coincidence. Not.
Does anybody think about that. Does nobody wonder about stuff anymore? Can nobody put 2 and 2 together and have the guts to speak out the answer?
Its obvious that they are gutless, that they don’t think or don’t want to know, yet the rate doubling thing is something that they should have learned in school, pretty elementary school at that.
Is is that *all* chemical reactions and hence bacterial activity double their rate/speed every time the temp rises by 10 deg C.
The whole mess surrounding CFCs and ozone would never have got the legs it did if someone had just insisted on a rigourous response to that question?
And no-one has insisted on a rigourous response to how the GHGE works and it has resulted in tower blocks of houses being doused with gasoline and, under Government Mandate, almost every building in the UK and Europe being stuffed full of, and clad with, ‘non-flammable oil’
Do you laugh or cry?
Dimicandum.
I am sure that many plants, especially food crops, stop germinating or growing below about 40 F; however, from personal experience in the plant fields (mainly daylilies, in my case), I can say that certain ones grow slowly but perfectly well right down to freezing, while others stop pretty much all activity at 50 F or even higher. With no experimental apparatus, I can’t say that higher CO2 levels could affect those temperatures; but it seems possible, perhaps likely. If I leave my more “tropical” houseplants outside (they stay out from mid-April or early May to early November here in central Virginia), a 35-degree night can stop most of them from growing, and even seemingly freeze some of them (i.e., they die). I have learned to take them in if the forecast goes below 45 F. As for germination: I try to get my seeds planted outdoors by March 15. Some seeds germinate in a couple of weeks, with still some freezing weather ahead of them; they don’t seem to care. Others wait 5 or 6 weeks, thus escaping late freezes. How do they know to do this? All I can say for sure is that they didn’t hear it from me . . .
Peta from Cumbria, now Newark June 27, 2017 at 1:40 am
Its obvious that they are gutless, that they don’t think or don’t want to know, yet the rate doubling thing is something that they should have learned in school, pretty elementary school at that.
Is is that *all* chemical reactions and hence bacterial activity double their rate/speed every time the temp rises by 10 deg C.
Unfortunately your elementary school misled you: all chemical reactions do not double for an increase in temperature of 10ºC. If that were true all reactions would have the same activation energy!
The whole mess surrounding CFCs and ozone would never have got the legs it did if someone had just insisted on a rigourous response to that question?
Since the detailed reaction kinetics for that process has been determined your question based on an elementary school misunderstanding of chemical kinetics is easily refuted.
Peta from Cumbria,
Indeed the CO2 rate of change (in this case diff12) follows the temperature rate of change with a few months, but that is all about variability. Have a good look at the trends in that graph: diff12 of temperature has no trend, while diff12 of CO2 has a firm trend.
That shows that temperature is responsible for all year by year variability, but not for the bulk of the trend…
Most of the CO2 increase thus is not by temperature…
“I think that the question is apt and extremely important — it may be, or contain, the key to the current climate dilemma.”
Kip, as a writer surely you know the definition of trivial.
As a parent, as a navy officer, as an engineer it is extremely important to know what is extremely important to differentiate between what is trivial and important.
A dilemma is letting 16 year old children learn to drive. So far this year this will not be an important for the parents of 14 US babies let to die in a hot car.
My theory is that writers are interested in ppm CO2 as a mechanism to avoid real tragedies. In a PC world we can not be insensitive to parents suffering a tragedy.
Kit ==> Well, important for Climate Science — how important climate science is is another matter altogether.
For 45 years, I never heard of climate science. It used to be that California regulated how many windows you could have to prevent building more nukes. Now climate change is the excuse for such regulations.
It is a clear pattern. Idiots with the moral values of pond scum want to tell me how to live.
Kip please be offended. The ability to craft a coherent sentence does not imply any skills related to understanding science or making good moral choices.
New headline “New York Times Makes Mountain Out of Molehill” 🙂
Looks like the data shows that eruptions like mount Pinatubo don’t spew out much CO2 even though it caused a lot of cooling. Or Gaia is so in sync with her body that she just sucked up that 3% extra but natural CO2.
Robert,
Volcanoes don’t spew that much CO2, but the case of the Pinatubo is quite interesting: not only there was a slight reduction in temperature by the extra dust in the stratosphere, but also a huge extra CO2 uptake by vegetation due to the scattering of sunlight by the dust, which made that leaves normally part of the day in the shadow of other leaves, received enough light to go on with their photosynthesis…
If the amount of the gas [CO2] that people are putting out has stopped rising
The first question I would ask is, has it? Data on fossil fuel usage on a global basis can hardly be exact. Plus there’s a massive black market due to terrorist organizations like ISIS selling oil. Then there’s the OPEC countries, many of whom claim to be cutting back production to support the price of oil, yet the price of oil continues to fall. These are not countries known for altruistic honesty. Plus you have governments virtue signaling themselves to death, insisting that they are taking action and getting results while doing little or nothing. Do you take coal consumption stats from China at face value for example? I don’t.
If it actually IS falling, then that’s a different matter, I’d recommend richardscourtney above.
Isn’t there a fairly recent satellite that can measure CO2 emissions all over the world? Why isn’t it being used instead of ground-based, corruptible estimates?
Roger,
Hardly accurate enough: as human emissions are about 0.01 ppmv/day and the OCO-2 satellite has an accuracy of ~0.1 ppmv, it will be a hell of a job to find any human CO2. Even if concentrated within some 10% of the earth surface and a possibility of the satellite to focus on hot spots for longer periods…
surely this is the fault of an over keen headline writer who got a bit carried away? I do know know this NYT author but many get embarrassed by the over sensationalised headline their piece is given.
tonyb
tonyb:
You suggest
Sorry, but your suggestion is flatly refuted in the above article where Kip Hansen writes
Richard
Mr Hansen, you asked:
“If the amount of the gas [CO2] that people are putting out has stopped rising, how can the amount that stays in the air be going up faster than ever?”
What people? According to published data, currently China and India are ‘putting out’ ever-increasing amounts of CO2, whilst the developed countries are putting out less. But the net result is that airborne CO2 is increasing (a bit). The REALLY important question is: does atmospheric CO2 drive global climate / temperature? I doubt it, as do many truthful scientists, partly because the oceans contain much greater amounts of CO2, and they outgas large amounts of CO2 if global temperatures rise, and vice versa. So rising temperatures CAUSE a rise in CO2, not the other way around. End of CAGW!
Hmm , up in the Arctic-
http://notrickszone.com/2017/06/26/since-2005-arctic-sea-ice-has-pivoted-to-a-slightly-increasing-trend-with-no-detectable-arctic-warming/#sthash.KADsi4DF.dpbs
Nytimes? Ethics? Haha!
If the NYT can’t misrepresent and decontextualize the climate issue they would have nothing to offer in support of the climate consensus.
Annual emissions have stabilized. At a value greater than zero. Thus total emissions are increasing.
Brain scorching stupidity at the NYT. How much more of this nonsense does the world have to suffer?
I’m surprised it wasn’t ” … Earth Scorching Russian CO2″
Like saying that I sleep under a bed scorching blanket.
There is big hole in this Climate Debate, namely volcanic and tectonic activity.
I am no expert here but gather, rightly or wrongly, that:
The total energy generated by this is in order of 40 to 45 TWatts per year which works out at some 0.078 W/sq.m and this renders it as insignificant. Hence the hole.
However this energy is random, localised and intermittent; but nonetheless continuous, being due mainly to the shifting tectonic plates which have defined our continents and climate for millions of years.
I gather that there are some 75,000 volcanoes and up to 1,000,000 subsea vents (aka: Black Smokers?) With 17? So called “Hotspots” dotted around. Iceland being one of them.
Additionally there are thousands of miles of both convergent and divergent Ridge/Rift structures all with various degrees of activity pumping energy into the oceans at different locations. These being the mid Atlantic and Pacific Rifts and the notorious Ring of Fire encircling the Pacific.
All this, being random in nature prevents inclusion in any computer models as chaos is anathema in simulation processes.
Meanwhile, where CO2 is concerned the temperature of the oceans respond to all this locally in conjunction with the atmospheric and radiative influences from above and this could well explain the dilemma posed here in this post.
And perhaps this also goes some way to explain many of the statistical events which cause such heat in our debates.
For instance: Beneath the Arctic there is the Gakkel Ridge which was active around the time of ice reduction in the area, I believe. Also the recent melt in the Antarctic Ross ice shelf, which again has an active Rift lying beneath, with Mount Erebus nearby. And then there is the problem of El Nino. Could this energy be due to subsea magma movement in or around the Pacific?
I certainly don’t know and neither do I have any means to validate any of the information I have listed above.
All I can say is that this obsession with CO2 is currently addling our minds.
The general Cli-Sci approach is to assume that things that are simply too difficult to properly quantify are therefore to be treated as insignificant. Ignored. To be fair, other disciplines also sometimes take the same approach, but not to the same degree, because they know they will get rumbled in less than a decade or two. Cli-Sciists know they can be safely retired and dead before most of their conjectures are proved wrong.
When the idea that an unquantified variable is insignificant becomes obviously untenable, it is often assigned an ‘estimated average value’. Of course, as you point out, there is often no justification for making these assumptions either, but they press on with an “It’s the best we can do” attitude. That the best they can do is still clearly not good enough, matters not one jot when continued funding depends on getting a result, be it a good, bad, or awful result.
“…we have to offer up scary scenarios, make simplified, dramatic statements, and make little mention of any doubts we might have.”
“Each of us has to decide what the right balance is between being effective and being honest.”
Climate Guru, Stephen Schneider.
Although he was addressing climate “scientists”, journalists and indeed all those in the pay of, or somehow beholden to Big Climate took Schneider’s words to heart as being given carte blanche to lie to their heart’s content. The ends (“saving the planet”) justify the means.
The CO2 growth rate will fall below 2.0 ppm in 2017 (after being at 3.0 ppm in the last two years).
Mauna Loa is already recording year-over-year increase below 2.0 ppm in the last several months.
————–
Humans are emitting more CO2 than the natural absorption rates of Oceans and Vegetation/Soils.
–> Human emissions +10.0 billion tons Carbon (flat for three years);
–> Oceans net -2.0 billion tons (but varies from -0.5 to -3.5 depending on ocean warming or cooling in the year) (-2.0 billion is composed of -94 billion tons in and +92 billion tons out each year)
–> Vegetation/Soils -2.5 billion tons (probably doesn’t change much from year to year) (-2.5 billion is composed of -150 billion tons in and +147 billion tons out each year.
Net CO2 change 2017 = Human emissions around +10.0, Oceans -3.5, Vegetation/Soils -2.5 = +4.0 billion tons Carbon growth = 4.0 / 2.13 Carbon to CO2 ppm = 2017 less than 2.0 ppm
————
The Ocean and Vegetation/Soils uptake has also been increasing over time as the CO2 concentration in the atmosphere has gone up or more accurately as the CO2 has increased above 280 ppm.
Ocean/Vegetation/Soils Uptake = [Carbon atm Current 405 ppm – Carbon 280ppm) * 1.8% = Uptake.
Ocean/Vegetation/Soils Uptake = [845 – 596] * 1.8% = Uptake = 4.5 billion tons (2.0 Oceans, 2.5 Vegetation/Soils) =
As CO2 rises further in the future, the net Uptake will also rise along with it potentially catching up to human emissions at some point in the far future, many decades out.
Justin & the Scorchers? 😉
http://cps-static.rovicorp.com/3/JPG_400/MI0001/805/MI0001805866.jpg
Plant food scorches Earth?
Proofs, please?
Natural sources of CO2 emissions must be increasing lately.
A complaint should be filed with the NYT Public Editor.
Oh wait …
https://www.nytimes.com/2017/06/02/public-editor/liz-spayd-final-public-editor-column.html
They were eliminated earlier this month.
#fakenews is now unfettered.
If you’re talking about “scorching” then it’s Maximum temperatures you’re talking about, not the Average. Besides, averages lose much of the information – it is useful to point out that the average of 51 and 49 is 50 and the average of 1 and 99 is also 50. Identical results very different inputs. When Johnny Carson prodded his audience with “It was really hot today” he didn’t have his jokes lined up to make fun of the average temperature.
Kip Hansen posted a graph from WUWT I did a while back, as it turns out it can be expanded to cover more than just the summer months. Climate at a Glance Maximum temperature trends for the United States May – October are flat back to 1921:
http://oi68.tinypic.com/2yu11eg.jpg
That’s 96 years!
Here’s an update of that map of the United States to illustrate what that looks like:
http://oi67.tinypic.com/10er3ps.jpg
My opinion is that folks on the skeptical side of the Climate Change debate way to often accept the language and terms from the other side. “Whoever controls the language controls the debate.” is a well-known quote and ought to be taken to heart. If they talk about scorching temperatures and show a blazing sun and dry cracked river beds then they’re talking about MAX temps not the average.
I should have pointed out that most of those states with a decline of over 80 years actually have declined since the 19th century.
Steve ==> For the record, I do not really approve of this type of “trend mining” — it is neither scientifically nor statistically proper. What your US graph shows is what the eye sees — rising Max Temps from 1900 to the highs in the 1930s, falling to the mid-1960s, flat thru the mid-1980-s, rising to 2000, flattish since. All in all with a RANGE of variability of about 3°F or 1.6°C.
It is interesting historically that on the scale of the last century, nothing much has changed.
Kip Hansen … at 7:40 am

…For the record, I do not really approve of this type of “trend mining”
“Trend Mining” as you call it is pretty much what the so-called “Pause” is all about. How far back in a particular time series can you find find the trend you are looking for. When it extends back just a few years, I am reminded of Skeptical Science escalator animated GIF:
They have a point.
But when you find trends that encompass the entire data set like the 19 states east of the Rockies do, they don’t have a point, at least I don’t think they do.
By the way I did toss out one value, Washington had an outlier negative trend since 1922, and would been assigned “Declined for over 80 years” Linear trend lines are like averages, they lose some of the information. Of means, medians and modes, modes can be multiples which linear trends more or less ignore.
Thanks for the comment.
Steve ==> What the Enforcers at SKS try to override with the longer term trend is that the whole Earth average temp seems to be step-changing to the tune of some combination of factors not understood or even really investigated today. It is unlikely that CO2 is causing that clear pattern that they point out, which is the topoic of the NY Times piece and this essay as well. The scientific thing to do is to investigate why the graph — if it means anything — behaves that way. Instead of being scientific, they take a political stance — Climate Consensus Enforcement.
If it were some other subject, like a medical study, this would be the hot topic of the year until the cause was found.
The point of my comment about trends is that any searched for trend can be found in any data that is irregular enough — even chaotic output, if mined for in that manner. Finding the trend does not MEAN anything other than you were able to find it over some period of time. It DOES NOT MEAN that the physical system producing the data is behaving in the way you might mean by finding a flat (declining or rising) trend over that period. It MIGHT mean what you are hoping to illustrate, and it might not. The finding of the trend is not evidence of anything.
If (note I said IF) car emissions are a major source of CO2, and the reason we have CO2 emissions at all from cars is due to catalytic converters, and the reason we have catalytic converters is due to government requirements, then the simple answer is to do away with catalytic converters.
That’s right those very expensive catalytic converter take the incomplete combustion that occurs in the internal combustion engine which produces carbon monoxide and completes the reaction to produce carbon dioxide Hilarious – Ha ha ha ha ha ha ha!
Firstly, emissions haven’t stopped rising. Annual fluctuations aren’t trends.


Secondly, there has never been a correlation between the year-over-year δ emissions (mmt CO2) and δ MLO CO2 (ppm).
Thirdly, CO2 emissions have increased about 7 times as fast as the atmospheric concentration…
CO2 emissions from BP Statistical Review of World Energy June 2017.
MLO CO2 from Wood for Trees.
June temperatures are below average for many parts of the world.

Ignore the above. That was in June 2014
What I find interesting are the illustrations that these kinds of stories use to further their drama. This “scorcher” story, for example uses a photo with the caption: A monorail moving through a smoky haze, which blew over from Indonesia, in the Singapore port in September, 2015.
“Smoky haze”, of course, makes a false comparison between invisible CO2 and visible smog, in the typical sensationalizing tactic of conflating two separate issues This is a more subtle form of journalistic misrepresentation — lying by false association.
Where is the nuclear power-plant blowing out steam from its huge stack?! This is a more powerful, effective visual lie. For the lying phrase “Earth-Scorching CO2”, the nuclear power plant would have been much more fitting.
The graphs of the Times article DO, however, drive home an important point — namely, that, since around 1982, for every 16,667 molecules of air, ONE more molecule of CO2 has been added to the atmosphere [check my math]. This is most disturbing. We’re gonna fry !
Now let’s see a story about “Earth-drowning water”, accompanied by a photo of a single living cell exploding from being placed in a bath of distilled water.
Drowning is a leading cause of death around the world, you know.
OR
… a story about “Earth-corroding oxygen:, accompanied by a photo of a sunken old battle ship, raised to the surface and left sitting for ten years.
Death by free radical damage (i.e., aging) is running rampant. Something must be done !
The “earth-scorching CO2” is from the exhaled breath of dragons, who have been doing this covertly for thousands of years, and are the REAL culprits behind any alleged climate change. I will be doing a paper on this as soon as my grant money comes through.
Outgassing.
Well, not really. I would rather talk about less “ingassing”. Oceans absorbing CO2 at a slower rate because of being hotter. At current atmospheric CO2 concentrations, oceans are a net sink (the so-called acidification and all that)
Wouldn’t greater outgassing occur at the same time that less ingassing occurred? — not an “either/or” but a “both/and” ?
Robert,
Yes, but still the total effect is more ingassing than outgassing… Thus the oceans still are more sink than source.
Way to go, Ferdinand, you’ve just killed another carbon thread. (here comes that ol’ nutter ferdi and his mass balance argument again) The only reply you’ve gotten thus far was a facetious one from Forrest. Whatever Nietzsche power trip you’re on, GET OFF IT! You might try engaging people in discussion instead of talking down to them…
Fonzie,
If I see nonsense from fellow skeptics that undermines the whole skeptic case, I will react until I drop dead…
The oceans are a net sink for CO2, take it or leave it:
https://www.pmel.noaa.gov/pubs/outstand/feel2331/maps.shtml
I am still waiting about how the oceans can be a net source, not based on fantasies like CO2 piling up in the sinking waters…
So I exhale scorching hot air? Who would have though it!
Oh, sorry, I have not answered the question posed:
“If the amount of the gas [CO2] that people are putting out has stopped rising, how can the amount that stays in the air be going up faster than ever?”
Ocean outgassing, as suggested by someone else above, seems like a pretty good answer to me. At least, this would seem to be part of the answer.
For the other part of the answer, I might pose a somewhat radical idea: death of the climate-change alarm paradigm. As alarm dies, awareness of reality sets in, opening eyes to what has been there all along.
And for the ocean outgassing, The Guardian, better known for its rabid support of AGW, had this article yesterday of a study proving the ocean is heating rapidly, probably thinking it supports CO2 causing warming instead of the opposite.
https://www.theguardian.com/environment/climate-consensus-97-per-cent/2017/jun/26/new-study-confirms-the-oceans-are-warming-rapidly
Extra! Extra! Read all about it! World-reknowned newspaper, the New York Times printed on tree-and-planet-destroying paper!
Don’t forget the planet-destroying electronics that allow for the online edition of the “paper”. … or the planet-destroying energy sources that power these planet-destroying electronics.
There’s a Society of Professional Journalists with a code of ethics? You’re kidding, right?
Sheri ==> Apparently as unknown at the NY Times as it is to you. Seriously, the SPJ is the “AGU” of journalists — over a hundred years old. No idea of actual membership today. They publish the Code of Ethics and explanatory pages for each point, which I used in this and previous essays.
Well, there is a scorched earth policy against fact checkers of climate alarmism and science process in general. That much is right.
The literal fact is, ……. neither the average bi-yearly or the average yearly increase in atmospheric CO2 ppm quantities as defined on the Keeling Curve Graph or recorded in NOAA’s Mauna Loa CO2 Record can be associated or correlated with the “fuzzy math” calculated yearly CO2 emission quantities that are being attributed to human (anthropogenic) emission activities.
Human CO2 emissions are so puny (small) that they have no effect whatsoever on the factually accurate, scientifically measured, atmospheric CO2 ppm quantities.
I just realized another possible tactic to confuse the discussion: Now alarmists can confuse the meaning of “CO2 emissions”.
I always thought of “emissions” as HUMAN emissions, but now I see claims that “emissions” have not leveled off or are not on the decline, which the confusion I just mentioned might explain.
Great ! — people demonized CO2 by confining it to human-produced sources and calling it “emissions”, so that they could categorize it as a “pollutant”. Now they just toss aside the human part and keep the “emissions” part to apply to ALL CO2 emissions, … still relying on the term, “emissions”, to evoke the idea of “pollution”, … meaning that something else must now be “polluting” Earth’s atmosphere with more CO2 “emissions”. … The Earth must be “polluting” itself.
Sigma Xi puts out what they call a Smart Brief which contain references to interesting articles such as this one that just came. Some links are for papers in real science journals.
https://www.newscientist.com/article/2138655-birds-use-cigarette-butts-for-chemical-warfare-against-ticks/
Along with it came the New York Times article open to members. Besides the graph the Times had a picture of haze in Singapore. Unfortunately Sigma Xi officers thought the March for Science was a great idea. Homework?
Forrest,
Sorry, no, as long as the sinks don’t match the current human emissions, some part of it (as mass, not the original molecules) will remain in the atmosphere…
Currently, about half human emissions remain in the atmosphere as “airborne” fraction, but that varies from year to year with temperature.
The New York Times coverage of climate is driven by the political biases and objectives of the Publisher and Editors. The reporters were hired to sing the songs they have been given. Justin Gillis, Coral Davenport, Andy Revkin and a slew of like minded progressive alarmists have clearly never seen the SPJ code of ethics or they ignore them in order to curry favor with their bosses and elitist peers.
There is plenty of precedent for political bias driving NYTimes coverage of important topics. See:
http://www.nytimes.com/2001/11/14/news/150th-anniversary-1851-2001-turning-away-from-the-holocaust.html
or this:
http://www.thedailybeast.com/reporting-on-the-times-calls-out-new-york-times-holocaust-coverage
Mark ==> Andy Revkin is at ProPublica now, writing one or two pieces a month.
Gillis and Davenport are even worse. The NYTimes has had front page climate alarm articles just about every week recently. They seem to be on a mission.
This is from the ProPublica bio on Revkin:
“Revkin is among those credited with developing the idea that humans, through growing impacts on Earth’s climate and other critical systems, had created a “geological age of our own making,” known increasingly as the Anthropocene. ”
He is bought into the meme that people are really bad for the planet………..ugh!
Growing up in Brooklyn in the ’50s and 60’s, I was taught that the Times was the epitome of journalism to be read by all informed people. Well now it has become just another progressive mouth piece with minimal objectivity. We keep a subscription to the Sunday paper because my wife still likes the book section and some of the magazine and I like to give the crossword a go. I wait until my blood pressure meds have kicked in to look at it online daily. My liberal friends still take it as gospel.
Thanks, have been reading newspapers (no NYT) some since before Pearl Harbor and have been meaning to look into this. The little I recall was more local concerns. Our elders tried not to burden our childhood, but we knew and sensed a lot partly from being near an airbase. Others were being bombed, etc. I guess comparable youth now feel that way and don’t know they are supposed to think that they are indestructable. They could be a shrimp and have a lottery odds to survive. There are better comparisons.
There is a NYT anniversary book of front pages.
my question would be, “Just where is the Earth being ‘scorched’?”
Only in the Climate Models?
“Sharp Rise in Levels of Earth-Scorching Carbon Dioxide”
When someone declares that a 100+- increase in atmospheric CO2 ppm results in an “ Earth-Scorching ” …… then anytime that the atmospheric H2O vapor (humidity) increases 15,000 to 20,000 ppm the results will surely be “ Earth-Boiling” each and every time it happens.
And just how does CO2 “scorch” anything?
(It’s used in fire extinguishers, for crying out loud!)
“Freeze burn” maybe? 😎
I have yet to see a study that shows how much CO2 is released by burning a gallon of gas. CO2 has risen and fallen over the millennia. Why? What made it rise before? What percent of the current rise is natural and part of it is brought on by man?
“how much CO2 is released by burning a gallon of gas. ”
…
https://www.fueleconomy.gov/feg/contentIncludes/co2_inc.htm
Healthy for the earth. Thanks
Do you know what really burns my butt?
Earth scorching CO2, just about hip high……
I saw Earth Scorching CO2 open for Iron Maiden in ’87.