The whole concept of the ‘Little Ice Age’ is ‘misleading’, as the changes were small-scale, seasonal and insignificant compared with present-day global warming, a group of solar and climate scientists argue.
Explanations for the cooling to Earth’s climate, thought to have occurred between the 16th and 19th centuries, include low solar activity, volcanic eruptions, human changes to land use and natural climatological change.
But in a new paper in Astronomy & Geophysics, the house journal of the Royal Astronomical Society, Professor Mike Lockwood, of the University of Reading, and his collaborators, note that the temperature shift was smaller than that seen in recent decades resulting from the emission of greenhouse gases, and that although low solar activity may have been one driving factor, it certainly was not the only one.
Professor Lockwood said: “Commentators frequently refer to the Little Ice Age in discussions on climate change. We wanted to carry out a comprehensive study to see just how reliable the evidence is for a cooler climate, how big an impact it really had and how strong the evidence for a solar cause really was.
“On the whole the Little Ice Age was a manageable downturn in climate concentrated in particular regions, even though places like the UK had a larger fraction of cold winters. Our research suggests that there is no single explanation for this, that warm summers continued much as they do today and that not all winters were cold.”
Researchers scrutinised historical records, such as the accounts of ‘frost fairs’ when the River Thames froze solid, and looked at the paintings from the era, such as the landscapes of Pieter Bruegel the Elder, with ‘Hunters in the Snow’ depicting a cold winter scene. Both of these are cited in support of the Little Ice Age concept.
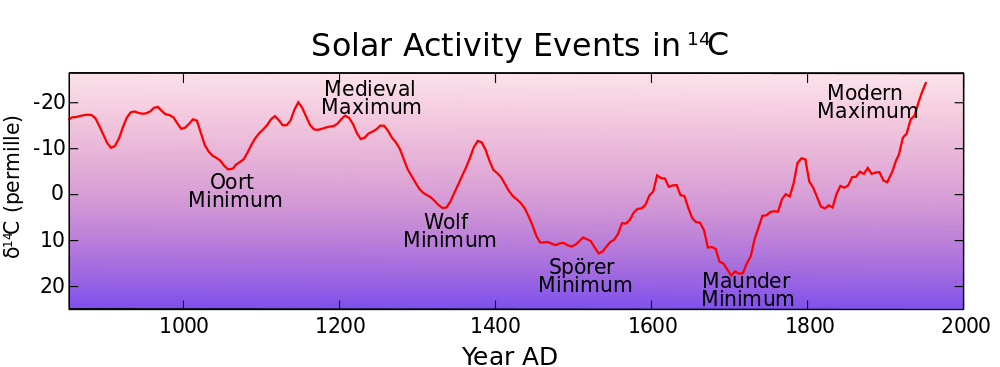
From around 1650-1710, and to a lesser extent from 1790-1825, periods respectively known as the Maunder and Dalton Minima, sunspot numbers were unusually low, an indication that the surface of the Sun was slightly cooler. This external influence is often suggested as an explanation for the colder conditions.

Part (b) shows the lowest monthly average in each winter whereas part (c) shows the hottest monthly average in each summer. In both cases blue shows lower temperatures, and red shows higher temperatures than the long-term average.
The cold winter months match up very well with the years in which frost fairs were held (vertical mauve lines) or years when the Thames was reported as frozen solid (vertical orange lines). However these years are not usually also associated with colder summers, unless there was a large volcanic eruption (measured from the sulphates that it deposited in polar ice sheets) such as Tambora in 1815.
The top panel (a) shows the level of solar activity as seen in sunspot numbers (from telescopic observations and deduced from Carbon-14 stored in tree rings). It can be seen that, contrary to common claims, the Thames did not freeze more often during the Maunder minimum (c.1660-1710). Thames freezing events ceased after the demolition of the old London bridge in 1825 and the installation of the embankments, completed in 1870 (both dates marked with black lines): the faster flow meant that the river no longer froze, even when temperatures fell to values that had previously caused freezing. CREDIT M. Lockwood
The Reading-led team looked at the various pieces of evidence in more detail. They compared direct temperature records and proxy data such as ice records, with the years when the Thames was frozen over (whether or not a frost fair took place), and with the indications of solar activity.
Historical climate change is assessed through a variety of means. The Central England Temperature (CET) dataset tracks temperature from 1659, making it the oldest and longest running meteorological instrumental data sequence in the world. This direct record is supplemented by studies of biological proxies such as tree rings, corals, insect numbers and molluscs, all sensitive to climate change.
The authors draw comparisons with the ice ages proper. Cores taken from Antarctic ice allow global temperatures to be inferred, by measuring the proportions of deuterium (2H), a heavier atom of hydrogen, and of the heavier oxygen atom 18O, compared with their lighter ‘normal’ counterparts. It takes more energy to evaporate water with a higher proportion of these atoms, and they are more easily lost from rainfall, before they are deposited in ice found nearer the poles. The changing proportion of these atoms then allows researchers to assess how the temperature has changed over millions of years.
From these comparisons, the scientists argue that the description of the period as an Ice Age is misleading, as temperatures in that period fell far less than in a glaciation. During the Little Ice Age (LIA), the average temperature in the northern hemisphere fell by around 0.5 degrees. In contrast, in the most recent major glaciation that came to an end around 12,000 years ago, global temperatures were typically 8 degrees Celsius colder than today.
Frost fairs also seem to be a poor indication of overall climate, as they often did not take place despite the Thames freezing, partly for many reasons including puritanical authorities or safety as lives were lost when the ice melted. The ending of the frost fairs had nothing to do with climate change or solar activity, instead being due to the increased river flow when the original London Bridge was demolished in 1825, and the first Victoria embankment opened in 1870. Both of these prevented the river from freezing completely, despite many subsequent cold winters.
Selective use of art historical evidence appears to reinforce the illusion of a prolonged cold spell. Yet ‘Hunters in the Snow’, depicting a January scene, is part of a series by Bruegel known as ‘The Twelve Months’. Seven of these paintings may have been lost, but ‘The Gloomy Day’ (February), ‘Haymaking’ (July), and ‘The Return of the Herd’ (November) all give no indication of unusually cold conditions. Consistent with this, Lockwood and his team note that even at the height of the LIA period, colder European winters were still accompanied by many warm summers.

For example, 1701 is close to the lowest point of the Little Ice Age, yet in both Paris and London the summer was reported as being unbearably hot and the CET for July that year is the 10th hottest on record, with average temperatures for the month reaching 18.3°C. The year 1676 is the second hottest June on record at 18.0°C, yet it too was in the middle of a run of cold winters. Such high summer temperatures do not fit at all with the name “Little Ice Age”.
Much more dramatic variations can result from large volcanic eruptions. Samalas, a volcano which erupted in 1257 in what is now Indonesia, ejected large amounts of dust into the atmosphere, causing a temporary cooling effect. The years between 1570 and 1730, corresponding to the coldest part of the LIA, also saw continuous lower level volcanic activity that may have suppressed temperatures. Volcanic eruptions undoubtedly cause both cold winters and cold summers. One of the clearest examples was the Tambora eruption of July 1815, which caused the next year to be called “the year without a summer”.
Professor Lockwood said: “This study provides little solace for the future, as we face the challenge of global warming. Solar activity appears to be declining at present, but any cooling effect that results will be more than offset by the effect of rising carbon dioxide emissions, and provides us with no excuse for inaction.”
###
The paper: (paywalled)
When Sir Francis Drake visited the west coast of North America, he found that the natives were not wearing clothes to suitably protect them from the cold, presumably because they were not used to the colder weather.
What was happening with alpine glaciers during this time? That got left out.
Please see the link I posted to Paul’s article above.
Glaciers advanced globally. Alpine villages were threatened and parts of Switzerland had to be evacuated by climate refugees no longer able to farm the upper valleys. Some passes in the Alps are open only during warm periods. Those just emerging now were also open during the Medieval, Roman, Minoan and Egyptian Warm Periods and Holocene Optimum, as shown by, among other evidence, the presence of artifacts from those intervals but not the cold ones. Oetzi the Iceman is from the end of the Holocene Optimum.
Charrua and Guarani indians from South America used to wear heavy ‘overcoats-like’ dresses known as ‘palas’ or ‘ponchos’ at latitudes between 25° and 40° in the 16th and 17th centuries according to documents sent to the kings of Spain and Portugal. These documents mention very cold temperatures in Southeastern South America.
British winters are controlled by the competing claims of mild and wet southwesterly Atlantic storms, wild, stormy and potentially snowy northwesterly depressions competing against the influence of cold Siberian highs extending to Western Europe, with snow potentially coming either from the NE, the east or even the SE. Much can be deduced about the nature of the winter patterns depending on precipitation distribution, both solid and liquid.
Britain can have a very mild winter even if the Alps and Germany have an incredibly cold one, but it is unlikely to have a cold one if Germany is mild. For that to happen, you need Mediterranean air reaching Bavaria but arctic air streaming down to Britain……
Given the obvious differences between California and the UK (the winter patterns do not cosegregate), I would be very wary of extrapolating a highly local temperature record across the globe.
Perhaps proxies across the globe should also be evaluated in the period 1350-1750?
Proxies around the globe have been evaluated for that interval and for those before and after it.
They show that not only the LIA and MWP were world-wide phenomena, but that so were the warm and cool periods before them during the Holocene and previous interglacials.
The LIA can be largely explained by its frequent, deeper and longer-lasting solar minima compared to the warm periods which preceded and followed it. There were some big volcanic eruptions then, too, but not much more so, if at all, than during the Medieval and Current WPs.
Going without clothes in the temperate zones of the Precolumbian Americas was common. The people were hardy. Darwin encountered naked Fuegians during the colder than present 1830s of subantarctic Tierra del Fuego. Indians not only in California but Virginia were often naked, as was then eleven year-old Matoaka “Pocahontas” Powhatan when the English first met her in 1609, doing cartwheels (without benefit of having seen a cart). If nothing else, it upped vitamin production in the skin.
The LIA (1300-1850) was a period of weather extremes and a shifting of climate from the Medieval Warm Period to very cold winters and wet, cold springs. The years of the Great Famine, 1315 to 1319, were the wettest in some 50 years. Interspersed in these periods of extreme cold and wet were also periods of warmth and relatively benign weather. Unprecedented weather changes — where have we heard that before? During the LIA, glaciers advanced and destroyed whole villages.
Dr. Mann tells of of recent weather extremes but the extremes in the LIA would make anything today seem like child’s play. The population expanded during the favorable years of the MWP and crop failures in the LIA caused widespread starvation and subsequent disease. It was thought that “weather making” witches were responsible for the fiendish weather and general misery, and literally thousands were burned at the stake. See Brian Fagan, “The Little Ice Age” and the haunting paper by Behringer: https://drive.google.com/file/d/0B8k_TGrJSc67a1lIZ25WamhabXc/view?usp=sharing.
Why do teleconnections work for a larch in Yamal or bristlecones inn the White Mountains but not for the Thames freezing?
Coldest CET winter was in 1684 with average temperature below –1C, but two years later in 1686 the average winter temperature rose to above +6C see here. That is weather not climate change.
“Climate change is a large-scale, long-term shift in the planet’s weather patterns or average temperatures.”
You can read the whole article (open access) here:
http://www.climate-lab-book.ac.uk/files/2017/04/343_AandG_MMandLIA.pdf
And, another summary of the article here: http://www.climate-lab-book.ac.uk/2017/frost-fairs-and-the-little-ice-age/
Isn’t this like the Karl paper where they are explaining away something that they previously denied existed at all?
Lockwood says: On the whole the Little Ice Age was a manageable downturn in climate concentrated in particular regions…
The whole article has twisted the narrative by suggesting that the Little Ice Age started in 1650. In fact it started a lot earlier: Look at: Miller, Gifford H., et al. “Abrupt onset of the Little Ice Age triggered by volcanism and sustained by sea‐ice/ocean feedbacks.” Geophysical Research Letters 39.2 (2012).
They say: “Here we present precisely dated records of ice-cap growth from Arctic Canada and Iceland showing that LIA summer cold and ice growth began abruptly between 1275 and 1300 AD, followed by a substantial intensification 1430–1455 AD. Intervals of sudden ice growth coincide with two of the most volcanically perturbed half centuries of the past millennium.”
This coincides with other historical information: Such as the Great Famine, from Wiki: “The Great Famine of 1315–1317 (occasionally dated 1315–1322) was the first of a series of large-scale crises that struck Europe early in the fourteenth century. Most of Europe (extending east to Russia and south to Italy) was affected.[1] The famine caused millions of deaths over an extended number of years and marked a clear end to the period of growth and prosperity from the eleventh to the thirteenth centuries.”…and the Black Death: again wiki: “The Black Death was one of the most devastating pandemics in human history, resulting in the deaths of an estimated 75 to 200 million people in Eurasia and peaking in Europe in the years 1346–1353.”
Millions of deaths due to famine and 200 million dead due to plague – not what I’d call a manageable downturn in climate.
So, back to Lockwood’s new study: It should be entitled: “Frost fairs, sunspots and the period several hundred years after the Little Ice Age called the Maunder Minimum”.
Lockwood might start in the 1650s because of the CET, but of course the LIA began much earlier than that, regardless of precise date.
The onset of the LIA is debatable. There was extreme weather in parts of the 13th and 14th centuries, but the second half of the 1300s was warm. I’d suggest AD 1400 as a good start date, although some consider the Wolf Minimum to have occurred in the LIA rather than the MWP:
I consider 1257 as the start date of the LIA. I don’t think you can consider to be in the Medieval Warm Period after that, and there is no need to add more transition periods.
http://i.imgur.com/dLwwN4e.png
Tony can correct me, but IIRC the 14th century was as warm as the 13th in Manley’s reconstruction of CET for the centuries preceding its thermometer record beginning in the 17th century.
If however you do want to start the LIA in the mid-13th century, I’d base it on the Wolf Minimum rather than a volcanic eruption. The two might not be independent events, anyway.
Thanks for the glacial advance and retreat study you cited below, BTW.
The world was set up for the Black Death because population had grown so rapidly during the Medieval WP. War was also made easier by the increase in fodder for animals and food for fighters. War horses in particular needed lots of not just grass but grain.
But by my reckoning both the first outbreaks of plaque (1347 et seq) and most of the Hundred Years’ War (1337-1453) occurred during the Medieval WP. The Wars of the Roses, a dynastic conflict in England, did however happen during the early LIA. Weather and climate affected it. Towton, “probably the largest and bloodiest battle ever fought on English soil” (Gravett, 2003), was waged in a snowstorm on Palm Sunday, 29 March (Old Style) 1461.
Gloateus,
Interesting points. But when you say: “But by my reckoning both the first outbreaks of plaque (1347 et seq) and most of the Hundred Years’ War (1337-1453) occurred during the Medieval WP. ” Did you base that opinion on a specific piece of information or a general impression from a wide group of sources? Because the reference I cited above seemed pretty clear about when it started, and it fits with the known facts of geographically widely dispersed extreme famines (a whole series of them) and the black death, both of which seem highly likely to be associated with the stresses to people and animals caused by rapid cooling, and crop failure after many unusually warm years.
I base it mainly on the temperature record, whether instrumental or proxy.
If you want to go by famines, then the LIA should start in 1315.
https://en.wikipedia.org/wiki/Great_Famine_of_1315%E2%80%9317
In the 1250s-80s there was some bad weather, typically associated with volcanic eruptions. There was also the Wolf Minimum, c. 1280-1350. But the second half of the 14th century generally once again enjoyed MWP-style good weather. Conditions naturally varied on different continents and in the oceans.
So start and end dates of warm and cool intervals can be fairly arbitrary. And of course they contain decadal cycles counter to the centennial secular trends. Thus the MWP had some cooler intervals, the LIA some warmer cycles, as in the early 18th century coming out of the Maunder Minimum, and the Current WP some cool cycles, as in the 1940s-70s.
Gloateus
Do be aware that cricket – eminently a summer game – has, occasionally, been disrupted by snowfall. Certainly in May. And probably also in June, July and possibly August, IIRC. And (Pre-winter) September.
Snowstorm – very rarely . . . .
This is the British Isles.
Don’t like the weather? – well, hang on a couple of hours, and we can show you two more seasons . . . .
As for forty day forecasts – words fail me.
Auto
“the temperature shift was smaller than that seen in recent decades resulting from the emission of greenhouse gases”
Since the temperature shift in the last 2 decades is negligible, the portion allocatable to emission of greenhouse gasses must be sub-negligible. If the authors reason that greenhouse gas emissions are a problem, I have reason to doubt their ability to reason. If they can falsely attribute changes in late 20th century climate to the single explanation of CO2, I have reason to doubt their ability to claim anything was or was not caused by a single factor:
“Our research suggests that there is no single explanation for this, that warm summers continued much as they do today and that not all winters were cold.”
Crop failure during the LIA was due to cold summers, by the way.
Do they realize they just claimed summers today are no warmer than during the LIA? They are simultaneously arguing against the existence of the LIA and global warming.
SR
It is a tangled web they weave.
The big problem with lying all the time about everything, is keeping the story straight.
It cannot be done…not well enough to fool a careful listener.
Lockwood was on a mission: to straighten that hockey stick shaft, to make the blade look even scarier. Gravy trains don’t run by themselves. They need help from sciencestitutes.
The low solar radiation would have been noticed much more in the winter months (January) in the UK than in the summer months because solar radiation is at its lowest in January and would have been even lower than ,we are actually tilted towards the Sun in the summer at higher latitude . I read this nonsense and despair.
The low solar radiation would have been noticed much more in the winter months (January) in the UK than in the summer months because solar radiation is at its lowest in January
On the other hand we are closest to the Sun in January, so solar radiation over the globe is 7% higher than in Northern summer.
So the millions of people who died from cold and starvation did that unnecessarily? The beech forests that froze and disappeared from the landscape were overreacting. If somebody at the time had pointed out that the LIA was just an illusion, it would have saved a lot of heartache. Possibly the models in use at the time showed that world was warming so people attributed the dying forests to heat stroke. Speaking of which, we haven’t had such a cold miserable spring for a long time here in BC. Let me get this straight- warm summers negate the LiA, and cold springs are caused by CAGW? Turtles all the way down.
In their 2015 review, Olga Solomina and col. divided world glaciers in 17 regions, 13 of them in the Northern Hemisphere, 1 in low latitudes, and 3 in the Southern Hemisphere. the LIA saw glacier advances in 12 of those regions, including all from the Southern Hemisphere, the biggest number in the entire Holocene. Most glaciers that advanced during the LIA reached their record lengths for the entire Holocene.
http://i.imgur.com/NvESsyd.png
So yes, it was that cold. The coldest period in the entire Holocene. If glaciers are proof of global warming, they were proof of global cooling. You cannot have it any other way. That weather was more variable then than now is to be expected. We all know that global warming reduces the frequency of extreme weather events. Global cooling does the opposite obviously.
Solomina, Olga N., et al. “Holocene glacier fluctuations.” Quaternary Science Reviews 111 (2015): 9-34.
http://www.geo.umass.edu/climate/papers2/Solomina_QSR_2015.pdf
Since we are the way towards a new glaciation [in a few tens of thousands of years], colder periods will tend to become still colder, so no surprise there.
Ont the other hand, the number of glacier advances quoted is small [~5] and the statistics of small numbers must always be taken with a grain of salt.
“Ont the other hand, the number of glacier advances quoted is small”
You didn’t read properly. Solomina et al., represent glacier regions not individual glaciers. Most glacier regions have around 10 records (yellow points in figure 1 of the paper), and most records are composite from several glaciers (Supplemental information table 2). They have looked literally at hundreds of glaciers worldwide. It is the biggest meta-study on glaciers ever.
The glaciers within a region are not independent and so do not improve the statistics. It is like if you had 10 weather stations in Belgium and computed an average temperature. Now increase the number of stations to 100, 1000, 10000, 100000 1000000, etc. You still get the same mean but the statistical uncertainty does not decrease by a factor of 1000, because nearby stations are not independent.
If 12 of 13 are advancing or retreating that is meaningless because 12 is too small a number to use for statistical purposes?
Depends, on how many 12s there are. If only one, then not.
“The glaciers within a region are not independent and so do not improve the statistics.”
Again talking with authority about what you don’t know Leif. Glaciers within a region can be independent and as such are analyzed. Within the Alps region, Eastern Alps and Western Alps present quite different profile of advances and recessions that receive different names, like the Rotmoos advance in the Austrian Alps and the Piora advance in the Swiss Alps. And to top it, Solomina et al. regions are diverse. The Low Latitudes region comprises glaciers from tropical South America, Eastern Africa, and New Guinea. It would be quite hard to get a more complete analysis than what Solomina et al., 2015 have done. The paper is full of prominent authors from all over the world.
One might hope you are correct when you speculate that the current interglacial will turn out to be several times longer than the last bunch of them have been.
I would not bet the house on it…then again…at a span of several times longer than all of recorded history, we may only know it if you are wrong.
I would feel better if there was a more complete explanation of why the glacial advances and declines are as precipitous as they are, rather than gradual cycles like the Milankovich oscillations.
One might hope you are correct when you speculate that the current interglacial will turn out to be several times longer than the last bunch of them have been.
I didn’t say that. The slow decline of temperature into the depth of a glaciation generally takes on the order of 50,000 years. Now, there are people who believe that CO2 will save us from the next glaciation.
This is a small statistical sample according to Leif:
http://i.imgur.com/IUkHWAs.png
I shall ignore your usual misguided denigration and just remark that there is nothing wrong with the paper, only with your wide-eyed biased view of it. If there is variation within a region that just adds to the noise and decreases the significance.
“I shall ignore your usual misguided denigration”
You should not ask what you don’t give.
“If there is variation within a region that just adds to the noise and decreases the significance.”
There is nothing wrong with their statistics. When most glaciers from a region show advances then the region shows advances. When 12 out of 17 regions show advances, then most glaciers on the planet show advances. The number of glaciers considered in the study is staggering because they are doing a meta study. When you said “the number of glacier advances quoted is small [~5]” you were wrong, but you are unable to recognize it. They have to work with regions because a lot of the information they use has been published that way. Most glacier studies are individual or regional. They consider both.
Does not change the statistical facts. If in each regions the glaciers behaved the same way, they are only count for one. If they didn’t, the variation would just add noise and diminish the statistical significance. It doesn’t matter how many glaciers there were in each region. This is elementary.
“If in each regions the glaciers behaved the same way, they are only count for one.”
Data binning is a pretty standard procedure. There is nothing wrong with that study.
As I said: there is nothing wrong with the study. The fault is with you.
“The fault is with you.”
Yes I know. You have a problem with my «wide-eyed biased view of» the article, which happens to coincide with the view of the authors, many of them as prominent in their field as you are in yours, yet somehow you seem to think that your opinion carries more weight than theirs.
You only have to read the article to see how many of the glacier regions of the world experienced their maximum extent at the LIA. There is no other time in the Holocene that features that distinction.
And regarding forcing, they have this to say:
“Our results suggest that solar activity may have played a role in the large scale climatic transformations, at least in the second half of the Holocene.”
Ouch. Their «wide-eyed biased view of» their own work is also at fault according to you. How do they dare to provide evidence that solar variability affects climate so much as to move glaciers on a global scale? Luckily for us we have Dr. Svalgaard that will quickly and swiftly reject their evidence with a cute remark.
suggest and may
Are the usual weasel words showing that this is still an open question.
“this is still an open question.”
As most things in science. But it is a question on which they have taken an opposite side to you.
They suggest that maybe the sun had something to do with it, at least in the 2nd half of the Holocene. All reasonable caveats considering the low significance of small number statistics [all three in the Southern Hemisphere, wow]
“suggest and may
Are the usual weasel words showing that this is still an open question.”
The answer to this one is pretty easy:
https://judithcurry.com/2017/04/05/science-needs-reason-to-be-trusted/
Evidence supporting the view that LIA glacial advances were greater than during older Holocene cold periods is overwhelming and irrefutable. Various techniques can be employed (including written records) to date the furthest down-valley Holocene terminal moraines. [A terminal moraine, or end moraine forms at the snout of a glacier and marks the point of the glacier’s maximum advance. Any earlier Holocene terminal moraines will be destroyed as a later glacier advances over them]. Invariably the oldest Holocene terminal moraines from glaciers worldwide are of LIA dates – commonly mid 1700s). If older cold periods had caused glaciers to extend further down valleys than the LIA glaciers, their terminal moraines would still be present further down valley than the LIA terminal moraines. They are absent. The evidence stares you in the face in every glaciated region. The fact that even older Pleistocene terminal moraines survive in the valleys even further down valley removes the remote possibility that early Holocene moraines were present but have subsequently been destroyed.
That’s why the surprising position by a group of climatologists that the LIA was local and didn’t have much global effect is only a reflection of the sad situation of climatology, when authors that defend that position without presenting any evidence and ignoring all the available evidence against get to publish in scientific journals. The loud message is that climatology is no longer about evidence, and scientists, scientific societies, and journals have abandoned the scientific method in pursuit of activism. This is a sad time for science indeed.
the amount of solar radiation is still smaller because the day is shorter and room temperature drops to a low level with reduced solar radiation during January an observation.
That is true every year. The LIA was not special in that regard.
No mention of the bray or devries cycles in these comments…..Where is Javier to chart them.
At the LIA there was the coincidence of the lows of the Eddy (~1000 year) cycle, the Bray (~2400 year) cycle and the oceanic (~1500 year) cycle. Together with the progressive cooling of the Neoglacial period for the previous 4500 years and on top of that elevated volcanic activity, made the LIA unusually cold, even if it wasn’t cold all the time.
http://i.imgur.com/AXYL8f1.png
Several authors have demonstrated that the distribution of grand solar minima is not random, and that the probability of them occurring at the lows of the ~2400 year Bray cycle is significant.
https://wattsupwiththat.com/2016/11/24/the-bray-hallstatt-cycle/
For more on the Bray Cycle from Andy and Javier.
From when NASA still practiced the scientific method:
https://ntrs.nasa.gov/archive/nasa/casi.ntrs.nasa.gov/19910003157.pdf
this is a good site for historical weather across france from 1850
http://www.meteo-paris.com/chronique
Expectations of what low solar activity does to temperatures on short to long terms are part of the problem.
The solar influence on decadal scale temps is incremental, solar min to min.
The low solar conditions and cold and snow records of this winter go together like a hot sun and warm temps, and it was no different back during the LIA. Obviously we’ve seen records set in either direction – so is the climate really any different now than during the LIA except maybe a degree or two warmer?
It took many many successive high solar cycles to drive a net temperature increase, and the reverse is going to be true as well. It will require several low cycles to eat away at decades of high solar OHC buildup.
Can’t we agree the climate oscillates over long periods and therefore will always be ‘changing’?
“On the whole the Little Ice Age was a manageable downturn in climate … Our research suggests that there is no single explanation for this,…”
There you go, insert Global Warming for LIA and you have the same stiuation today, and a very manageable upturn.
Lockwood is a closet warmist. He will play down and pooh-pooh any evidence for the little ice age.
On another issue. If you enlarge the part of the Brueghel painting with the group of three people on the frozen pond, about one third up on the righthand side, you will notice that they play a game that looks like curling. This is two centuries before that game was played in Scotland and casts doubt on the claim by the Scots to have invented it.
Here in England the cold winters mixed with warm summers during the LIA. Suggests that there was a increase in blocking patterns during this time. Not only that but it also hints to where this blocking was happening during the year. During the winter months this blocking was largely forming somewhere to the north of England. Anywhere from the NW to the NE of England. So as to bring colder air down from the Arctic or across from the east. But during the summer this pattern changed. In the summer months this blocking was now forming to the south of England. Most likely coming up from the Azores and then settling over Britain or mainland europe. So allowing warm air to be drawn up from the south and so leading to these warm summers.
Question: If the AGW theory had never been put forth, would anyone one have questioned the nature of the LIA?
No, nor the MWP or previous cycles.
That is the crux of it Sheri…historical revisionism tailored to a propaganda-based narrative which is being foisted on us for political reasons.
Science got nothing to do with it.
Like Mae West’s diamonds…”goodness had nothing to do with it”.
https://youtu.be/u7ekAQ_Plxk?t=39s
So from these studied conclusions, If a supervolcano should suddenly explode, it would fix AGW (and global population numbers) all at once?
I’m confused. The authors claim that the LIA resulted in temperatures falling a mere 0.5 degrees is not big thing. Rep Beyer at the House Climate Science hearing mentioned the error between observed and modeled temperature was a mere 0.5 degrees, which Mann agreed was no big thing. Yet, a rise in temperature of 0.5 degrees is cause for alarm, and no amount of money is too much to spend to correct it. What am I missing?
The author seems to be claiming that the 0.5C cooling of the LIA is a non-event.
However the 1.0C warming since the bottom of the LIA is going to kill us.
I will point out that where I live in Western Canada, several crops which are exported worldwide require about a 90 day growing season and it is not unusual for crops to be lost to frost. I’m sure this applies to Russia and Ukraine as well and I believe frost is a risk in Argentina and to a slightly lesser degree in the Northern U.S. A shortening of the growing season by just a few days can be disasterous as a tremendous amount of the world’s food is grown in these areas. Colder years often mean later seeding and slower crop development as well.
Really need to look at the well documented (H.H. Lamb) enhanced atmospheric “blocking”
in the NH. From proxy data, this is coincident with the onset of a true Glacial Epoch.
Their graph seems to show a minor correlation between solar inactivity and larger eruptions. Has this anything to do with the solar activity/temperature relationship? Where these eruptions occurred would also change their impact on global climate, as well as the composition of the volcanic effluent and its plume height, rate of dissipation, etc.
A study conducted in 2008 by Jann-Yeng Liu, from the Center for Space and Remote Sensing Research in Chung-Li, Taiwan, found a connection between high energy charged particles in the ionosphere and earthquakes. The paper examined more than 100 earthquakes with magnitudes of 5.0 or larger in Taiwan over several decades. The results indicate that almost all of the quakes down to a 35 km depth were preceded by distinct electrical disturbances in the ionosphere.
I looked at the N. Atlantic area. Curve fitting shows something reminiscent of a ‘correlation’, but
don’t tell Dr. S.
http://www.vukcevic.talktalk.net/NAT-GSN.gif
Contrary to common opinion, the LIA didn’t have a higher frequency of large eruptions than has the Current Warm Period so far, although the latter of course is still much shorter in duration than the Little Ice Age Cool Period.
It did however have at least one VEI 7 event, which the modern warming hasn’t experienced yet. There were two if you start the LIA in AD 1257 instead of the early 15th century.
https://en.wikipedia.org/wiki/List_of_large_volcanic_eruptions
Current Warm Period (c. AD 1850 to present)
VEI 6
Krakatoa, 1883
Santa Maria, 1902
Novarupta, 1912
Pinatubo, 1991
Little Ice Age Cold Period (c. AD 1400 to 1850)
VEI 7
Tambora, 1815
VEI 6
Unknown, 1808/09
Grímsvötn, 1783-85
Long Island (New Guinea), 1660
Kolumbo, Santorini, 1650
Huaynaputina, 1600
Billy Mitchell, 1580
Bárðarbunga, 1477
Kuwae, 1452-53
Medieval Warm Period (c. AD 900 to 1400)
VEI 7
Baekdu, ~946
Samalas, 1257
VEI 6
Ceboruco, 930
Katla, 934-940
Quilotoa, 1280
There were also VEI 6 eruptions in AD 800, 710 (both in the Bismarck volcanic arc, like Long Island) and 700 (Alaska), should you consider the Dark Ages Cool Period to have ended earlier and the MWP to have begun sooner. The Rabaul caldera in the Bismarck arc also blew in 540, but that’s definitely in the DACP (also called the Migrations CP, due to the barbarian invasions by cold climate refugees).
If you transfer the 13th century eruptions from the MWP to a lengthened LIA, then the MWP features just one big eruption and two smaller ones. The record might not be as good as for more recent events, however.
The Current WP had four VEI 6 eruptions, while the LIA had nine VEI 6 & 7 eruptions. Adding the two 13th century eruptions gives the LIA rate eleven.
If you date the LIA from AD 1257 to 1850 and the Current Warm Period from 1851 to now, then the rates are one VEI6/7 per ~54 and 41.5 years. If the LIA lasted only from 1401 to 1850, then its rate was one per 50 years.
So the Current Warm Period so far has seen more frequent big eruptions per century than the LIA, but lacks a VEI 7.
There is but One!
–The Exorcist