From the Swiss National Science Foundation (SNSF)
Sun’s impact on climate change quantified for first time

For the first time, model calculations show a plausible way that fluctuations in solar activity could have a tangible impact on the climate. Studies funded by the Swiss National Science Foundation expect human-induced global warming to tail off slightly over the next few decades. A weaker sun could reduce temperatures by half a degree.
There is human-induced climate change, and there are natural climate fluctuations. One important factor in the unchanging rise and fall of the Earth’s temperature and its different cycles is the sun. As its activity varies, so does the intensity of the sunlight that reaches us. One of the key questions facing climate researchers is whether these fluctuations have any effect at all on the Earth’s climate. IPCC reports assume that recent solar activity is insignificant for climate change, and that the same will apply to activity in the near future.
Researchers from the Physical Meteorological Observatory Davos (PMOD), the Swiss Federal Institute of Aquatic Science and Technology (EAWAG), ETH Zurich and the University of Bern are now qualifying this assumption. Their elaborate model calculations are supplying a robust estimate of the contribution that the sun is expected to make to temperature change in the next 100 years. For the first time, a significant effect is apparent. They expect the Earth’s temperature to fall by half a degree when solar activity reaches its next minimum.
According to project head Werner Schmutz, who is also Director of PMOD, this reduction in temperature is significant, even though it will do little to compensate for human-induced climate change. “We could win valuable time if solar activity declines and slows the pace of global warming a little. That might help us to deal with the consequences of climate change.” But this will be no more than borrowed time, warns Schmutz, since the next minimum will inevitably be followed by a maximum.
Strong fluctuations could explain past climate
At the end of March, the researchers working on the project will meet in Davos for a conference to discuss the final results. The project brought together various research institutions’ capabilities in terms of climate effect modelling. PMOD calculated what is known as “radiative forcing” taking account of particle as well as electromagnetic radiation, ETH Zurich worked out its further effects in the Earth’s atmosphere and the University of Bern investigated the interactions between the atmosphere and oceans.
The Swiss researchers assumed a greater fluctuation in the radiation striking the Earth than previous models had done. Schmutz is convinced that “this is the only way that we can understand the natural fluctuations in our climate over the last few millennia.” He says that other hypotheses, such as the effect of major volcanic eruptions, are less conclusive.
Exactly how the sun will behave over the next few years remains a matter of speculation, however, since appropriate data series have only been available for a few decades and they reveal no evidence of fluctuations during this time. “To that extent, our latest results are still a hypothesis,” says Schmutz, “and it remains difficult for solar physicists to predict the next cycle.” But since we have been observing a consistently strong phase since 1950, it is highly likely that we will experience another low point in 50 to 100 years’ time. It could be every bit as intense as the Maunder Minimum, which brought particularly cold weather during the 17th century.
Important historical data
The research project also placed great importance on the historical perspective. The Oeschger Centre for Climate Change Research at the University of Bern compared data series on past solar activity with other specific climatic conditions. People have been recording the number of sunspots, which correlates well with solar activity levels, for some three centuries now. However, it is much more difficult to quantify exactly how cold it was on Earth back then. “We know that the winters during the last minimum were very cold, at least in northern Europe,” says Schmutz. The researchers still have a fair amount of work to do before they have a detailed understanding of the relationship between solar activity and the global climate both in the past and in the future.
h/t to The GWPF
It sounds to me like adding a tiny amount of man made global warming from GHG’s and human land change use to get us through a cooling trend is a bit of an insurance policy on successfully transitioning a natural cooling trend. Can you imagine the chaos the planet would be in now if we were in a full blown Maunder type minimum. With 7.4 billion people now, there would probably be mass starvation from such a cooling and especially chaotic if you throw in a few large vulcanism events at the peak of a cooler, stormier planet.
We have probably done as well as we have as a dominant species because of a natural warming cycle added to by a small amount of human forcing of maybe a 1/3 degree C. To make such a fuss over some warming that is probably much better for us than a cooler world is perhaps the height of folly. Having said that, this has been a very good reason to study the weather/climate systems and all things terrestrial and extraterrestrial that influence long term cyclical earthly climate. Our grandchildren will thank us for trying to understand this most complex dynamic process.
“Can you imagine the chaos the planet would be in now if we were in a full blown Maunder type minimum. With 7.4 billion people now, there would probably be mass starvation from such a cooling and especially chaotic if you throw in a few large vulcanism events at the peak of a cooler, stormier planet. ”
Perhaps just nature’s way of causing natural selection. Those that cannot adapt perish. And it doesn’t matter if the adaptation is natural or technical, adapt or be gone.
Maunder Minimum cold may have been exaggerated by some of the solar enthusiasts. CET (at latitude 51.5 to 53.5N) the only realistic temperature record available from the MM period, shows that it was cold but not exceptionally
http://www.vukcevic.talktalk.net/CET-latest.gif
Down there you’ll be OK, plenty of protein in the Florida swamps, btw. with a bit of cooling it would be easier to catch.
@ur momisugly Vuckevic…the CET is moderated by the influences of the Atlantic just as the West Coast of the US has a Pacific Ocean moderation. It is points inland that will suffer the most from deeper cooling trends.
It is disturbing that so many supposedly skilled people appear to be oblivious to the error of not taking the time-integral of a forcing anomaly (with appropriate scale factor) for comparing to temperature change.
The integral introduces two free parameters: the width of the interval and the constant to subtract from the values. By selecting those carefully, you can fit almost anything, so the ‘time-integral’ enthusiast becomes just another curve-fitter. No physics.
LS – You should know better. Did you forget that the time integral of power is energy?
Sure, the time-integral of solar irradiance [power] over one day is the energy received for that day, of which on average all is lost again by radiation.
And Dan, you once said:
“The discoveries that the time-integral of sunspot counts correlates with the energy increase of the planet”.
The ‘energy increase’ is a change over time, thus a power. Have you forgotten that?
lsvalgaard
“on average all is lost again by radiation.”
Almost all.
ALL. Otherwise the Earth would heat up indefinitely…
True if you take it over a long enough time period. I was thinking over shorter periods – decades.
The ‘time-integral-enthusiasts’ integrate over much longer periods…
LS – Don’t confuse energy increase, measured in Jules, with energy increase rate in Jules/sec, i.e. Watts, i.e. power. Energy increase is irrespective of how long it took. Power magnitude can vary, integrate it over time and you get watt seconds i.e.Joules.
Are you aware that the ‘top down’ analysis with Equation (1) in http://globalclimatedrivers2.blogspot.com calibrated to measurements through 1990 (that makes it about 26 years ago) matches the current average global temperature within less than 1 s.d.? Climate Scientists with their “epic fail” ‘bottom up’ analysis would be ecstatic with that kind of accuracy.
Temperatures calculated using Equation (1) match measured average global temperatures 98% 1895-2015.
The projections from now through 2037 assume the ongoing water vapor uptrend to continue. The numbers through February 2017 are on track.
Temperatures calculated using Equation (1) match measured average global temperatures 98% 1895-2015.
Considering that we don’t know the temperature with that accuracy any attempt claiming that we can fit our model to such an accuracy is suspect, and is only an exercise in curve fitting. Given enough free parameters one can fit anything. von Neumann: “with four parameters I can fit an elephant, and with five I can make him wiggle his trunk”. Sorry, I ain’t buying, because you are not convincing.
Did you ‘buy’ von Neumann?
Apparently a 98% match for at least 120 years and predicting 26 years within one s.d. doesn’t do it for you. Kind of makes me wonder what would.
Instead of 98% curve fitting, but with no physical understanding, I would accept 80% if based on a physical mechanism without ad-hoc assumptions.
Don’t confuse energy increase, measured in Jules, with energy increase rate in Jules/sec
Which is precisely what you are doing as an increase is over a certain time step, i.e. a number of Joule/sec=power.
I am not confused.
Sufferers of the D-K syndrome never are.
People with Dunning Kruger sometimes project it upon others.
Do you have a reference to the scientific literature to that? or are you just projecting?
I indicated no one in particular so could not have been projecting but it is said that if one throws a stone at a pack of wolves the one that howls is the one that’s hit.
Who is howling now?
Do you have any actual evidence for your specific claim about the D-K projections.
References
Projection is applicable to any human fault:
^ Sigmund Freud, Case Histories II (PFL 9) p. 132^ Wade, Tavris “Psychology” Sixth Edition Prentice Hall 2000 ISBN 0-321-04931-4^ Harvey, Van A. (1997). Feuerbach and the interpretation of religion. Cambridge University Press. p. 4.ISBN 0521470498.^ Cotrupi, Caterina Nella (2000). Northrop Frye and the poetics of process. University of Toronto Press, Scholarly Publishing Division. p. 21. ISBN 080208141X.^ Harvey, Van A. (1997). Feuerbach and the interpretation of religion. University of cambridge. p. 4. ISBN 0521586305.^ Mackey, James patrick (2000). The Critique of Theological Reason. Cambridge University press. pp. 41–42.ISBN 0521169232.^ Nelson, John K. (1990). “A Field Statement on the Anthropology of Religion”. ejournalofpoliticalscience.^ Babylonian Talmud. pp. Baba Metsiya 59b; Kiddushin 70a. And he who [continually] declares [others] unfit is [himself] unfit and never speaks in praise [of people]. And Samuel said: All who defame others, with their own blemish they stigmatize [these others].^ Jean-Michel Quinodoz, Reading Freud (London 2005) p. 24^ Case Studies II p. 210^ Otto Fenichel, The Psychoanalytic Theory of Neurosis (London 1946) p. 146^ Sigmund Freud, On Psychopathology (PFL 10) p. 200–1^ Patrick Casement, Further Learning from the Patient (1997) p. 177^ Otto F. Kernberg, Borderline Conditions and Pathological Narcissism (London 1990) p. 56^ Hanna Segal, Klein (1979) p. 118^ R. Wollheim, On the Emotions (1999) p. 217–8^ Erik Erikson, Childhood and Society (1973) p. 241^ Peter Gay, Freud: A Life for Our Time, page 281n^ Glen O. Gabbard, Long-Term Psychodynamic Psychotherapy (London 2010) p. 33^ a b c Carl G. Jung ed., Man and his Symbols (London 1978) p. 181–2^ Franz, Marie-Louise von (September 1972). Patterns of Creativity Mirrored in Creation Myths (Seminar series). Spring Publications. ISBN 978-0-88214-106-0. found in: Gray, Richard M. (1996). Archetypal explorations: an integrative approach to human behavior. Routledge. p. 201. ISBN 978-0-415-12117-0.^ Demos, John (1970). “Underlying Themes in the Witchcraft of Seventeenth-Century New England”. American Historical Review. 75 (5): 1311–1326 [p. 1322]. JSTOR 1844480.^ The Pursuit of Health, June Bingham & Norman Tamarkin, M.D., Walker Press^ Sigmund Freud, On Psychopathology (Middlesex 1987) p. 198^ Paul Gilbert, Overcoming Depression (1999) p. 185–6^ Patrick Casement, Further Learning from the Patient (1990) p. 142^ Patrick Casement, Further Learning from the Patient (1990) p. 122^ General Aspects of Dream Psychology, CW 8, par. 519^ Ann Casement, Carl Gustav Jung (2001) p. 87^ F. S. Anderson ed., Bodies in Treatment (2007) p. 160^ Semeonoff, B. (1987). “Projective Techniques”. In Gregory, Richard. The Oxford Companion to the Mind. New York: Oxford University Press. p. 646. ISBN 0-19-866124-X.^ Trauma and Projection (subscription required)^ R. Appignanesi ed., Introducing Melanie Klein (Cambridge 2006) p. 115 and p. 126^ Mario Jacoby, The Analytic Encounter (1984) p. 10 and p. 108^ Baumeister, Roy F.; Dale, Karen; Sommer, Kristin L. (1998). “Freudian Defense Mechanisms and Empirical Findings in Modern Social Psychology: Reaction Formation, Projection, Displacement, Undoing, Isolation, Sublimation, and Denial”.Journal of Personality. 66 (6): 1090–1092. doi:10.1111/1467-6494.00043.^ Newman, Leonard S.; Duff, Kimberley J.; Baumeister, Roy F. (1997). “A new look at defensive projection: Thought suppression, accessibility, and biased person perception”. Journal of Personality and Social Psychology. 72 (5): 980–1001.doi:10.1037/0022-3514.72.5.980.
You certainly display such a trait, but your claim was specifically about D-K sufferers. So show the specific evidence for that.
Who’s howling now and who’s projecting?
Your initial unfounded comment answers that succinctly.
You don’t buy my evidence on DK but buy the consensus view on dark matter with no real physical evidence. Send me a thimble full of dark matter and you will show that you are at least consistent.
You don’t buy my evidence on DK
You have shown no specific evidence on DK, only your projection.
but buy the consensus view on dark matter with no real physical evidence. Send me a thimble full of dark matter and you will show that you are at least consistent.
Do you need a thimble full of the planet Neptune to buy the consensus view that it exists?
I like Charts….. Brightness is dropping and Temp is Rising. We have no idea of what we are all discussing……Wink. someday, we MAY understand, IF an Asteroid does not take us all out beforehand. Interesting how more and MORE meteors are grazing between Earth and Moon and entering our Atmosphere……
Convincing evidence that the the Sun is not the cause? don’t you think.
What we are learning is….. Lower Sunspot Activity shows an increase in other Forms of radiant Energy….. Visible light is only one Energy indicator….. Gamma and X-ray carry far more energy than Visible….. Although…..A huge Photon burst which history has shown can also happen can remove all other bets from the Table….. Our Glacial and polar ice records have recorded very large Photon bursts.
Lower Sunspot Activity shows an increase in other Forms of radiant Energy
No, not at all. The rest of your comment is a mixture of wishful thinking and plain nonsense.
REALLY? A huge Photon bursts can Penetrate our Magnetic field and Atmosphere ending life on our Planet…..Glacial and Polar ice records show it has happened before You say Nonsense? Visible light is fairly weak compared to Gamma and Xray radiation. Recent observation by NASA has shown this Minimum sunspot episode is showing a larger than normal Gamma Ray level….. Again Nonsense?…… Visable light is a small fraction if the Sun’s radiation output…..Again More Nonsense????
REALLY?
Yes, REALLY.
And you show no specific evidence of dark matter only unexplained gravitational behavior for which there are several THEORIES of which dark matter is the one which is most popularly accepted at this time. Send me some to prove your commitment to observation based science.
You display severe ignorance about the matter [dark or otherwise].
Perhaps this can through some light on the matter:
http://www.leif.org/EOS/CosmicSoundWaves.pdf
“This is a marvelous moment in the investigation of the cosmos. An impressively diverse set of observations has led to a standard cosmological model that is robust in its crosschecks, deeply puzzling in its ingredients, and far-reaching in its implications for fundamental physics. The sound waves that rang through the early cosmos are a prominent aspect of that model. They were predicted 40 years ago, and now they provide one of our best cosmological tools. The simplicity of sound waves is a hallmark of freshman physics. That same physics, applied on the largest scales, is bringing our universe into ever-closer reach.”
Leif,
I need to break off now as I am committed to a higher intellectual pursuit for I have promsied to take three of my grandchildren to see a presentation of “Frog and Toad” and need to both physically and mentally prepare myself for this endeavor.
Warmest Regards,
Jim G1
PS
Some contradictions arise from acoustics. http://www.isciencetimes.com/articles/6651/20140109/universe-measured-perfect-accuracy-infinite-flat-eternal.htm. An infinite, eternal and flat universe kind of obviates a 13.7 billion year old bigbang. BTW, Name calling is very immature.
It would help if you took the trouble to actually read the link you come up with. E.g. this statement
“They’re basically caused by pressure ripples from when the universe was formed about 13.4 billion years ago, which cooled and froze.”
But, indeed, the generally accepted notion is that the Universe is flat and will endure into infinity. No dissent.
On name calling: I call’em as I see them.
If you read the link I gave you, eternal also rules out 13.4 billion years.
If you read the link I gave you, eternal also rules out 13.4 billion years.
No it doesn’t. Nowhere does it say that. I sometimes get [rightfully] annoyed with people who say things so blatantly false with a straight face. What they said was ” it’s likely the universe extends forever in space and will go on forever in time.” Go on forward in time since time itself came into being 13.8 billion years ago. Not that it has existed forever back in time, because our universe hasn’t.
Something happened 13.7 byears ago but quite possibly not the beginning of the universe as per the big bang theory, possibly a “local event”.
@ur momisugly Leif,
Just before the “big bang”, were we the center of the cosmos or just another bubble to be.
Serious question.
As the universe is and has always been infinite in extent there was and is no center for us to be at.
Can’t help myself Leif, could you please define “infinite”.
the sequence of natural numbers 1, 2, 3, 4, 5, … is infinitely long in the sense that no matter how far out you go there is always a number larger than the one you stopped on. Same with space: no matter how far you have traveled there is always more space ahead of you where you have not yet been.
We do not know if the universe is infinite. It is just that all the data we have so far indicate that it is. that there is no ‘largest number’.
A recent discussion about ‘eternal’
https://arxiv.org/pdf/hep-th/0702178.pdf
“Although inflation is generically eternal into the future, it is not eternal into the past”
Leif,
Back from the Frog and the Toad. Significant indications in quantum physics that there was no beginning. Infinite and eternal front and back. https://phys.org/news/2015-02-big-quantum-equation-universe.html. And if open everything will happen while if closed everything will happen again and again. You need to read more. Open your mind.
Open your mind.
Don’t open it so much that your brain falls out.
As Guth points out:
https://arxiv.org/pdf/hep-th/0702178.pdf
“Although inflation is generically eternal into the future, it is not eternal into the past”
From time to time people try to prove Einstein wrong. So far, nobody has succeeded.
You shouldn’t uncritically jump on any hyped up internet story you come across.
Everybody take a deep breath.
We’re just watching.
Waiting for the mistake.
You don’t have to wait long. These threads are full of fervently believed mistakes by the usual suspects and even the occasional drive-by shooter.
Einstein also said that God did not play dice but quantum physics has proven, in the laboratory, that He does.
So?
Current Precision Cosmology shows how it is possible for General Relativity and Quantum Mechanics to work together showing us a way to new physics:
http://www.leif.org/EOS/Dark-Universe-2017.pdf
PPS
You shouldn’t uncritically accept the most popular consensus theories as facts.
My acceptance is based on my ability as a physicists to evaluate the strong observational evidence.
What is your non-acceptance based on?
Your dark universe pdf download failed from the link you provided.
I accept much of the same information that you do as best theories but not as facts to the exclusion of other theories until they are falsified. The scientific method, you know?
The word ‘fact’ is slippery. We do not need to falsify all other theories to go with the one that has the most explanatory power at the moment. THAT is the ‘scientific method’.
An example: A theory posits that the world was created last Tuesday with all there is in it, including things that make it look old. This cannot be falsified. You would claim that the ‘scientific method’ says that we should not exclude that theory. I say we should. http://rationalwiki.org/wiki/Last_Thursdayism
Deplorable.
Don’t judge all those misguided souls too harshly. John 8:7
As long as the one you “go with” does not become so dogmatic as to exclude other new information and ideas. All of the advances in science have come from outside the box from people who were originally scorned for even considering their, at the time, outrageous ideas. Einstein is a good example.
Modern Cosmology is very much ‘out of the box’. It took almost a century of fighting dogma to get here.
We exclude ideas that don’t work.
The link now works. http://www.leif.org/EOS/Dark-Universe-2017.pdf
Theories that are not falsifiable are not science, kind of like co2 being the thermostat for our planet. Too many exogenous variables to determine its validity, at least at this time. Though that does not make them untrue. One should be very careful, however, about basing actions upon such theories. Which is the problem with the climate change dogma.
Theories that are not falsifiable are not science
That does not mean that theories that have not yet been falsified automatically qualify as science on par with theories for which there is solid an abundant evidence.
Abundant paleo evidence exists indicating no relationship, let alone cause and effect relationship between co2 and temperature.
Why switching to the straw man of CO2?
Why switching to a straw man argument of a straw man argument? This is a site where the key subject is climate so there is no straw man involved. You said go with the theory with most abundant evidence when I brought up climate and co2 dogma. Most abundant evidence on that subject is millions of years of paleo data, no relationship temp vs co2.
millions of years of paleo data, no relationship temp vs co2.
Contradicted by the evidence
http://www.euanmearns.com/wp-content/uploads/2014/11/vostok_temperature_co2.png
Stooping to cherry picking, Leif? http://www.biocab.org/carbon_dioxide_geological_timescale.html. Paleo data is millions of years of evidence of no relationship between temp and co2.
Over geologic time many other factors [e.g. shape and position of continents] influence climate so direct comparisons are impossible. I showed measurements from the last million years where the geology has not changed. And they show a clear relationship between CO2 and temperatures. I’ll show you again:
http://www.euanmearns.com/wp-content/uploads/2014/11/vostok_temperature_co2.png
Moderator,
My screen still shows my last comment in moderation. Been there a long time. Don’t wait too long as I believe Leif and I might be close to the same age in which case time is of the essence. At least I know it is for me!
Regards on the great job you do.
Actually you showed 450, 000 years, not 1, 000, 000 years. And you make my point, cherry picking your data. And my other point, too many exogenous variables to pin the thermostat on co2 as well. My guess, yes guess as that’s the best one can do given the situation, is the oceans are the most important part of our thermostat. They do cover 70% of the planet to average depth of 12, 100 ft and store and regurgitate energy in an unknown manner. Of course there is also albedo, wind, clouds and the small variation in solar energy along with tectonic plate movement, changes in ocean currents, etc, etc. But I would not make big decisions based upon this guess, like redistribution on wealth and resources. Nor should the co2 cultists make such decisions based upon unproven theories and models.
Actually you showed 450, 000 years, not 1, 000, 000 years. And you make my point, cherry picking your data.
I showed half of the data that are actually available [which was enough to show the very strong correlation between CO2 and temperatures]. And it was indeed picked for the time where we actually have good data, in contrast yo your graph which is conjectural at best.
Forgot orbital changes, eccentricity and precession, big ones in the mix.
You show a blink in earth’s history that fits your conjecture and ignore much longer term data that does not. As I said, cherry picking. And you ignore all of the exogenous variables I noted that make the co2 thermostat claim unlikely while, evidently, in support of that claim and decisions based upon it.
You show a blink in earth’s history that fits your conjecture and ignore much longer term data that does not. As I said, cherry picking.
I show the several hundred thousand years where we have actual measurements. Those are, indeed, cherry picked for the quality of their data. So, the data is not conjecture, but perhaps inconvenient truth for you.
And you buy the co2 thermostat theory?
No, but that does not remove the strong correlation between CO2 and Temperature which we have directly measured the last million year. To maintain that there is no correlation is folly, silly, dishonest, biased, and worse.
Never said there was no correlation over that short period of time said there was no correlation, and there is not, over the much longer period of time I showed you. To ignore that is silly, biased and all the other pejoratives of which you accuse me. Cherry picking data to support ones position. I am however encouraged that you do not support the co2 mantra.
Never said there was no correlation over that short period of time said there was no correlation,
So, now you agree that there is a VERY strong correlation and that it has been there for a million years.
This is what is important to the current debate.
all the other pejoratives of which you accuse me
With me, you have to earn pejoratives, which you have managed to do in full measure.
So, we can conclude that you agree and accept and acknowledge and consent and concur and concede that for the last million years where we have good data, CO2 and Temperature have been highly correlated. And that this is what is important for the current climate debate.
One can pick many time periods of varying length where there are both positive and negative correlations between the variables. I chose the most all encompasing, which you do not agree with. So, “Peace be with you!” John 20:21
The only one of interest for us and the current climate debate is the current record [extending almost a million years in the past].
I take it that you now agree that there has been a VERY strong correlation between CO2 and Temperatures for the last million years.
Of course there are also significant periods within the 450, 000 years where temperature leads co2, BTW. Also, remember that correlation does not mean causation, in any event. Plus there are those who like you who question my use of longer term geological data, question the validity of ice core data based upon age and pressure issues. I will continue to go with no correlation over the long term, as I showed you. You can pick whatever shorter term period that makes you comfortable and fits your view.
I will continue to go with no correlation over the long term
This is called denial of the modern record.
And even the long-term record over the last 500 million years shows the correlation:
http://s4.postimg.org/5nwu2ppdp/Temp_CO2_750_Mya.png
It is called denial when one will not look at all the data but picks that which fits his opinion or that of the consensus.
As I showed there is correlation the last 400-500 million years and also the last 65 million years: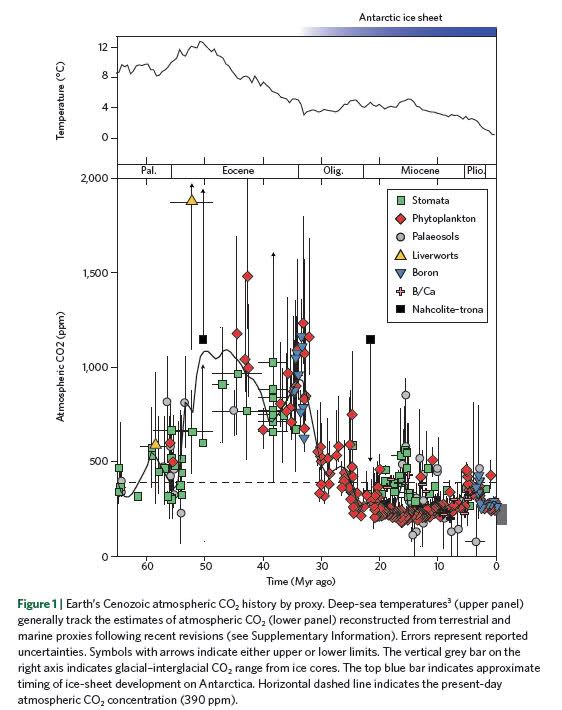
Before 500 million years ago CO2 concentration was generally high as were temperatures.
So now, who is in denial now that there over ‘the long-term’ has been a correlation beween CO2 and T?
But, again, all that is irrelevant for the current climate debate as only recent data is needed for that.
Strangely, it is warmer here in the daytime than at night.
And that has nothing to do with solar fluctuation. It does point to the possibility of intrinsic factors being far more potent in how much radiation gets to Earth’s surface and more importantly, the poorly observed ability of the oceans to absorb and store it after it gets through a wickedly complex and in its own right highly variable atmosphere.
I just read an article stating Ultraviolet radiation does not pass the Stratosphere……???? How do Sunburns happen if that is the case??? Moon used to be made of Cheese….. Hmmmmm.
Mensoguk, I assume you meant that comment for someone else? I was commenting on the Earth’s rotation about its axis which does not speak to solar fluctuations.
I may be mistaken here but it looks like they used a page out of the AGW Model playbook, I believe from page 10: How to use input dials.
“The Swiss researchers assumed a greater fluctuation in the radiation striking the Earth than previous models had done.”
I want to know how much fluctuation was dialed in and does it match the current reconstruction. One of the weaknesses in previous radiation data was that the sunspot record was based on a hodgepodge of different ways to count sunspots. That data set has been corrected but none of the AGW models, to my knowledge, have been corrected for this issue. And get this: the old hodgepodge mix DID show greater fluctuation. So these researchers dialed in even more?
Hmmmmm. Here’s the thing about models. They provide a way to dial in a biased assumption that in today’s post normal Science, is considered to be fine and dandy. In other words, bias is good, observations are bad, and the way to legitimize that is to create climate models that come equipped with bias dials. Not a bad thing in and of itself, but not adequate for the purpose of accepting or rejecting major hypotheses about how climate parameters work, when inputs are set at artificial levels and many parameters are not fully or accurately observed or even known for the purposes of modeling.
LS – You say “Convincing evidence that the the Sun is not the cause? don’t you think.”
I see your comment as refusing to acknowledge the relation between power and energy
Rather simply take it as indicating that you do not have any convincing evidence of your ideas. I may not be alone in that if comments from others on your and other blogs are any guide.
LS – There is always the NIH bias. Perhaps there is some consolation in that you are not the only person who has trouble with the relation of power and energy. It might be more obvious among people like myself who went beyond basic physics to the application of it in Mechanical Engineering.
person who has trouble with the relation of power and energy.
It has nothing to do with your confusion about this.What you do is not physics, not engineering, but crude curve-fitting. You introduce several free parameters: width of integral window, amount to subtract, phase and amplitude of a stationary ‘ocean oscillation’. With those you can fit anything with no basis in actual reality and no predictive power. I don’t have the inclination to wade through your stuff again, so be so kind to remind me:
1) what is the width of the integral window? and why is that a good choice?
2) when do you start the integrate?
3) what is the value you subtract from each value? and what is the physics or engineering basis for that value?
4) how do you construct the ocean ‘saw tooth’ curve? and why that particular one?
LS – Those 4 and other things are all identified and discussed in the blog which you can access by clicking my name.
1) I am unfamiliar with “integration window”. The step interval is 1 year because that is the available data. The integration interval is either 1895-2015 (= the range of acceptably accurate temperature data) or 1610-2015 (= available SSN) depending on objective.
2) See 1)
3) Savg is subtracted from each sunspot number. The value which works with this emergent analysis and your V2 SSN is 60.
4) The 64 year period saw-tooth was first arrived at from looking at the up-trends and downtrends in the reported average global temperature traces (like Fig 9) and the PDO integral trace (Fig 5). Later corroborated by AMO trace (Fig 6). The saw-tooth is unbiased and computationally simple.
The factors are combined in a rational logical equation (Eqn 1) with influence coefficients determined which give the best match to measurements. This is how emergent systems analysis is done. It is a top down analysis. It is a look at the over-all action of the system. It identifies the significant drivers of climate and I expect it to be reasonably close to measurements for at least a decade or two. The prediction from 1990 to now did well.
To be valid beyond that requires a means to predict the ocean cycles. People who have studied them in the past as far back as 1000 years (Mantua, et al, Minobe, MacDonald & Case) have reported variation in magnitude and period. I don’t know of any prediction at all, let alone the hundreds of years you are interested in.
Sunspot prediction. I have read of some who claim correlation with planetary synodic periods but that is your bailiwick.
As to water vapor, I suspect the ongoing increase might be connected to the increasing irrigation; the increase is about 3 times what is expected from temperature increase alone. IMO there is some planet climate interaction which is making the effective feedback more than indicated by the vapor pressure curve. I suspect the effective gain is closer to one than the vapor pressure/temperature curve indicates and might help explain what causes el Ninos.
1) I am unfamiliar with “integration window”. The step interval is 1 year because that is the available data. The integration interval is either 1895-2015 (= the range of acceptably accurate temperature data) or 1610-2015 (= available SSN) depending on objective.
2) See 1)
An [definite] integral is taken between two limits https://en.wikipedia.org/wiki/Integral the two limits defining a ‘window’ of a certain width W.
In your case W should be determined by the time of the memory the system ha: how long ago is there still a lingering effect. Imagine we had a million years of sunspot observations. It would hardly make sense to make W a million years long, so we have to choose a window that reflects how long the heat ‘stays’ in the system. Just starting at an arbitrary year, e.g. 1895 or 1610 does not make sense as the atmosphere does not know what our ‘objective’ is. So, to make sense, W should have a [fixed] value given by the properties of the climate system. What is that value?
3) Savg is subtracted from each sunspot number. The value which works with this emergent analysis and your V2 SSN is 60.
This value should be determined by the physics of the process, not by what ‘fits best’ which is just curve fitting.
rational logical equation
is wiffle-waffle.
1) It isn’t solar radiance that is important, it is the amount of solar radiation that reaches the earth that is important.
2) Where did that temperature graph come from? The “adjusted” data from NASA/NOAA? IN reality there has been no warming according to thermometer data.
Climate “Science” on Trial; The Moment of Truth
https://co2islife.wordpress.com/2017/03/21/climate-science-on-trial-the-moment-of-truth/
Climate “Science” on Trial; Temperature Records Don’t Support NASA GISS
https://co2islife.wordpress.com/2017/03/12/climate-science-on-trial-temperature-records-dont-support-nasa-giss/
IN reality there has been no warming according to thermometer data
The non-NASA satellite data shows warming since they began:
http://www.drroyspencer.com/latest-global-temperatures/
That is the “adjusted” data, take a look at the link. It has all the long term thermometer data sets. They don’t show warming.
Look at the Oulu data and RSS temperature data at comment https://wattsupwiththat.com/2017/03/31/current-weak-solar-cycle-could-reduce-global-temperatures-by-half-a-degree/#comment-2465106
above. There is a 12 year delay between the solar millennial activity peak in 1991 and the corresponding RSS millennial temperature peak at 2003/4.This important climate trend inversion point also shows up nicely on the global temperature /tropical cloud cover plot.The cooling trend is temporarily obscured by the recent major El Nino but it should be restored by end 2019.
There is a 12 year delay between the solar millennial activity peak in 1991 and the corresponding RSS millennial temperature peak at 2003/4.
Come on.You are off the rails.
For a full discussion of the data and the working hypothesis
and the Published paper on this see
http://journals.sagepub.com/doi/full/10.1177/0958305X16686488
for the more accessible Blog version see
http://climatesense-norpag.blogspot.com/2017/02/the-coming-cooling-usefully-accurate_17.html
This is another example of your blind spot on the relation between power and energy. Solar activity is a power thing and temperature is an energy thing. For a meaningful comparison, you have to take the time integral of the power thing and be smart about how you handle the anomaly reference base and the scale factor to get a valid energy thing. Do it correctly and the delay in the peak of the time-integral is comparable to the peak in the temperature.
You simply evaded my straightforward and sincere request. Thus no cookie for you.
If you want some credibility, please help me by replying in earnest. If not, poof goes my interest…
For the delay see eg Fig 3 at
SOLAR ACTIVITY OVER THE LAST 1150 YEARS: DOES IT CORRELATE WITH CLIMATE?
I. G. Usoskin1, M. Sch¨ussler2, S. K. Solanki2 and K. Mursula3
They say:
“Note that the most recent warming, since around 1975, has not been considered in the above correlations. During these last 30 years the solar total irradiance, solar UV irradiance and cosmic ray flux has not shown any significant secular trend, so that at least this most recent warming episode must have another source.”
The ‘lag’ they are talking about is based on their correlation MJ03 with correlation coefficient 0.33 with a confidence interval of -0.19 to +0.16, thus hardly worth writing home about. As they say: “only marginally significant”.
The correlation between NH temp and the lag shown in their Fig 3 is about + 0.56.
My main basis for the correlation and the lag is simple common sense. The academic establishment has an enormous capacity for ignoring the blindingly obvious. The temperature data show clearly that we are just approaching ,right at or just past a millennial peak . Solar activity has been declining since 1991. Most people recognize the “pause” and the change in trend in the first decade of the 21st century but then embark on head scratching , ad hoc hypothesizing or Orwellian data reanalysis of the past to account for it without any or very little solar connection because this would go against the herd mentality of the dangerous warming meme.The IPCC and the governments asked the scientific community to investigate the effect of CO2 on climate. The right answer should at best have been “we don’t know”. In fact the AR5 SPM says in Footnote 16 page 16 (5): “No best estimate for equilibrium climate sensitivity can now be given because of a lack of agreement on values across assessed lines of evidence and studies.” Paradoxically the claim is still made that the UNFCCC Agenda 21 actions can dial up a desired temperature by controlling CO2 levels. This is cognitive dissonance so extreme as to be irrational. There is no empirical evidence which requires that anthropogenic CO2 has any significant effect on global temperatures but the SPM converts that AR5 statement into a 95% certainty of dangerous warming for policy makers which leads to the entire UNFCCC boondoggle.
The correlation between NH temp and the lag shown in their Fig 3 is about + 0.56.
My main basis for the correlation and the lag is simple common sense
Does common sense also tell you that there is no [or even the reverse] correlation in the SH?
http://www.leif.org/research/lag-corr.png
When thinking about temperature, solar activity and climate it is important to realize that we should look for the general patterns in time and space over wide areas and millennial and multi-decadal time scales. If forecasts are to be usefully accurate they will necessarily lack precision over short times and small areas. When considering the differences between hemispheres for example because of the distribution of the land and the thermal inertia of the oceans the NH will provide more insight as to what the general trends may be. see :
“Solar forcing of regional climate change during the Maunder Minimum.
Shindell DT1, Schmidt GA, Mann ME, Rind D, Waple A.
Author information
1NASA Goddard Institute for Space Studies and Center for Climate Systems Research, Columbia University, New York, NY 10025, USA.
Abstract
We examine the climate response to solar irradiance changes between the late 17th-century Maunder Minimum and the late 18th century. Global average temperature changes are small (about 0.3 degrees to 0.4 degrees C) in both a climate model and empirical reconstructions. However, regional temperature changes are quite large. In the model, these occur primarily through a forced shift toward the low index state of the Arctic Oscillation/North Atlantic Oscillation as solar irradiance decreases. This leads to colder temperatures over the Northern Hemisphere continents, especially in winter (1 degrees to 2 degrees C), in agreement with historical records and proxy data for surface temperatures.”
Mann seems to have forgotten he ever wrote this paper
The establishment scientists in general approach the problem without the necessary time and space perspective. Their way is like looking at a large pointillist landscape from 6 inches away. ( probably less in some cases)
more insight as to what the general trends may be
Trends have no predictive power. Only mechanisms have.
lsvalgaard April 3, 2017 at 1:26 pm
I have to agree with that. Waiting and watching for trend reversals is how you make money in markets.
Only trends or quasi repetitive pattern’s have any predictive power at all. The Mechanistic modelling approach is of limited value for predicting future temperature with any calculable certainty because of the difficulty of sampling or specifying the initial conditions of a sufficiently fine grained spatio-temporal grid of a large number of variables with sufficient precision. In addition, Essex 2013 proved that models with the number of variables in the GCMs are simply incomputable. Essex. Believing six impossible things before breakfast, climate models, http://www.youtube.com/watch?v=hvhipLNeda4 (2013
By chance selection of a particular solar cycle and a bit of luck you might forecast 1 solar cycle ahead but even then unless you know where you are with regard to the general trends you forecasts may not be particularly accurate.
Harrison and Stainforth 2009 say
Harrison S and Stainforth D. Predicting climate change, p. 111, http://onlinelibrary.wiley.com/doi/10.1029/2009EO130004/pdf
“Reductionism argues that deterministic approaches to science and positivist views of causation are the appropriate methodologies for exploring complex, multivariate systems where the behavior of a complex system can be deduced from the fundamental reductionist understanding. Rather, large complex systems may be better understood, and perhaps only understood, in terms of observed, emergent behavior. The practical implication is that there exist system behaviors and structures that are not amenable to explanation or prediction by reductionist methodologies. The search for objective constraints with which to reduce the uncertainty in regional predictions has proven elusive. The problem of equifinality ……. that different model structures and different parameter sets of a model can produce similar observed behavior of the system under study – has rarely been addressed.”
A new forecasting paradigm is required.
Only trends or quasi repetitive pattern’s have any predictive power at all
As wrong as can be. Unless the pattern is supported by a plausible mechanism, any prediction is illusory. Typical example is the trend of sunspot numbers:
http://www.leif.org/research/SSN-Faux-Trend.png
Use the trend and predict the next cycle…
No one who knew what they were doing would think that any useful prediction could be made from that time series alone. Until you have some idea of where the present time sits with relation to the current millennial and the last several 60 year cycles one doesn’t know how to even begin. For how to do it see
http://climatesense-norpag.blogspot.com/2017/02/the-coming-cooling-usefully-accurate_17.html
I expect that at the end of the penultimate cycle shown solar geophysicists might have tried to make a forecast for the final cycle in the series – how did they do?
Further Note
The connection between solar “activity” and climate is poorly understood and highly controversial. Solar “activity” encompasses changes in solar magnetic field strength, IMF, GCRs, TSI, EUV, solar wind density and velocity, CMEs, proton events, etc. The idea of using the neutron count and the 10Be record as the most useful proxy for changing solar activity and temperature forecasting is agnostic as to the physical mechanisms involved. Having said that, however, it seems likely that the three main solar activity related climate drivers are the changing GCR flux – via the changes in cloud cover and natural aerosols (optical depth), the changing EUV radiation producing top down effects via the Ozone layer, and the changing TSI – especially on millennial and centennial scales. The effect on observed emergent behaviors i.e. global temperature trends of the combination of these solar drivers will vary non-linearly depending on the particular phases of the eccentricity, obliquity and precession orbital cycles at any particular time convolved with the phases of the millennial, centennial and decadal solar activity cycles and changes in the earth’s magnetic field. Because of the thermal inertia of the oceans there is a varying lag between the solar activity peak and the corresponding peak in the different climate metrics. There is a 13+/- year delay between the solar activity “Golden Spike” 1991 peak and the millennial cyclic “Golden Spike” temperature peak seen in the RSS data at 2003.6 in Fig. 4. It has been independently estimated that there is about a 12-year lag between the cosmic ray flux and the temperature data – Fig. 3 in Usoskin (28).
Useful forecasts of eclipses were made by the Babylonians and of the seasons by the Stonehenge astronomers without any knowledge of the mechanisms . If you can figure those out you might improve the precision of your forecasts a little bit but a reasonable ballpark accuracy is all that nature allows us because that’s the nature of the beast- see the Harrison and Stainforth quote above.
The connection between solar “activity” and climate is poorly understood and highly controversial. Solar “activity” encompasses changes in solar magnetic field strength, IMF, GCRs, TSI, EUV, solar wind density and velocity, CMEs, proton events, etc. The idea of using the neutron count and the 10Be record as the most useful proxy for changing solar activity and temperature forecasting is agnostic as to the physical mechanisms involved.
All of those follow the same basic solar cycle.
10Be is particularly bad as the deposition is influenced by climate itself, so you will to some extent be correlating climate with climate.
Useful forecasts of eclipses were made by the Babylonians and of the seasons by the Stonehenge astronomers without any knowledge of the mechanisms .
Nonsense. They had a pretty good mechanism: the Sun-god traveled at night behind the northern mountains to emerge the next morning in the East. Never failed.
That works for me !!!
But probably not for the scientific community at large or for people [like me] charged with understanding and predicting these things.
We have different goals. I’m interested in forecasting global temperature with useful ball- park accuracy several hundred years ahead. As I understand it you are working on forecasting sunspot numbers about 1 cycle ahead but have at this time no ability to turn that into a global temperature prediction. I agree that that sunspot number would be useful as far as knowing future space weather is concerned and that you might produce usefully accurate forecasts. As far as future temperatures and climate are concerned it doesn’t advance things much.
We have different goals. I’m interested in forecasting global temperature with useful ball- park accuracy several hundred years ahead
Since you can’t forecast even one cycle ahead, how much faith can one put in your 500-yr forecast?
Your predicted cooling has not materialized:
http://www.leif.org/research/Page-Fail-2.png
The warming trend peaked in 2003/4
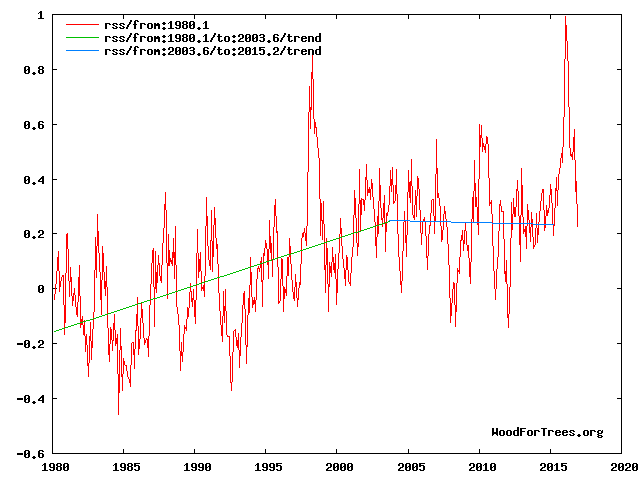
“The RSS cooling trend in Fig. 4 ( Above) and the Hadcrut4gl cooling in Fig. 5 were truncated at 2015.3 and 2014.2, respectively, because it makes no sense to start or end the analysis of a time series in the middle of major ENSO events which create ephemeral deviations from the longer term trends. By the end of August 2016, the strong El Nino temperature anomaly had declined rapidly. The cooling trend is likely to be fully restored by the end of 2019.” From http://climatesense-norpag.blogspot.com/2017/02/the-coming-cooling-usefully-accurate_17.html
I am enjoying this lively thread, but can’t yet decide who’s the most plausible :-((( Have visited your paper, Dan, and liked it. Made me wonder about multiple regression, but I hesitate to attempt to collate and edit all the necessary data.
Does anyone think as I do regarding the sunspot record, in that an enduring change began in 1933? Have seen one mention of it somewhere in this thread, but can’t retrieve it at the moment.
NP – I used an emergent behavior approach to assess global climate and got a 98% match with temperatures 1895-2005 as shown at my blog. (LS calls it “crude curve-fitting”) The thing which brought the last decade or so into line is incorporating the warming effect of increasing water vapor. Water vapor is about 8% higher now than it was in 1960 and is now increasing at about 1.5% per decade.
You still evade replying to my earnest request.
I just did but I am now through for the night.
The Armagh temperature record shows that warmth correlates with solar cycle length.
http://www.sciencedirect.com/science/article/pii/0021916995001484
This should come as a surprise to no one.