From the Swiss National Science Foundation (SNSF)
Sun’s impact on climate change quantified for first time

For the first time, model calculations show a plausible way that fluctuations in solar activity could have a tangible impact on the climate. Studies funded by the Swiss National Science Foundation expect human-induced global warming to tail off slightly over the next few decades. A weaker sun could reduce temperatures by half a degree.
There is human-induced climate change, and there are natural climate fluctuations. One important factor in the unchanging rise and fall of the Earth’s temperature and its different cycles is the sun. As its activity varies, so does the intensity of the sunlight that reaches us. One of the key questions facing climate researchers is whether these fluctuations have any effect at all on the Earth’s climate. IPCC reports assume that recent solar activity is insignificant for climate change, and that the same will apply to activity in the near future.
Researchers from the Physical Meteorological Observatory Davos (PMOD), the Swiss Federal Institute of Aquatic Science and Technology (EAWAG), ETH Zurich and the University of Bern are now qualifying this assumption. Their elaborate model calculations are supplying a robust estimate of the contribution that the sun is expected to make to temperature change in the next 100 years. For the first time, a significant effect is apparent. They expect the Earth’s temperature to fall by half a degree when solar activity reaches its next minimum.
According to project head Werner Schmutz, who is also Director of PMOD, this reduction in temperature is significant, even though it will do little to compensate for human-induced climate change. “We could win valuable time if solar activity declines and slows the pace of global warming a little. That might help us to deal with the consequences of climate change.” But this will be no more than borrowed time, warns Schmutz, since the next minimum will inevitably be followed by a maximum.
Strong fluctuations could explain past climate
At the end of March, the researchers working on the project will meet in Davos for a conference to discuss the final results. The project brought together various research institutions’ capabilities in terms of climate effect modelling. PMOD calculated what is known as “radiative forcing” taking account of particle as well as electromagnetic radiation, ETH Zurich worked out its further effects in the Earth’s atmosphere and the University of Bern investigated the interactions between the atmosphere and oceans.
The Swiss researchers assumed a greater fluctuation in the radiation striking the Earth than previous models had done. Schmutz is convinced that “this is the only way that we can understand the natural fluctuations in our climate over the last few millennia.” He says that other hypotheses, such as the effect of major volcanic eruptions, are less conclusive.
Exactly how the sun will behave over the next few years remains a matter of speculation, however, since appropriate data series have only been available for a few decades and they reveal no evidence of fluctuations during this time. “To that extent, our latest results are still a hypothesis,” says Schmutz, “and it remains difficult for solar physicists to predict the next cycle.” But since we have been observing a consistently strong phase since 1950, it is highly likely that we will experience another low point in 50 to 100 years’ time. It could be every bit as intense as the Maunder Minimum, which brought particularly cold weather during the 17th century.
Important historical data
The research project also placed great importance on the historical perspective. The Oeschger Centre for Climate Change Research at the University of Bern compared data series on past solar activity with other specific climatic conditions. People have been recording the number of sunspots, which correlates well with solar activity levels, for some three centuries now. However, it is much more difficult to quantify exactly how cold it was on Earth back then. “We know that the winters during the last minimum were very cold, at least in northern Europe,” says Schmutz. The researchers still have a fair amount of work to do before they have a detailed understanding of the relationship between solar activity and the global climate both in the past and in the future.
h/t to The GWPF
You don’t get very far in science by making things up. We are still going up in the millennial Eddy solar cycle, that bottomed during the LIA, around the time of the Maunder minimum.
Grand solar minima are pretty rare events, around 35 in 10,000 years, and considering that they usually come in clusters like Wolf/Spörer/Maunder, it might very well be another 500 years before we see one again.
They display such ignorance of past grand solar minima, that it is difficult that their work is any good. The idea that because we got no low solar activity in the past 70 years means we should get it in the next few decades is silly. We are talking about pretty long cycles. The Romans had a millennium of above average solar activity between the Greek minimum of 350 BC and the Roman minimum of 650 AD.
http://www.euanmearns.com/wp-content/uploads/2016/05/Figure-6.png
The idea that because we got no low solar activity in the past 70 years means we should get it in the next few decades is silly
It is also silly to be gripped by cyclomania and make up cycles where there may not be any.
“You don’t get very far in science by making things up.”
You’re kidding, right?
“make up cycles where there may not be any.”
There’s plenty of evidence for a climatic cycle of ~ 2500 years, that happens to match the 2500 year cycle in cosmogenic isotopes.
https://judithcurry.com/2016/09/20/impact-of-the-2400-yr-solar-cycle-on-climate-and-human-societies/
And we know climate is built up on periodicities, from the seasons all the way up to the 150 million year Ice Age cycle. Our interglacial is the product of a cycle.
http://i.imgur.com/C7cCDoy.png
The geologic record preserves cycles and quasi-periodicities of various durations. Milankovitch cycles show up in Miocene Antarctic ice, for instance, and a variety of other pre-Quaternary phenomena:
http://adsabs.harvard.edu/abs/2001AGUFM.U11A..12S
https://link.springer.com/referenceworkentry/10.1007/978-1-4020-4411-3_195
To include the Permian Period:
https://www.researchgate.net/publication/230890686_The_Varve_microcosm_Propagator_of_cyclic_bedding
Some are real [the ones tied to orbital mechanics], some are made up [basically the rest with the exception of the 11-year sunspot cycle].
“Some are real [the ones tied to orbital mechanics], some are made up [basically the rest with the exception of the 11-year sunspot cycle].”
You are not the arbiter of that. That is your opinion, and you are seriously biased against anything non orbital. You are also not that knowledgeable on the paleoclimatic evidence as to be able to dismiss what other more expert scientists are showing.
I’m not given to your confirmation bias and “Science is the belief in the ignorance of experts” as physicist Richard Feynman said in a 1966 talk to high-school science teachers…
The evidence is published for anybody to examine it, as Gloateus has done. Following you will only get people lost as i got lost for believing you when it is clear that you don’t know what you talk about paleoclimate. You won’t get to learn about millennial solar cycles by looking into the Sun. You have to look at the evidence in the Earth, and you aren’t doing that. Your dismissal of millennial cycles carries no weight.
Javier,
I agree that it’s too soon for Maunder-style cold spell.
The millennial-scale solar cycle does seem to be reflected in climate. The peaks of the Holocene warm periods are all about 1000 years apart, and likewise the troughs of the cold periods.
Peaks:
Holocene Optimum: ~5 Ka
Egyptian WP: ~4 Ka
Minoan WP: ~3 Ka
Roman WP: ~2 Ka
Medieval WP: ~1 Ka
Modern WP: peak might be now but more likely in another century, two or three
Depths:
Bronze Age Collapse: ~3.3 Ka
Greek Dark Ages: ~2.3 Ka
Dark Ages CP: ~1.3 Ka
LIA CP: ~300 years ago
Yes, the cyclicity of Holocene climate is undeniable. It is heavily contested because it means we should be warming regardless of CO2, and because it also means solar variability in the millennial time-scale is both cyclic and has a strong effect on climate. Astrophysicists hate that idea because they cannot explain it, but paleoclimatologists are very comfortable with it, because they see the evidence in multiple proxies all over the world.
Javier,
All the while that evidence has been mounting, year after year, for the global extent of centennial- and millenial-scale cycles, consensus “climate science” keeps trying to d@ny the existence of these observations, ie scientific facts. These inconvenient truths were already well established before the CACA c@onspiracy replaced Communism as the main challenge to peace, freedom and prosperity.
“Grand solar minima are pretty rare events, around 35 in 10,000 years, and considering that they usually come in clusters like Wolf/Spörer/Maunder, it might very well be another 500 years before we see one again.”
That implies a long term average of about 285 years. The Steinhilber, et al graph you show suggests that the Wolf-Sporer-Maunder “cluster” might actually be a Wolf-Sporer-Maunder-Dalton cluster. Or possibly even a Wolf-Sorer-Maunder-Dalton-“Abdussamatov?” series?
From the end of the Younger-Dryas to today the current interglacial seems to be a series of declining peaks. The peak of the Minoan was a bit higher than the Roman, which was a bit higher than the Middle Age which was slightly higher than the current – if it did in fact peak about 1997-2000 as data not based on “adjusted” past temperature records seems to suggest. All of these are slightly lower than the unnamed peaks that preceded the Minoan.
If we consider the possibility that 1997 might be an echo of the beginning of the Dalton then Dr. Abdussamatov’s projected “low point” around 2065 fits very nicely with your 285 year rare event timing.
I realize that, having no scientific degree, I am commenting way above my pay grade. WUWT contributors seem to make more common sense than those who Mann the trenches of the AGW PC literature and are much appreciated.
One must admit it’s nice to know we’ll have a few extra years warmth from buying all that time for climate change until the next glaciation buries our tomatoes under a mile of ice.
in Holland they are adding about 1000 ppm CO2 to the greenhouses to get bigger tomatoes…
Henryp, Not only in Holland. Growing under glass is world wide and is fantastic.http://www.btlliners.com/geothermal-heated-greenhouses/?gclid=CKW8_MrtgtMCFRBxfgodXRwHPw
And that is one example.
But they are not all a good thing either.:http://www.freshplaza.com/article/153891/Norwegian-greenhouse-tomatoes-in-winter-not-environmentally-friendly
“Studies funded by the Swiss National Science Foundation expect human-induced global warming to tail off slightly over the next few decades.”
President Trump said: “Global warming is not man made”
President Putin said today: “Global warming is not man made”
Chinese president Xi Jinping is expected to come to similar conclusion in a very near future.
“A weaker sun could reduce temperatures by half a degree.”
It depends what they mean by weaker sun. Most of commentators ude the sunspot count to measure the solar impact on climate. As we have heard many times the TSI variability is to small to account.
I personally have been suggesting for some years now that it is the Sun-Earth magnetic connection, as measured by number of the geomagnetic storms, is the operating factor.
http://www.geomag.bgs.ac.uk/images/image022.jpg
145 years of sunspot and geomagnetic storm recording. Sunspot numbers per year (red) are shown on the right hand axis and storm numbers (blue) on the left hand axis. Individual sunspot cycles are numbered. Figure courtesy BGS.
You might conclude that geomagnetic storms data do not have nice clear cut 11 year cycle (unlike sunspot data) and you would be correct.
However there is a 22 year Sun-Earth magnetic cycle as Dr. Svalgaard has clearly demonstrated
http://www.leif.org/research/Storms-Even-Odd-No-Difference.png
Although the average intensity of geomagnetic storms is the same in both even and odd cycles, there are 374 storms in the odd and 445 storms (or nearly 20% more) in the even cycles since 1905.
Why the asymmetry between odd and even cycles (the foundation of a 22 year cycle?
NASA observation may provide an insight into this even-odd cycles anomaly in this statement:
“We’re entering Solar Cycle 24. For reasons not fully understood, CMEs in even-numbered solar cycles (like 24) tend to hit Earth with a leading edge that is magnetized north. Such a CME should open a breach and load the magnetosphere with plasma just before the storm gets underway.”
Here is the Link to the article, well worth reading, since it implies that the science is far from settled:
“This finding fundamentally alters our understanding of the solar wind-magnetosphere interaction.”
Question is how geomagnetic storms percolate into global climate?
This comment is long enough as it is, but might say a bit more later on a possible linkage.
However there is a 22 year Sun-Earth magnetic cycle as Dr. Svalgaard has clearly demonstrated
Again, Vuk. This is nonsense. The reason for more events during even cycles is that the data start and end in an even cycle, so there are more days in even cycles than in odd cycles.
You did not learn anything last time, and you probably won’t learn anything this time around either, but, please don’t pollute WUWT with your nonsense.
Odd cycles since 1905: 15, 17, 19, 21 and 23 that makes it 5 cycles or 74.8 storms/odd cycle
Even cycles since 1905: 2/3 of cycle 14 (started in 1901), 16, 18, 20, 22 and 2/3 of cycle 24 (started in 2010), that makes it 5 and 1/3 cycles or 83.4 storms/even cycle
Still difference of 11.5% in favour of the even cycles.
However, as the BGS graph shows, with the SC24 solar activity is at the start of the next (100+ years) Gleissberg cycle, so for a fair comparison it is needed the number of storms for the previous Gleissberg cycle from 1901 to 2010, containing equal number of the odd and even cycles,
If you got the numbers we can look at it again.
Still difference of 11.5% in favour of the even cycles.
There were 6 even and 5 odd cycles contributing to my graph. More importantly: the storms in either group were equally strong contradicting your ‘northward’ fields and ‘breach’ ideas. One more time: there is no difference in storm intensity between even and odd cycles.
If anything, there is a 22-year cycle in geomagnetic activity [known since 1966] but the cycles run from maximum to maximum, thus have nothing to do with even/odd which runs from minimum to minimum.
I must admire your capacity of self-deception. It is unusual to find one that strong.
“There were 6 even and 5 odd cycles contributing to my graph”
No there were not,
1905 to 2016 inclusive there were 5 odd and 5.2 even cycles.
1901(start of SC14) to 2010 (end of SC23), 10 cycles in total (5 odd & 5 even), include minus 4 years (1905-1901) and plus 6 years (2016-20100) = 2 years, which makes it 1/5 of a cycle, making difference a bit higher at 14.5%.
If you get data for 1901-2010 (5 odd & 5 even cycles) then we can look at it again.
Well, I looked again. First I show the data separately for Odd and Even cycles using your [BGS] chart of storms:
http://www.leif.org/research/Even-Odd-Cycle-Storms.png
(I used cycle 14 as a proxy for cycle 24).
Looking at this it seemed that there should have been more storms during odd cycles [because the sunspot cycles were generally larger]. This prompted me to re-examine the program for the superposed epoch Dst plots and noted that there was a clerical error: Even and Odd were inadvertently switched around. The correct plot should be this:
http://www.leif.org/research/Dst-Even-Odd-and-A-Parity.png
This, of course, nullifies the discussion about how many cycles or fractions thereof were used, showing the danger of small-number statistics.
The lower panel shows Dst for A>0 [that is when the North Pole has positive [away] polarity] and for A<0 [when the North Pole has negative [toward] polarity]. such periods change at sunspot maximum, not at minimum and thus have nothing to do with Even/Odd cycles.
I was using your numbers, so thanks for doing that too. If so there is still imbalance between odd and cycles creating 22 year (but not 11) cycle which can be found both land and land&ocean global temperature data spectral distribution . Another test would be to compare sums of all SSN in odd even cycles.
You referred to the false ‘northward’ field cause as an explanation. There is absolutely no difference between geomagnetic activity between Even and Odd cycles.
Update. [I forgot cycle 18]
http://www.leif.org/research/Even-Odd-Cycle-Nbr-Storms.png
Any imbalance is purely accidental, and the so-called Odd-Even rule [The sum of sunspots number over an odd numbered 11 yr sunspot cycle exceeds that of its preceding even numbered cycle] has failed several times, so is not really a ‘law of solar activity’.
22 year component is present in the global temperature data
22 year component is part of the geomagnetic field’s secular variability (data A. Jackson)
22 year asymmetry is present in odd/even cycle neutron count.
As usual, more research is required, but I give up for now.
22 year component is present in the global temperature data
No, there isn’t:
http://www.leif.org/research/No-22-yr-Temp-Variation.png
It was present in the GISS land and land&ocean data spectra some 4 years ago, when I looked at it last time. However data may have suffered number of transmutations since.
More research is required, but I give up for now.
Did I hear someone say ‘Clouds, what about clouds?’
Hi Tom
You are getting warmer, ‘clouds in the in the long Arctic winters’.
That pic almost makes it look like the sun will split in half!
And the range of prophesies widens even further ! 🙂
It is ironic that for a long time, the story was “it’s not the Sun”, and now we have some folks saying “it’s the Sun”. But why? To explain the pause. This allows them to posit that some terrifying evil is waiting to be revealed once the Sun exits the slump. There night or might not be any such motivation amongst the authors of this paper, but there are pleny of folks who will be more than happy to jump on that bandwagon.
And of course this is based mostly on unproven models of unproven theories about the Sun/climate connection which for so long they have ignored.
Pushing ‘it’s the Sun’ is good for funding of some people…
And pushing “it’s not the Sun” is quite good for funding for lots of other people.
Just saying
Just like pushing it’s co2 has been good for funding some people.
@jim G1 , isn’t the next best thing methane? I’d be buying stocks into that if I knew how ( The Japanese seem to be big on that one to alleviate their energy short comings, they have just launched a program to assess that)
I just don’t get all of this fuss. Personally, I think that if it were 2C warmer, Canada and Siberia would become the breadbaskets of the world and food production would go way up. Fewer people would die of cold snaps and more of the world would be like the tropics. We would have to deal with desert zone moving slightly farther north (or south in the southern hemisphere ) due to the expansion of the Hadley cells, but it wouldn’t be wider, just the band of dry we get now, slightly farther from the equator. A decrease in temperature differential between the poles and equator would lead to a decrease in severe storms. It all looks like a big win for the natural world to me.
Cold, however, KILLS!
An earlier post is pertinent to this thread also.
Here is what’s really going on. We are just past a millennial and 60 year natural ( solar activity driven ) temperature peak.
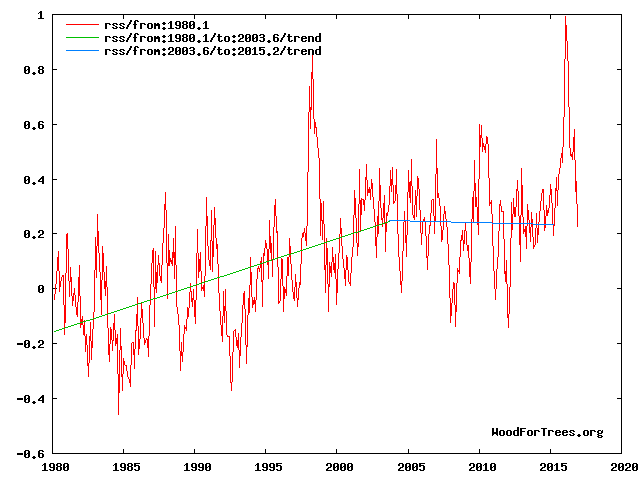
The RSS cooling trend in Fig. 4 (above) was truncated at 2015.3 , because it makes no sense to start or end the analysis of a time series in the middle of major ENSO events which create ephemeral deviations from the longer term trends. By the end of 2016, the strong El Nino temperature anomaly had declined rapidly. The cooling trend is likely to be fully restored by the end of 2019.
Here is the 100 year forecast
Fig. 12 (above) compares the IPCC forecast with the Akasofu (31) forecast (red harmonic) and with the simple and most reasonable working hypothesis of this paper (green line) that the “Golden Spike” temperature peak at about 2004 is the most recent peak in the millennial cycle. Akasofu forecasts a further temperature increase to 2100 to be 0.5°C ± 0.2C, rather than 4.0 C +/- 2.0C predicted by the IPCC. but this interpretation ignores the Millennial inflexion point at 2004. Fig. 12 shows that the well documented 60-year temperature cycle coincidentally also peaks at about 2004.Looking at the shorter 60+/- year wavelength modulation of the millennial trend, the most straightforward hypothesis is that the cooling trends from 2004 forward will simply be a mirror image of the recent rising trends. This is illustrated by the green curves in Fig. 12, which shows cooling until 2038, slight warming to 2073 and then cooling to the end of the century, by which time almost all of the 20th century warming will have been reversed

The temperature inflexion point at 2004 corresponds with a 12 year +/- lag to the Solar activity high ( Neutron low) at 1991. 9Below)
The same inflexion point is also seen in the global temperature and tropical cloud cover data.
For the Published paper on this see http://journals.sagepub.com/doi/full/10.1177/0958305X16686488
for the Blog version see
http://climatesense-norpag.blogspot.com/2017/02/the-coming-cooling-usefully-accurate_17.html
The sun is a serial climate changer. The question is not if but how solar cycle changes cause cyclic climate change, sometimes abrupt climate change such as the Younger Dryas abrupt climate change.
The answer to the puzzle, how the sun causes cyclic climate change, can be found by looking at all of the anomalies and paradoxes.
The Younger Dryas (YD) abrupt cooling period occurred 12,900 years ago at a time when solar insolation at 65N was maximum. The planet when from interglacial warm to glacier cold with 70% of the cooling occurring in less than a decade and with the cold period lasting 1200 years.
In the last decade, the geomagnetic specialists have found that the geomagnetic field intensity and inclination is changing cyclically correlating with solar cycle changes and climate changes.
The changes in geomagnetic field are too rapid and too large to be caused by internal changes in the flow of magma in the earth.
There is no internal earth mechanism that can suddenly cause massive and cyclic changes in magma movement in the core of the earth and even if there was, it is fact that a back of the envelop calculations indicates that a back EMF is generated in the mantel that resists rapid changes to the geomagnetic field.
As there must be a physical explanation for everything that has and will happen.
If and when there is in your face cooling I can and will explain what is happening. If I understand what happened in the past and what is currently happening to the sun, this is the most important scientific event in the last millennium.
http://www.scientificamerican.com/ar…than-expected/
http://citeseerx.ist.psu.edu/viewdoc/download?doi=10.1.1.483.2889&rep=rep1&type=pdf
http://geosci.uchicago.edu/~rtp1/BardPapers/responseCourtillotEPSL07.pdf
The likelihood is that the Younger Dryas was a one – off caused by a dusty comet strike in the vicinity of Hudsons Bay
http://www.pnas.org/content/104/41/16016.abstract
An astronomical object impact will not cause the planet to abruptly cool for 1200 years (the effect is similar to a large volcanic eruption) and will not burn the surface of the planet at multiple locations, at different latitudes, leaving no craters.
The burn marks were caused by the sun when the solar cycle restarts and is the reason why there are geomagnetic excursions at abrupt climate change events.
http://www.pnas.org/content/104/41/16016.full
“Evidence for an extraterrestrial impact 12,900 years ago that contributed to the megafaunal extinctions
and the Younger Dryas cooling”
The following is further evidence that there is a massive geomagnetic field change coinciding in time with Younger Dryas abrupt cooling event.
http://www.sciencedirect.com/science/article/pii/003358947790031X
The burn marks were caused by the sun when the solar cycle restarts
More nonsensical than most of your usual stuff.
Hi William,
A magnetic excursion is an interesting addition to the YD period of interest.
The Gothenburg Magnetic Excursion
Nils-Axel Mörner
May 1977
http://www.sciencedirect.com/science/article/pii/003358947790031X
Multiple exploding impactors (ET) events also posit interesting scenarios.
As discussed in:
Evidence for an extraterrestrial impact 12,900 years ago that contributed to the megafaunal extinctions and the Younger Dryas cooling
Burn marks caused by the sun, might be kinda tough to prove. An already weakened magnetic field in areas of interest, followed by multiple carrington type events? Even then, might be tough to attribute those “black mats,” to solar events. Weak field may be a starting point, though.
I think the next two articles show relationship.
Earth’s Mantle Is Hotter Than Scientists Thought
The finding will help scientists more accurately model the planet’s geodynamic processes
By Laura Geggel, LiveScience on March 4, 2017
https://www.scientificamerican.com/article/earths-mantle-is-hotter-than-scientists-thought/
How hot are Earth’s scorching insides? A sweltering 2,570 degrees Fahrenheit (1,410 degrees Celsius), a new study finds.
The discovery reveals that the mantle under Earth’s oceans — the area just below the crust that extends down to the planet’s inner liquid core — is almost 110 degrees F (60 degrees C) hotter than scientists previously thought, the researchers said. The finding will help scientists more accurately model Earth’s many geodynamic processes, including plate tectonics, they said.
…Their results suggested that the mantle melts when it is relatively close to the Earth’s surface. That runs counter to another recent finding, which showed that the mantle actually melts deep beneath the Earth’s surface….
Take note Dr. S.!
…The discovery is “an appreciable correction” for the temperature of the mantle under the ocean, Paul Asimow, a professor of geology and geochemistry at the California Institute of Technology who was not involved with the study, wrote in an accompanying commentary in the journal Science.
The finding “will change interpretations of geophysical observations of the asthenosphere worldwide,” Asimow wrote….
Changes measured by the Swarm satellite show that our magnetic field is weakening 10 times faster than originally predicted, especially over the Western Hemisphere
By Kelly Dickerson, LiveScience on July 9, 2014
https://www.scientificamerican.com/article/earth-s-magnetic-field-flip-could-happen-sooner-than-expected/
…data from Swarm have shown the field is starting to weaken faster than in the past. Previously, researchers estimated the field was weakening about 5 percent per century, but the new data revealed the field is actually weakening at 5 percent per decade, or 10 times faster than thought. As such, rather than the full flip occurring in about 2,000 years, as was predicted, the new data suggest it could happen sooner….
…The movement of the molten metal is why some areas of the magnetic field strengthen while others weaken, Florberghagen said. When the boiling in one area of the outer core slows down, fewer currents of charged particles are released, and the magnetic field over the surface weakens.
“The flow of the liquid outer core almost pulls the magnetic field around with it,” Floberghagen said. “So, a field weakening over the American continent would mean that the flow in the outer core below America is slowing down.”…
Rotation speeding up has its hemispheric asymmetry in outer core hotspot releases regions, as does its slowing down in the building up of heat in different locations.
Speeding up, core cooling and slowing down, core heats.
no no no yes yes yes
The discovery reveals that the mantle under Earth’s oceans — the area just below the crust that extends down to the planet’s inner liquid core — is almost 110 degrees F (60 degrees C) hotter than scientists previously thought
Another one of those breathless hypes. The crust under the oceans is 7-10 km thick and the temperature down there is in the excess of 1000 C. That it now is found to be tiny bit hotter [60C] has no impact on our climate. Nothing to take note of.
There is almost zero likelihood of that.
The YD was not caused by an impact. There is no evidence whatsoever in favor of that baseless conjecture.
It was just one of many such cold snaps during the last termination, and one of many more during all prior deglaciations.
And, I should add, all the real evidence in the world against it.
Dr. Page,
Are you really not aware, sir, of the withering debunking, ie total destruction of this baseless 2007 WAG by real scientists over the past decade?
There is nothing different in the YD than in the Middle Dryas, the Older Dryas and all the other cold snaps in interglacials and even glacials, ie Heinrich Events, before it and after it, such as the 8.2 Ka event and Bond Cycles.
Hence, no need to invoke magical impacts for which there is less than no evidence.
According to the UK’s MetOffice definition
“Climate change is a large-scale, long-term shift in the planet’s weather patterns or average temperatures.”
the last climate change occurred at transition from the last ice age to the present interglacial, with possibility of Younger Dryas (as long as it was global event) also being one.
The most conservative estimate of the ‘large-scale’ shift certainly has to be at least + or – 1% of the long term average.
0.17% change in the global temperature over period of the last 30 years does not qualify as ”a large-scale, long-term shift” .
If anyone likes to disagree, please state your case.
Hang on….
What the sun will do in the next few years is open to speculation but what the entire global climate response to human activity emitting CO2 100 or 200 years from now is known with certainty? Is that the gist?
Compelling evidence from recent to at least as far back as 500 million years ago all agree that CO2 has no significant effect on climate. Six examples of that evidence are listed in http://globalclimatedrivers2.blogspot.com along with explanation of why CO2 has no significant effect on climate. There is no reason to believe that will change in the next 100 or 200 years . . . or ever.
I am pretty sure all the evidence suggests that sometime in the next 10,000 years or so we will be in another glaciation period.
If it got to the point that they are already conceding that (shock! awe!) there may be a half-degree cooling and that the global warming trend may be “temporarily offset” my feeling is that the actual drop will be much higher and we’ll enter another Little Ice Age.
Ever enhanced climate business models reaching for gold.
So, to help establish any credibility to the studies of the Swiss National Science Foundation, we need funds going to half a dozen solar scientists to attempt to reproduce their results.
Go for it, the Trump Administration and congress are in a receptive mood funding other climate science topics since CO2 research funds will be severely cut.
John
Most of what we are told about the Earth is Social Science rather than Science. A drop in Solar radiation could have explained the events that happened during the period which was called the little ice age it explains that well. There is nothing that I have to accept about the Earth other than what we find by examining data so all this the oceans are more important than the atmosphere and we are biased against the Southern hemisphere or the Sun cannot effect climate are all social science concepts not scientific facts. we should make more effort to measure the ocean surface temperature accurately if you believe it is more important than anything else in understanding the earths climate. Solar radiation heats up the surface of the but an inspection of world temperatures reveals that solar radiation has a hard time heating up the Continent of north America each year in fact all high altitude areas have pools of cold near surface temperatures well into spring in addition to high latitude cold or the fact that it is a large land mass. I don’t share the opinions expressed that the greenhouse effect has a large influence on Earths climate if we have a warm period in the geological past the question seems to be how much increased co2 we must have had in the atmosphere to account for that warmth when there could have been other explanations, increased solar radiation for instance.
Yes! We’re doomed!
It is remarkable that the ever glowing CBC global warming little soldier Bob McDonald, whose posts are virtually never open for comments, would come up with yet another peddling of The David Keith mad geo-engineering projects.
http://www.cbc.ca/news/technology/bob-macdonald-blocking-sun-global-warming-1.4050149
“Blocking out the sun to fight global warming: Bob McDonald
Solar geoengineering is controversial but proponents say we have no choice”
David Keith always knows how to get funding… LOL But the CBC’s Bob McDonald always knows how to reach new lows of agitprop:
250 years???? Yeah so many SUVs in 1767… That is during Louis XV reign…
Well the CBC little soldier continues his deception with article like this one:
http://www.cbc.ca/radio/quirks/deleting-science-heat-and-violence-neurolaw-and-more-1.4045849/arctic-researcher-says-white-house-is-deleting-her-citations-1.4049900
This week the news outlet, The Guardian, published an opinion piece from the managing director of The Arctic Institute. It’s titled, “I am an Arctic researcher. Donald Trump is deleting my citations.” In it, Victoria Herrmann says since the inauguration, links to important Arctic policies, reports, and data have been disappearing.
Poor CBC relying on The Grauniad for its propaganda…
CBC has also deleted your link to the article…
@lsvalgaard LOL still works.
The strongest 63-year string of solar cycles in 11,400 years occurred from 1933~1996 (Solanki et al 2001).
If weak solar cycles can decrease global temperatures by 0.5C, it’s only logical to assume a 63-year string of strong solar cycles can increase global temperatures by at least the same amount.
CAGW alarmists can’t have their cake and heat it, too…
The strongest 63-year string of solar cycles in 11,400 years occurred from 1933~1996 (Solanki et al 2001).
No, that has been thoroughly debunked. e.g. Raymond Muscheler [2005, 2016]
“solar activity around AD 1150 and 1600 and in the late eighteenth century was probably comparable to the recent satellite-based observations. In any case, as noted by Solanki et al., solar activity reconstructions tell us that only a minor fraction of the recent global warming can be explained by the variable Sun.”
Only a minor fraction of the recent global warming can be caused by variations in total solar energy output. However, there are many suggested amplification mechanisms under consideration.
None of which are effective.
Leif,
IMO UV flux-modulated ozone variation can’t help but affect climate. Same goes for solar magnetism-modulated GCR flux and CCN formation. Ditto effect of solar radiation heating of oceans.
Unfortunately, the evidence for that is weak, or rather: the influence is there but is so small that it is in the noise.
The best way of seeing this is to compare the (E)UV and magnetic records with the temperature.
We can reconstruct those records WAY back in time with confidence, see e.g.
http://www.leif.org/research/EUV-F107-and-TSI-CDR-HAO.pdf
The money graph are those:
http://www.leif.org/research/EUV-Reconstruction-Long-Term.png
and slide 45.
They show that the variation is not at all like the climate record.
The magnetic field in the solar wind creates geomagnetic activity which we measure appropriately with the aa-index. Some people think they can see some correlation, perhaps before 1980 – although it is not statistically significant, buy certainly that breaks down after 1980 [when we have Global Warming], so it is hard to blame the GW on geomagnetic activity.
http://www.leif.org/research/Aa-Index-and-Temperatures.png
All this is IMHO. Your mileage may vary according to your beliefs and bias.
March sunspot number update
SSN for March is down at ~10.6 (Feb. @ur momisugly 15.7) in the classic Wolf numbers, while the new Svalgaard number is 17.7 (Feb @ur momisugly 26.1)
Composite graph can be found here
From this point on all my post will be like this one. I am not conversing with anyone.
It is a weak solar/albedo/lower sea surface temperature play that will put an end to the global warming theory . El NINO if it should come this summer may delay the drop but once the drop occurs which will likely be after this next El Nino ends and it will be fast.
Albedo should increase, even a 1/2% increase is significant , and sea surface temp. should cool all in response to very weak solar.
Increase in clouds, volcanic activity ,snow cover should result in a higher albedo, response to very low solar activity . Less UV light will promote lower sea surface temperatures.
Not much more say but wait and see how this unfolds as solar activity should remain very weak going forward.
I think you are wrong on the conversing part. Talking with people who cut and paste, and no matter how much you explain your point of view, they will never say ” you have a point “. I still engage with those people from time to time. It is a wealth of information to use against them at a later time. And if they are sincere in their arguments, then I see no reason not to. It is impossible to research and know the vast amount of information out there. Asking questions, along with the insight of someone who has thought about it can be a great help. It can lead you insights you may not have thought about.
Arguing with a true believer in the Holy church of AGW is almost always a waste of time. The exchanges are endless and one of their strategies for them is to get you into name calling.
I like talking to Isvalgaard, although I’m not sure exactly what he thinks about AGW. I do know that he doesn’t think changes in the sun are responsible for temperature changes. He has some well thought out ideas and research to support him. I generally read everything he says. Additionally, I read the exchanges between him and Carla. Carla has some good points.
I think changes in climate are very complex. I certainly think the sun has something to do with it. There are a lot of good well thought out theories that time will tell if they have merit. I can certainly entertain them. The one thing that all of this has led me to is that co2 follows temperature. I am fairly certain. Unless there is new and overwhelming evidence to the contrary, it will be extremely difficult for me to think otherwise.
Do you really think the earth receives a constant 1367 w/m^2 throughout the year ? The answer is, it doesn’t. It’s not even an average. But they talk about it as if it is. The swing is about 90 w/m^2.
Are we Serious???? Scientists are FINALLY realizing Solar activity has an affect on our Weather? WOW…… I have ALWAYS believed it to be so. Heating of the Earth’s Mantel thru the poles during Solar storms introduces stress upon our tectonic plates and can contribute to earthquakes……. Yes, Man is contributing to Global warming……. Man, is NOT the root cause. Far too many OTHER factors come into play to single out ONE cause.
Computer models are only as good as the people that program them. And as we all know humans make mistakes. in my state (Colorado) the meteorologists can’t even predict the weather correctly 50 percent of the time and I’m supposed to believe they can predict global warming 30 years from now. Ridiculous.
The cult of CAGW have hidden the fact that there is cyclic abrupt climate change in the paleo record from the general public.
It is a fact, not a theory, that the planet has cyclically warmed and cooled in the past with all of the changes in planetary temperature correlating with solar cycle changes.
The past is a guide to the future. There was and is a physical reason why the planet warmed and cooled cyclically in the past.
The problem is not if the sun causes cyclic abrupt climate change but rather how the sun causes what is observed.
There are more than a dozen independent observations and analysis results that support the assertion that the warming in the late 20th century and the warming in the last 150 years was caused by solar cycle changes rather than the increase in atmospheric CO2.
Antarctic ice sheet temperatures last 500,000 years. The interglacial periods are short roughly 10,000 years. The interglacial periods all end abruptly and are followed by roughly a 100,000 year glacial period.
Note the Antarctic continent ice sheet proxy analysis does not capture the cyclic abrupt climate change, as the Antarctic continent temperature is isolated from the Southern Sea temperature by an extraordinary strong Southern Polar vortex.
The Antarctic peninsula extends out past the extent of the Southern Polar vortex. Temperature analysis of the Antarctic peninsula ice core shows the same 1500 year cyclic warming and cooling that is observed in the Northern hemisphere.
http://cdiac.ornl.gov/trends/temp/vostok/graphics/tempplot5.gif
http://www.climate4you.com/images/GISP2%20TemperatureSince10700%20BP%20with%20CO2%20from%20EPICA%20DomeC.gif
Greenland Ice Sheet Temperatures Last 100,000 years
http://www.hidropolitikakademi.org/wp-content/uploads/2014/07/4.gif
It is interesting that the Dansgaard/Oescheger cyclic warming periods in all case followed by cooling periods have the same weird regular period of 1470 years in both the glacial period and the Holocene interglacial period.
Earth climate drivers/changes would be expected to be drastically different in the interglacial period as compared to the glacial period.
The observational fact, that the period between warming and cooling events stays at 1470 years in both interglacial and glacial periods is one of the dozen observations/analysis results that supports the assertion that solar cycle changes caused the cyclic warming and cooling of the planet rather than earth based changes which are expected to be chaotic not cyclical.
http://www.agu.org/pubs/crossref/2003/2003GL017115.shtml
As there are cosmogenic isotope changes that are concurrent with all of the Dansgaard/Oescheger events (also referred to a Bond events named after the late Gerald Bond who tracked 23 of the cycles) and the Heinrich events it is obvious a specific solar cycle change is causing what is observed.
It is obvious if one looks at the past Greenland Ice Sheet temperature data and the cycles of warming and cooling that the planet is about to abruptly cool.
http://en.wikipedia.org/wiki/1500-year_climate_cycle
http://www.geo.arizona.edu/palynology/geos462/8200yrevent.html
Greenland Ice Sheet temperatures during the last 11,000 years (Holocene Interglacial Period)
http://www.climate4you.com/images/GISP2%20TemperatureSince10700%20BP%20with%20CO2%20from%20EPICA%20DomeC.gif
It is a fact, not a theory, that the planet has cyclically warmed and cooled in the past with all of the changes in planetary temperature correlating with solar cycle changes.
No, that is not a fact, and not even a theory.
BTW, any news on the Polar Field observations error you mentioned recently?
I have’t seen any recent data corrections.
We are still investigating. This may take some time. In the meantime use the HMI polar fields:
http://jsoc.stanford.edu/data/hmi/polarfield/
which are updated every Monday.
The NSO [SOLIS] also compute the polar fields [updated every clear day:
http://solis.nso.edu/0/vsm/vsm_plrfield.html