Guest essay by Mike Jonas
/Continued from Part 2
6. The Awful Process
6.1 Paradigm Shift
In Part 1, I referred to the truly awful process by which science currently operates.
Science is supposed to be self-correcting, and Karl Popper described the process by which this should be achieved: empirical falsification. Every hypothesis has to be falsifiable, and every hypothesis can and should be tested in every way possible.
The way that science actually works was later described by Thomas Kuhn: paradigm shift. Once a scientific pattern (paradigm) is generally accepted, it stays in place until a new paradigm replaces it.
Provided science is conducted honestly, it will progress reasonably smoothly, with all paradigms open to proper testing. Unfortunately, a culture of gate-keeping has prevailed within science for a long time, whereby a current paradigm is tenaciously defended in the face of contrary evidence until its defenders’ position becomes politically untenable. One of the techniques is to abuse the peer-review process in order to prevent contradictory papers from being published, hence the term ‘gate-keeper’. The gate-keepers are typically those who have staked their reputation on the paradigm that they are defending. Over time, it seems that gate-keepers have become more adept, but that may be illusory – back in the 1930s(?), Max Planck said “A new scientific truth does not triumph by convincing its opponents and making them see the light, but rather because its opponents eventually die, and a new generation grows up that is familiar with it.” [Now paraphrased as “Science advances one funeral at a time“].
Climate science has suffered massively from gate-keeping, as revealed by Climategate. Physicist Harold Lewis, in his letter of resignation to the APS, wrote “It is of course, the global warming scam, with the (literally) trillions of dollars driving it, that has corrupted so many scientists, and has carried APS before it like a rogue wave. It is the greatest and most successful pseudoscientific fraud I have seen in my long life as a physicist. Anyone who has the faintest doubt that this is so should force himself to read the ClimateGate documents, which lay it bare. [] I don’t believe that any real physicist, nay scientist, can read that stuff without revulsion.”. Climategate was in 2009 and Harold Lewis’ resignation letter was written in 2010, yet the CAGW paradigm has continued to be successfully protected by the gate-keepers.
6.2 The Hot-Spot
As might be guessed from Harold Lewis’ letter, there has been a massive amount of unscientific behaviour within the climate science fraternity. Most here at WUWT will be familiar with much of it, but I will highlight one item only, because it illustrates several relevant features.
One of the persistent claims by those critical of mainstream climate science is that the lack of a Tropical Troposphere “Hot Spot” proves that the IPCC and the climate computer models are wrong. For those not familiar with the Hot Spot, it was identified in the fourth IPCC report as the principal place where man-made-CO2-driven warming originates, and from where it spreads to the rest of the globe.

Figure 3.1. From IPCC AR4 Figure 9.1. Zonal mean atmospheric temperature change from 1890 to 1999 (°C per century) as simulated by the PCM model from [] (f) the sum of all forcings. Plot is from 1,000 hPa to 10 hPa (shown on left scale) and from 0 km to 30 km (shown on right).
The chart clearly shows that the tropical troposphere should warm more than the surface, and more than most of the rest of the troposphere except at the poles. In Karl Popper’s terms, that is a falsifiable prediction. If such a Hot Spot could not be found, then that should at the very least cause the whole man-made global warming hypothesis to be carefully re-evaluated, if not actually dismissed as falsified.
No-one ever found the Hot Spot. The mainstream climate scientists were understandably dismayed by the failure of the Hot Spot to appear, but instead of accepting that their hypothesis had been falsified, they carried on undeterred. And then this paper appeared – Sherwood et al (2008). After a quantity of very technical stuff, the paper contained this chart apparently showing the Hot Spot:

Figure 3.2. Chart from Sherwood et al (2008). Top row are observed temperature trends, bottom row are model hindcasts.
To a casual observer, the Hot Spot has been found, even though it is not quite as strong as the models’ hindcast, and the argument has at last been settled. But as Alec Rawls pointed out in 2010, the whole thing is a sham. If you look at the temperature scale, you will see that zero warming is coloured red. There is no Hot Spot. Jo Nova described it thus: “Sherwood[] changed the colour of “zero” to red to make it match the color the models were supposed to find. (Since when was red the color of no-warming? Sure you can do it, but it is deceptive.) That effort still remains one of the most egregious peer reviewed distortions of science I have ever seen.“.
This episode illustrates the following relevant features:
· Scientists can go to severe lengths to protect the current paradigm, including highly unscientific behaviour.
· Papers that support the current paradigm can pass peer-review no matter how bad they are. It would be easy to think that this paper was not truly reviewed at all (they went through the formal process, but that’s about all).
· It can take a long time to take down an established paradigm, no matter how good the contrary evidence is, and no matter how badly its proponents are shown to have behaved.
7. The Least Worst System
7.1 Democracy, anyone?
As I have illustrated above, the peer-review process is heavily flawed and open to abuse. But it might not be a good idea to blindly throw it out. After all, there might not be a better system.
In 1947, Winston Churchill famously said: “Democracy is the worst form of government, except for all those other forms that have been tried from time to time.“. Peer-Review might be like democracy in that respect.
Open review is now possible on the internet, and I hope it proves to be valuable, but once people work out how to abuse it successfully, it may turn out to be no better.
A concerted effort is needed in the scientific community, to try to eliminate the confirmation bias in the peer-review process that protects current paradigms.
7.2 Always ask: How can that be tested?
Science needs to get back to a culture of carefully and dispassionately testing everything – and then testing it again. In other words, bringing Karl Popper’s philosophy actively back into the mainstream. For every hypothesis, for every significant statement in every paper, the question needs to be asked “How can that be tested?“.
It would be easy to think, looking at how climate science has been conducted over the last few decades, that that question has never been asked. The IPCC has taken control of climate science. Its reports are produced by an internal committee, and are not subjected to any form of independent review. Many “findings” reported in “peer-reviewed” climate papers are based on the output of computer models, so the errors in the system are self-perpetuating. It seems that the idea of impending doom from CO2 went instantly from being a hypothesis to being blindly believed.
Whenever there is any kind of dispute in science, the scientific community needs to enforce an unbiased testing regime on the issue. ie, if rigorous tests are applied to a new proposed paradigm, it needs to be ensured that the current paradigm is being subjected to equally rigorous tests. It might also be useful if anyone putting forward any new hypothesis could also present with it suggested ways of testing it.
7.3 Testing my Hypothesis
I have put forward a new hypothesis of How Climate Works. For now, and for the sake of having a name that can be used to refer to it, I’ll call it the “Sun-Cloud-Ocean” hypothesis(“SCO”). It has no more weight than any other hypotheses. As with all hypotheses, it must be tested in every way possible. But I do ask that for every test of SCO, an equally searching test should be conducted on CAGW.
Fortunately, that isn’t all that difficult to arrange: The only tests that are useful to resolve the dispute between the two hypotheses are tests that can distinguish between them. Any such test, if conducted dispassionately and honestly, effectively becomes a test of both hypotheses.
NB. I have called SCO “my” hypothesis, because I am not aware of anyone having already proposed it. I do know that many parts of it have been proposed by others, but I have not come across the whole. If this hypothesis has in fact already been proposed by someone else, then I apologise and the hypothesis is theirs not mine. But everything I have said about it, and about testing it, still stands.
7.4 How can SCO be tested?
Like other elements of climate, testing SCO poses serious problems. SCO involves a lot of factors that are unknown or unpredictable:
· We don’t know which measures of solar activity to use – sunspots, TSI, UV, GCRs, etc.
· We can’t predict solar activity.
· We can’t predict ocean oscillations.
· We don’t have long term cloud data, in fact we have little suitable reliable data about anything from before the satellite era.
· The climate system is non-linear.
· Many elements of climate operate over long timescales.
· Virtually all factors in climate interact with each other.
In fact, once we start thinking about how climate hypotheses can be tested, it becomes clear just how little we do know about climate and its drivers.
Tests might include:
· Do clouds tend to change long term trend before temperature. In SCO they do, in CAGW they don’t.
· More testing for a sun-cloud-ocean link [though it’s hard to be specific in a non-linear system where the effect is minor in the short term]. In SCO there is a link, in CAGW there isn’t.
· It might be possible to predict different heat patterns in ocean currents for SCO and CAGW respectively.
· I think that in decadal+ periods of ocean cooling (warming) in SCO the tropical troposphere would cool (warm) more slowly than the upper ocean, although it might not be by a measurable amount. In CAGW I think it would warm faster in both phases.That would be worth thinking through carefully, and could then be tested if the global temperature started a definite trend again.
· I’m sure others could think of suitable tests – there should be many possible places to look at.
8. One size fits all.
Even if SCO gets confirmed by rigorous testing, don’t fall into the ‘One size fits all’ trap of getting carried away with one solution and expecting it to apply to everything.
At present, it seems that climate scientists see everything on all time scales as caused by CO2. Don’t make the same mistake with SCO. Check every situation carefully in its own right. For example, Milankovitch cycles might not have a sun-cloud-ocean effect on climate.
– – – – –
I hope you enjoyed this series of articles. I think that everything I say is correct, but I acknowledge that reliable long term data is in scant supply, and hence it is very difficult to be sure of anything. It will be necessary to ask “How can that be tested?” of everything I say.
Mike Jonas (MA Maths Oxford UK) retired some years ago after nearly 40 years in I.T.
Abbreviations
AMO – Atlantic Multidecadal Oscillation
APS – American Physical Society
AR4 – Fourth IPCC Report
AR5 – Fifth IPCC Report
C – Centigrade or Celsius
C-C – Clausius-Clapeyron relation
CAGW – Catastrophic Anthropogenic Global Warming
CO2 – Carbon Dioxide
ENSO – El Niño Southern Oscillation
EUV – Extreme Ultra-Violet
GCR Galactic Cosmic Ray
GHG – Greenhouse gas
IPCC – Intergovernmental Panel on Climate Change
IR – Infra-Red
ISCCP – International Satellite Cloud Climatology Project
ITO – Into The Ocean [Band of Wavelengths approx 200nm to 1000nm]
NCAR – (US) National Center for Atmospheric Research
nm – Nanometre
PDO – Pacific Decadal Oscillation
ppm – Parts Per Million
SCO – the Sun-Cloud-Ocean hypothesis
SW – Short Wave
THC – Thermohaline Circulation
TSI – Total Solar Irradiance
UAH – The University of Alabama in Huntsville
UV – Ultra-Violet
W/m2 or Wm-2 – Watts per Square Metre
Thank you Mike for quoting the APS resignation statement by Harold Lewis – it rings of integrity, which is a beautiful and rare quality in climate science:
Physicist Harold Lewis, in his letter of resignation to the APS, wrote
“It is of course, the global warming scam, with the (literally) trillions of dollars driving it, that has corrupted so many scientists, and has carried APS before it like a rogue wave. It is the greatest and most successful pseudoscientific fraud I have seen in my long life as a physicist. Anyone who has the faintest doubt that this is so should force himself to read the ClimateGate documents, which lay it bare. I don’t believe that any real physicist, nay scientist, can read that stuff without revulsion.”
The Earth’s crust is only 3 miles thick beneath the ocean ( a half hour jog! ).
The temperature of the crust at the surface is the same as the the average temperature of the air or the ocean above it.
That is to say 16 C. for land and say 4 C for the ocean.
71% of the Earth is covered by ocean with a heat capacity 12,000 times that of the atmosphere.
The temperature of the air and the ocean limit the cooling of the crust from the internal furnace at its core.
The ocean never gets below freezing directly above the earths crust as below 4 C. water is less dense and rises to the surface.
This limit to the cooling of the crust means that this 4 C. limit manifests itself as base temperature above freezing for most of the planet.
This means that evaporation can occur to cool the surface (i.e. to move heat from) and progressively warm the atmosphere by on average 3.4C/km when progressively condensing with increased altitude.
In reality the atmosphere is still cooler with increased altitude but less so than if the air were dry (by 3.4C/km). The actual lapse rate being 6.6C/km.
When air is moved up and down without any loss or gain of energy the temperature lapse on the up or regain on the down is equal at 10C/km both ways.
So when air is mixed by wind or turbulence that 3.4C/km potential extra energy is revealed by averaging out that extra latent heat.
So assuming a tropopause at 10km and a surface temperature above freezing this results in a potential temperature increase of 34C (10 X 3.4).
Averaged out by wind and turbulence to become an increase of 17C. at the surface.
Interesting!
Maybe the answer is blowing in the wind.
Regarding the “tropical hotspot”: It should be the result of warming due to any source. The claim that it’s the result of ghg driven warming (” it was identified in the fourth IPCC report as the principal place where man-made-CO2-driven warming originates”) is wrong.
It’s a simple misunderstanding of the gas laws. It’s not possible to have a ‘hot spot’. The atmosphere expands due to heat thereby increasing the volume – the net result being zero. The atmosphere is not in a closed container. Some people should get over it.
That’s true for fresh water. Unfortunately there is no fresh water in the ocean, and at typical marine salinity density of water is highest just above freezing (at -1.9°C).
The mention of democracy is quite ironic:
In 1947, Winston Churchill famously said: “Democracy is the worst form of government, except for all those other forms that have been tried from time to time.“.
Because in ancient Greece democracy meant a jury of ordinary people running each gov department. That is what they meant by “demos” (probably literally “yokel”) power. It had a very similar meaning to “delorocracy” (government by the deplorables). Now, I may be wrong, but not one government has tried what the Greeks meant by democracy in modern times.
Instead, what has happened is that “democracy” has had its meaning changed in order to suggest that what we have is democracy.
I didn’t really understand the “hot spot” argument until I came across this clarifying link:
http://www.elic.ucl.ac.be/textbook/chapter4_node7.html
Since the outgoing radiation to space has to remain constant without a change in input from the sun,
I think the model red hypothetical lapse rates in the diagrams should be adjusted from straight lines to curving lines, all nearly meeting the original blue line at the tropopause.
With negative feedback from clouds and surface convection, I suspect that the true model would be something line the “negatave lapse rate feedback” diagram, but with the red line curving to nearly meet the original blue line at the tropopause.
I am sorry but this has been one of the worst examples of technical writing I have read. It has not followed standard form for such an endeavor, and is entirely missing substance. If the writer proposes so many unknowns yet to be studied as necessary parts of his proposed mechanism (see the author’s list in this last post) then the entire tome should have been rejected for submission as being nothing more than a wild ass guess.
Kuhn and Popper are not incompatible.
Scientific progress is not smooth or linear. Popper describes the criteria of good science: Kuhn describes the nature of (necessary) scientific conservatism, and how change is ultimately achieved.
You should not think of science as in teh business of discovering truth.
All science is models. Popper says that a model should at least be disprovable by reference to the facts, and useful, and if it is those things but hasn’t been disproved, it’s a good model. Kuhn suggests that those facts are malleable, and that is almost metaphysics: models of a different class replace those of yesterday’s science. E.g. in the 20th Centrury the paradigms of space time matter energy and causality were shaken up badly by relativity, and almost completely destroyed by quantum physics. These were indeed paradigm shifts.
The world we look at through the equations of quantum physics bears almost no relation to the ordinary world of our senses and conceptions: William of Occam would have rejected it as containing far too many entities – quarks and mesons and gluons indeed! Only adherence to the necessity to model extremely recondite phenomena justifies its existence.
But Poppers rules still apply. If the model doesn’t predict what the data show happens, the model is not useful, and is bad science.
Remember all science is, is a collection of more or less successful models for predicting the future.
All Climate science is, these days is a collection of unsuccessful models…Its protagonists may still claim its a paradigm shift, but eny fule kno that. The trick it to make paradigm shifts able to produce better, not worse, models.
Mike – there is a problem with ‘either-or’ thinking……..there is little question the globe has warmed since, say, 1900. The IPCC itself and their suite of models say that prior to 1950, no CAGW effect is expected, and then that ‘most’ of the warming that followed is CAGW (meaning 51-99%).
The post-1950 warming period did not begin until 1975/1980 and occurred in what appear to be two steps, whilst also subject to the peaking of several multidecadal ocean oscillations – ie the release of heat into the atmosphere in quasi-cyclic episodes (eg PDO, AMO, AO) upon which ENSO was riding, with several ‘super-Ninos’ at roughly 10 year intervals. The amplitude of these oscillations is known, as is the background warming rate of the long ‘Bond’ cycle as it rises from the Little Ice Age.
One does not need an hypothesis on mechanisms until sufficient observational data can be used – some of which does exist but is not compiled. It is a relatively simple back-of-the-envelope calculation to add up the long-term LIA recovery rate (0.05/decade) and the peaking amplitude of the shorter term oscillations when they are in-phase.
Let us assume that the current annual average is 1 C above the 1900 baseline. Half of that occurred before 1950. From 1950-1975 ocean oscillations were negative (note: the hypothesis that this cool period was due to anthropogenic sulphur is not supported by evidence, nor that subsequent clean-air act programmes brightened the atmosphere and let more sunshine it – low-level releases of sulphur fall-out quickly and are local in effect – brightening occurred in unpolluted areas, and sulphur emissions worldwide did not decline by much).
During the 1983-2000 period, satellite data showed a steady 4% decline in low-level reflective cloud, meaning more sunlight reached the ocean and more energy was stored for future release (or taken deeper by downwelling). In 2001, cloud cover recovered by 2% and maintained that level to 2010 – the last data I saw. Surface insolation data measured in watts/square metre show two decades of 4 watts net anomaly – with a calculated 1 watt of extra infra-red from CO2.
Recent data have shown that IR radiation from CO2 contributes 0.2 watts/sq.m for about 20 mmpv increase of CO2. Between 1950-2000, CO2 concentration increased by about 100 ppmv – thus confirming the 1 watt figure.
On this simple basis, CO2 could have contributed at most 25% of the observed warming to 2000.
All that is needed to confirm this is a decent unbiased analysis of the surface insolation data and calculations of the expected oceanic heat input set against the observed rise in ocean heat content.
In 2008, Takmen Wong at NASA, stated that the issue was whether the reduced cloud cover could be a feedback from CO2 – ie whether it caused the warming, or whether it was a consequence. The fact that cloud cover stabilised when CO2 levels continued to rise supports the view that cloud cover is not a feedback to CO2.
Another element, seldom discussed, is that the team that finally measured spectrally resolved CO2 derived wattage at the surface, at 0.2 watts/20ppmv over a ten year period, also reported a 10x greater rate of increase of water vapour derived Infra-red….at 2 watts over ten years. There is little discussion of this data – perhaps because even the most excessive CAGW model uses only a 3x feedback to amplify the CO2 effect. So that extra wattage is largely natural and most likely linked to the ocean oscillations. Cloud and water vapour responses to whatever drives the oscillations are the penultimate causal factors.
As for the amplitudinal effects: from 1950-2000, we have 5x 0.05 which gives us 0.25 expected from background natural warming due to the ‘Bond’ cycle. Leaving 0.25 to be accounted for by the mix of CO2 and the in-phase combination of the AMO/PDO/AO. I would say that 0.2 C globally was a reasonable figure for these combined effects. That does not leave much for CO2! Even if we assume that the effects of these oscillations has diminished, there is no hard evidence that ‘most’ of the observed warming is down to CAGW.
It would not be so easy to construct an hypothesis to delineate the respective contributions until such time as more accurate data is available – specifically, time-series for cloud cover, wattages on the ground, and their relation to observed indices of the PDO/AMO/ENSO. I am sure that data exists in some form but the right people are not working on it!
The tropical hotspot is certainly not missing. It can be found in all radiosonde datasets, more or less pronounced, if one looks over a period with global warming. The observed hotspots are less protruding than the model average hotspot, and lower in altitude. Here is a tiny one in Ratpac A, the last twenty years, nino to nino peak. Red curves for the tropics:
http://postmyimage.com/img2/845_RecentRatpacvs_CMIP5.png
Satellite data/datasets have poor vertical resolution, and have historically not been able to demonstrate any hotspots. However, that may be different nowadays with the AMSU instruments scanning four or five different layers of the troposphere.
Actually, the new UAH v6 dataset shows a mighty hotspot in the upper troposphere in the AMSU-era, and this only by combining the classical three channels (and not the new AMSU-channels in between):
http://postmyimage.com/img2/441_UAH_hotspot.png
“NB. I have called SCO “my” hypothesis, because I am not aware of anyone having already proposed it. I do know that many parts of it have been proposed by others, but I have not come across the whole. If this hypothesis has in fact already been proposed by someone else, then I apologise and the hypothesis is theirs not mine.”
See here:
http://www.newclimatemodel.com/new-climate-model/
“The SUN causes latitudinal climate zone shifting with changes in the degree of jetstream zonality / meridionality by altering the ozone creation / destruction balance differentially at different height above the tropopause. The net result is a change in the gradient of tropopause height between equator (relatively high) and poles (relatively low).
The cause appears not to be raw solar power output (TSI) which varies too little but instead, the precise mix of particles and wavelengths from the sun which varies more greatly and affects ozone amounts above the tropopause.
That allows latitudinal sliding of the jets and climate zones below the tropopause leading to changes in global CLOUDINESS and albedo which alters the amount of energy getting into the OCEANS.”
Various versions exist from around 2010 onwards.
As for testing, I have suggested creating some form of measure of jet stream meridionality / zonality.
Climate doesn’t “work” – it just happens.
The problem here is that even when a hypothesis is falsified, its followers keep believing in it.
Your SCO has been falsified, yet you still cling to it.
Since 1975 solar activity has been declining, thus cosmic rays have been increasing, hence cloud cover should have been increasing, hence temperatures should have been decreasing, yet they have increased [which can be taken as an argument for AGW].
Similarly, there has been no long-term trend in solar activity the last 300 years, yet there seems to be one [upwards] in temperatures. So, by the usual standard of science, SCO has been falsified.
At present, it seems that climate scientists see everything on all time scales as caused by CO2. Don’t make the same mistake with SCO. Check every situation carefully in its own right.
For example, Milankovitch cycles might not have a sun-cloud-ocean effect on climate.
_______________________________________
There’s no need for Milankovitch cycles to have a sun-cloud-ocean effect on climate –
as long as the sun-cloud-ocean effect on climate
works over time.
….· Scientists can go to severe lengths to protect the current paradigm, including highly unscientific behaviour.
· Papers that support the current paradigm can pass peer-review no matter how bad they are. It would be easy to think that this paper was not truly reviewed at all (they went through the formal process, but that’s about all).
· It can take a long time to take down an established paradigm, no matter how good the contrary evidence is, and no matter how badly its proponents are shown to have behaved…
People will tell you that, in fact, supporting an incorrect paradigm for any length of time is unusual. Don’t believe them. Aristotle’s Physics was accepted and supported for many hundred years. The Phlogiston Theory similarly held sway for a long time. The Heliocentric Theory is another example, as, indeed, is Quantum Mechanics. Kuhn’s description of science is the rule rather than the exception…
Smoking Gun #19: The Equatorial Upper Tropospheric “Hot Spot” simply doesn’t exist. ?w=840
https://co2islife.wordpress.com/2017/01/17/climate-science-on-trial-the-forensic-files-exhibit-s/
“Sun-Cloud-Ocean” hypothesis? Verified? Well, at least heavily substantiated: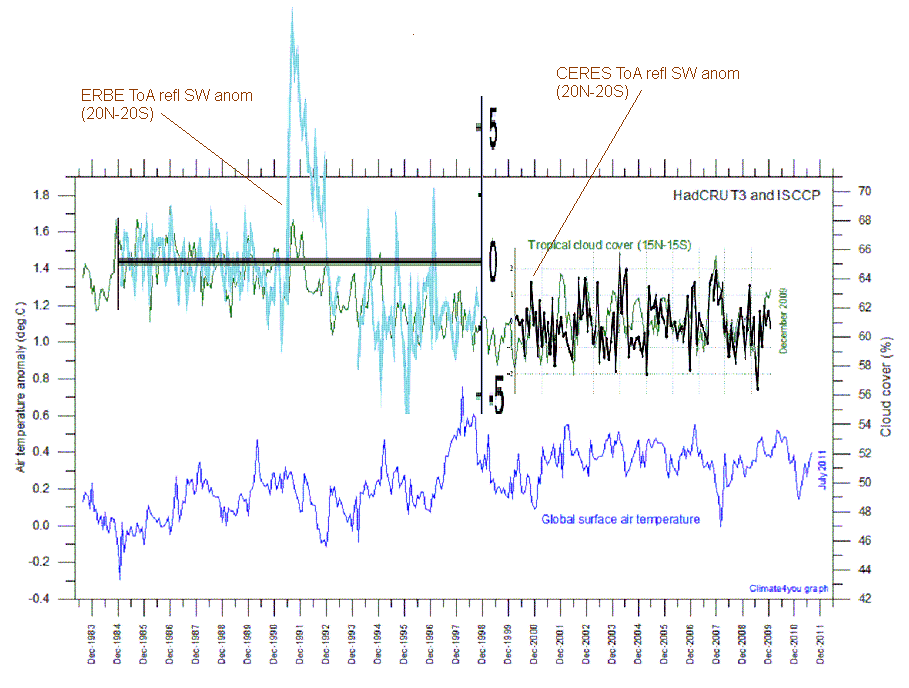
Having now read all three parts some feedback. The ‘SCO’ model of part one is oversimplified, and over reliant on ‘delta sun’. CO2 is a greenhouse gas. It should have some effect. The issue is feedbacks, and sorting the net away from the obvious natural variations that occur. That those appear ocean driven is plausible but unproven. Part 2 I agree with, not only because of the initial consitions problem illustrated by the 40 NCAR runs. Computational intractability forces parameterization. Thos have to be tuned to properly hindcast, and that brings in the attribution problem in the warming period ~1975-2000. Part 3 has two parts. The missing tropical troposphere hot spot is a climate models problem, not a climate problem. The essence of whether there is a C in CAGW depends on two things. 1. The definition of C. What we have is speculation based on faulty modles–or worse, irrationally ‘justified’ by the precautionary principle. For sure some definitions of C have already been falsified. Polar bears, for example, don’t depend on summer ice and nobody can credibly suggest winter ice won’t form for the bears to hunt seal pups in the spring. As another example,oceans are highly buffered and the natural biological variation in pH far exceeds what added dissolved CO2 might do. 2. The amount of AGW, which we dunno because of the attribution problem, for which there is no solution for at least another 30 years of data collection.
“All science is models”
I have read here quite often the inference that science starts with an idea, that is followed by a hypothesis that is then investigated through experiment and observation. I beg to differ.
A great chunk of science is driven by intrigue with observation and a search for truth. There is no preconceived idea in many cases, just a love for the discipline field. In my own field, geology we often just observe, measure, report. For many of us this is enough.
In this approach the only danger lies in the conclusions. As long the observations and statistical principles are robust and the work is thoroughly peer reviewed it is the best we can do.
Start with a hypothesis that one sets out to prove or disprove – then an incentive comes into play. If there are grants involved the incentive is even larger. The rapid rise in this approach is (IMO) driven by: “What can I do that will make me famous without my having to leave the office?” A love for the science topic is absent.
Nevertheless, I maintain that most scientific advancement has been driven by the search for truth. My experience is that most thesis supervisors are passionate in a particular field and pursue science for science’ sake. They seek out undergrads to help them in their work. Sure, they like to publish but they mostly simply want to be very good in their field.
This is how it really works (mostly)
I would suggest that the simplest and most expedient way to get a handle on this, is to select a dozen or so pristine stations (pristine siting, no station moves, no encroachment by urbanisation, or change of land use, the best systems of practice in and about observations, record keeping, data quality etc), in a dozen countries across the Northern Hemisphere and then retrofit these with the same type of LIG thermometers that were used in the 1930s/1940s (calibrated if appropriate in Fahrenheit) and then observe in accordance with the same practices and procedures as used by the individual station in question as used by that station in the 1930s/1940s (eg., use the same TOB as used by that station)
We would then have the original 1930/1940 raw data, and we could then compare it with raw data collected over the next few years (one complete ENSO) cycle. No adjustments whatsoever to raw data, no attempt to make a Northern Hemisphere wide assessment.
Just look at each station, individually, one by one, and see how each has changed from the highs of the late 1930s/early 1940s.
We would soon have a good feel for what changes have taken place, and whilst any change could be of natural origin, it would cover a period when some 95% of all manmade Co2 emissions has taken place.
Given that CO2 is a well mixed gas (at any rate for the purposes of the theory), one does not need thousands of measurements. CO2 does not change its characteristics and operate in a different fashion say over the US than it does say over Hungary. Subject to any changes in relative humidity, at the chosen stations, we would have a very good handle on this even with just a 100 stations.
What one needs is quality data from quality sources. Our problem is that we are trying, by way of adjustments and homenisation, to make a silk purse out of a sow’s ear; it cannot be done.
Science is all about experimentation and observation. There must be some really good quality data for the 1930s/1940s out there, let us replicate it by carrying out the experiment, ie., making observations using the same equipment and using the same methodology, standards, practices and procedures.
“making observations using the same equipment and using the same methodology, standards, practices and procedures”.
Yep – and throw in some modern devices alongside. Anyone know of a billionaire that will fund a search for truth?
Ya know, if this topic was on the futures market oh how different things would be!
“Unfortunately, a culture of gate-keeping has prevailed within science for a long time, whereby a current paradigm is tenaciously defended in the face of contrary evidence until its defenders’ position becomes politically untenable”
Some one has wisely said that it mostly happens when the defenders die.
These disputes are as old as science.
When all your work, research and reputation suddenly seems to be based on a wrong theory, most peoble try to defend that theory.
I feel that it requires a few more courageous souls in the entrenched system to voice their reservations. Once the flood gate begins to open there could be a torrent. I cannot believe that there is not some real concern within the institutions. It most bubble out sooner or later