We covered another press release on this subject December 20th, and I normally wouldn’t repeat it, but they have a new map that’s worth looking at because it bolsters the claim I made then that the issue is more about political bent and media reporting in highly democratic voter states than it is about experience with weather.
From Boston University.
By Caitlin Bird
In early 2014, freezing air from the polar vortex at the North Pole swept into the United States. The resulting record cold temperatures and snowfall grounded planes, knocked out power, and caused unusual weather across the country. Even states with normally balmy weather, like Georgia and Louisiana, saw freezing rain and declared states of emergency to get through the storms.

But the weather doesn’t have to be that extreme to leave a mark. In a study published in the Proceedings of the National Academy of Sciences in December 2016, scientists have found that experiencing record high or low temperatures affects people’s stated belief in climate change. The study was funded by the Robertson Foundation and the British Academy.

Robert Kaufmann, Boston University professor of Earth and environment, is lead author of the study. The research began when he and PhD candidate Xiaojing Tang (GRS’12,’17) wanted to develop a new measure of local climate change based on record high and low temperatures in the US. This index, called TMax, rises as the number of recent record high temperatures increases relative to the number of recent record low temperatures. After Tang calculated TMax using data from weather stations across the United States, he presented a map to Kaufmann, who was surprised to see a pattern.
“It clicked in my mind,” says Kaufmann. “It looked like where people do and do not believe in climate change.” Specifically, Tang’s map of TMax resembled maps that climate change researcher and study coauthor Peter Howe, assistant professor of environment and society at Utah State University, had compiled showing the percentage of state and county residents who, in 2013, answered yes to the question: “Is global warming happening?”
The climate picture is complicated because the US is both warming and cooling. If climate in the country remained stable, only about 5 percent of weather stations would, simply by chance, show local warming or cooling. Instead, Kaufmann and his team saw that nearly 50 percent of weather stations had high values for TMax, indicating local warming over time. Unexpectedly, about 10 percent of weather stations showed local cooling, with more frequent recent record cold temperatures. Looking at the map, warming areas are located at the coasts, cooling areas in the middle of the country, near the Ohio and Mississippi rivers.
When Kaufmann and his collaborators compared the map of TMax directly to Howe’s, they found a correlation: in counties where recent weather was dominated by record low temperatures, a smaller percentage of people were likely to agree that global warming was happening.

Why might this be? Study coauthor Jacqueline Liederman, BU professor of psychological and brain sciences and director of the University’s Cognitive Neurophysiology Lab, believes it’s because humans are prone to learn from their own experiences. What they hear from leading scientists doesn’t dissuade them from what they see for themselves. “We know people have certain biases,” says Liederman. One of these biases is something called “recency weighting,” the tendency for people to assign more value to events that have happened recently, even if they don’t fit a long pattern over time. This was especially true for counties that experienced recent low temperatures. Even if the data showed that record high temperatures were more recent over the past 30 to 50 years, people in counties where there had been many record lows since 2005 were more skeptical of global warming.
Liederman explains that the research also reflected an effect called “confirmation bias.” Essentially, it isn’t easy for anyone to accept information that goes against entrenched beliefs, so conflicting evidence is ignored. The effect of confirmation bias was one-sided in the study, found only in areas where there were recent cold temperatures. If you are more likely to trust your personal experience, and it’s been cold recently, you can discount a rogue record high temperature as just a hot day, rather than evidence of global warming.
Areas with more record low temperatures tended to be in traditionally conservative areas of the country, counties where belief in global warming was already low. Climate change is a politically charged topic in the United States and stark divisions exist along party lines regarding how serious the problem is and what the consequences will be, according to the Pew Research Center. But Kaufmann’s study found that local climate affected people’s willingness to believe in global warming beyond what party affiliation would suggest.
Kaufmann’s group is planning a future project to better determine whether political allegiances affect how people learn from experience. In the meantime, he hopes that what he and his colleagues have learned from this study will help change the way that scientists communicate with the public about climate change. “I think climate scientists have to step back and rethink…and use very different sorts of evidence to convince people that climate change is real,” he says.
###
The paper: http://dx.doi.org/10.1073/pnas.1607032113
Have a look at the map included with this press release:
Now, if you imagine reversing the colors, so that the map looks like the traditional red/blue Republican/Democratic states, it is easy to see the “leftcoast” of CA, OR, WA, and some other left-leaning hotspots, such as Austin, Minneapolis, Chicago, Washington, DC, Miami, and the traditionally democratic voting NE USA states, NY, VT, NH, CT, RI, MA, ME.
I made the same comparison before in commenting on the previous press release:
Personallly, this study looks more like a political bias coupled with a media reporting bias (left-leaning counties tend to have left leaning newspapers that will report the talking point belief of weather is a symptom of climate change) than it is anything else..
Kaufmann notes in the BU PR:
Kaufmann’s group is planning a future project to better determine whether political allegiances affect how people learn from experience.
I think he should have done that first, because that’s just good science, to weed out anything that biases the study. As it stands, I don’t think much of this study, and I’m not the only one:
Dr Richard Tol notes in comments:
The problems with this paper are more fundamental than Anthony suggests.
Kaufmann et al. extensively discuss their right-hand variable of interest, temperature, but they are almost completely silent about the left-hand side, belief. This variable is taken from an earlier paper by Howe et al. It is based on 12 nationally representative samples of about 1,000 observations each. The samples are for different years, of course, something that Kaufmann and co overlook. More seriously, there are 3,000 counties in the USA, so that a 1,000 strong sample will leave many counties unobserved. Howe et al. interpolate their data to obtain coverage for all counties. Kaufmann et al. do the same: They interpolate weather station data to counties.
In the end, therefore, Kaufmann regresses imputed, spatial data on imputed, spatial data. Chances are they found that the spatial imputation schemes are similar.
Rud Istvan adds to Tol’s comment:
My degee in econometrics taught that when you regress madeup data on madeup data, the result is highly statistically likely to be made up, err… imputated. Nice catch in the junk methodology.
Yep, “junk methodology”. Looks like fodder for Retraction Watch.
RomanM, a statistician, comments and does his own analysis:
Richard is correct on the fact that the belief data comes from the Howe paper that he refers to. If anyone wishes to look further at this aspect, the paper can be found at http://www.nature.com/nclimate/journal/v5/n6/full/nclimate2583.html
Although the paper itself is behind a paywall, the Supplementary material provides good information along with Excel files containing their results not only for the question of whether it is warming but also for a number of questions including whether humans are causing it, scientific consensus, etc. A pre-publication working copy of the paper itself is available at http://papers.ssrn.com/abstract=2515649
The ‘global warming question as used in Howe et al reads:
Question: Recently, you may have noticed that global warming has been getting some attention in the news. Global warming refers to the idea that the world‘s average temperature has been increasing over the past 150 years, may be increasing more in the future, and that the world‘s climate may change as a result. What do you think: Do you think that global warming is happening?
[Response Scale: Yes, No, Don’t Know]
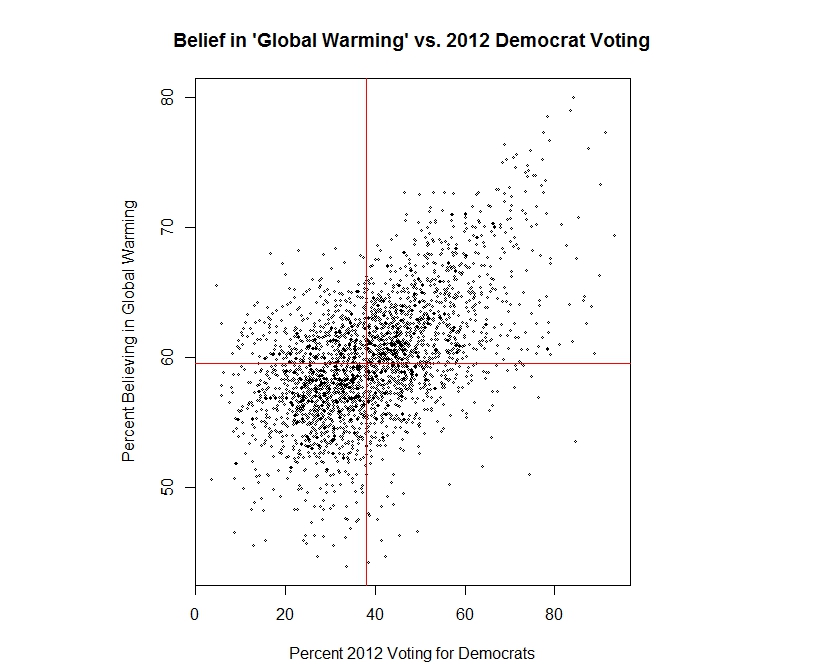
Here is how the cobbled-up beliefs by county fare against the vote for Obama in 2012 (red lines are placed at the medians of the two variables):
https://statpad.files.wordpress.com/2016/12/gwarm_demvote.jpeg
But Kaufmann got his headlines. Anyone care to bet his followup study on political bias won’t happen?
And a personal note, Dr. Kaufmann left a comment on the previous thread that was pretty ugly, and I snipped it it because, well, it played that stupid “smoking causes cancer denial” that the left likes to hurl in the context of climate change, he didn’t give his full name, which is typical for people that throw insults. The email address he used and the IP address check out as being from bu.edu You’d think Kaufmann would stand behind his own words.
In retrospect, I should have let it stand to demonstrate how petty he is. Based on the stat experts that commented, plus my observation of the maps, I think it is safe to say that the Kaufmann study is little more than a statistical mishmash using some very bad assumptions. It should probably be retracted.
You can base your beliefs on the “three blind men and an elephant” parable or you can look through the tattered client science research and temperature history to see if we are warming, cooling, stable or we just can’t figure it out just yet.
rbabcock
Thanks.
I note that you – like me – concede at least a possibility of “we just can’t figure it out just yet.”
Frankly, given the number of variables, I think you are, unquestionably, right.
Straight down the line.
There are a lot of things out there that may – MAY – affect climate (AND weather).
We probably do not have a full list of the factors.
And, even those we can list may not be fully understood. Like, say, CO2 . . . . .
Auto
Yes, but does huffing car exhaust (CO2) cause the belief in global warming?
Don’t know, but it can sure cause you to get a concentrated does of carbon.
And a bad case of CO
You could retain it on this site as an exemplum horrendum, to show that such reasoning from such data actually does exist and has made it into print, in spite of all the reasons not to permit that to happen.
If this paper didn’t address the political angle, then all we have is correlation and not causation. In other words, the paper is incomplete; the conclusion not justified.
dgp
No, but does huffing car exhaust (CO) cause the end of times, for those who partake.
With modern computer controlled fuel injected engines, the CO output is almost negligible. The last emissions test for my V8 SUV showed CO below detectable levels.
Detectable with what?
– A Lab Rat in Waterloo
That’s the rats way of life –
When the first rat lives through the 1st 24 hours the food source is good for the hole bunch.
To have something “click in” your mind seems to be the mantra for theory development these days. “I think so it must be so.”
There’s a good, brief, book by Richard Baggozi, titled Causal Models in Marketing. It’s aimed at anyone who works with social science data, including geo-spatial data. It provides a brief discussion of the different notions of validity, covers measurement, and then talks about structure of path models to test for validity and causality. Implicitly it would be brutally dismissive of anyone who approaches a topic as “it just clicked in my mind.”
I happen to have a couple extra copies, since I’ve been drunk with the author, and he’s very generous with his publisher’s money when he’s in a good mood. I thought I’d send a copy to Kaufman, but then started to believe that the subject matter is beyond his grasp, so maybe I’ll give the extra copy to my 8 year old neighbor who believes that Bill Nye is just a nerd who does crappy experiments.
Happy Holidays everyone, I’m off to build snow forts with a bunch of kids …
Mark
Enjoy.
Not to o o o o o much beer with the forts, and then back for dinner.
Auto
I guess you are outside the High Atlas featured earlier.
But – do enjoy the kids. Giggling is infectious.
I had it on a bus to London Bridge tonight – and several of us guffawed!
I think there is more support from the data that belief in global warming causes bias errors in the recording and treatment of the temperature data itself. Look that the state borders of Colorado and New York, for example, why do man-made boundaries have a significant effect on the temperature data?
“Why might this be? Study coauthor Jacqueline Liederman, BU professor of psychological and brain sciences and director of the University’s Cognitive Neurophysiology Lab, believes it’s because humans are prone to learn from their own experiences.”
Exactly right.We have experienced the coastal “elites” lying to us over and over.
And why shouldn’t “humans” “learn from their own experiences”??? I think the author should have proofread her remarks a little more carefully before publishing this. Or is this the signal that a new kind of medievalism is taking over: our authority over your experience?
Who are you going to believe, me or your lying eyes?
I noticed that too. The authors virtually said: Don’t trust your own experience with the weather/climate. We’re scientists and our computer models know better.
It appears to me that the high number of occurrences of the word “belief” in this paper would make it more suitable for a philosophy, psychology or religious publication.
Believe in Lobal Warming corresponds to liberal population centers.
Need I add… “From the department of Duh!”
Belief… darned autocorrect.
wallensworth
Thanks.
It is belief, pure and simple. No need for science/facts/data.
Again, may be fun – but no facts.
Auto
Oh Yeah, lobal warming from the ‘self thinking forbidden syndrome’:
https://www.google.at/search?client=ms-android-samsung&biw=360&bih=264&ei=o6pcWPDxCcGYgAbW7aTYBw&q=frontal+lobe+damage+&oq=frontal+lobe+damage
Kaufmann has a politically correct position as Professor of Earth and the Environment, which sounds like a sop to pressure groups and/or funders. Why should he not produce something as fundamentally politically correct (and silly) as this study, or my all time favorite, “feminist glaciology”?
The places with the most warming are, by and large, urban due to UHI. Similarly, the places with cooling or no warming tend to be rural.
The places with the most left-wing voters tend to be urban. The places with the most right-wing voters tend to be rural.
We have a spurious correlation between climate and political alignment. The paper is garbage. The warming due to UHI isn’t really enough to notice. Democrats have a well known bias to AGW. That’s what Kaufmann is seeing.
I’m surprised by the “climate change/global warming” results, actually. As a skeptic on AGW/CAGW, I would still have answered the question in Howe, et al in the affirmative. Basically it doesn’t even demand attribution to mankind driving the warming, and only says it “might” continue in the future and “may” cause the climate to change. I can’t think of a more simplistic question designed to elicit a positive response, as it only covers one of the three tenets (is warming, is man-caused, is dangerous).
Looks like a strawman to me, and even so they get widely differing answers. Wonder what the scatter plot would have looked like if they had asked the CAGW question?
Spot on. I can only see myself answering a stupid question like that with questions of my own. “What do you mean by “global warming?” (follow up – “Do you mean human-caused warming?”) would be the first question. Any meaningful answer would come only after the question was sufficiently clear, since I don’t like having words shoved into my mouth.
I can’t tell from the map but demographics plays a really big part. Basically if you are over about 45 you have sufficient memory experience to know that the AGW claims are rubbish. Further you have been through an education system that hadn’t been infiltrated by the AGW mantra.Even in areas that voted republican , the academic institutions and the towns that surround them would be AGW islands. The indoctrination of a generation of students is the biggest hurdle that the climate realists have to overcome.
David S, you hit the nail on the head, It is really hard to listen to the rubbish that my grand children are being taught. We happen to visit them (they live a long way away so we sadly only see them once or twice a year) and the school work we read through was appaling.
Amen (born 1951). I live in the Puget Sound area of Washington state, and to represent that region as being anomalously warm is just laughable. The only aspect that might align is the apparent fact that our winters are less bitter in recent decades (somewhat less freezing and snow), but this could still be an artifact of Urban Heat Island effect.
The reduced snowfall in the Cascades has nothing to do w UHI. And for UHI to be the cause of warmer winters seems highly unlikely given the very low insolation received in the Puget Sound area in the wintertime.
looks to me more like an urban vs rural thing.
if you live in a city of 1M souls, you have pollution, crime and traffic in your face every day and crave the nanny to do something while you tell yourself that sacrifice = civilization.
if you aren’t armpit deep in people you don’t want to know, you haven’t got those problems.
was the data used to calculate the temperature factors based upon the Raw Data recorded at the weather stations or was it based upon the Adjusted (Karlized) data??
____________________________________________
Why ask – Kaufmann’s group can do with ANY data.
In agreement with Dr Richard Tol, who said it much more technically and completely than I ever could, I think (as I commented in the other post on this subject) that the study is shallow, because it does not go deep enough in how people form beliefs about their perceptions of local weather.
If you experience cold weather day after day, and a convincing enough story comes your way day after day saying it’s because of global warming, then you CAN believe that cold means warming.
Unless researchers have a way of gauging HOW people arrive at their judgements (e.g., political leaning, news-media leaning), you have only half an explanation in an incomplete study at best.
It leads me to wonder based on this,
was the data used to calculate the temperature factors based upon the Raw Data recorded at the weather stations or was it based upon the Adjusted (Karlized) data??
The problem with the atheists / believers is, you do not know whether your priest is in a religious crisis while doing the Morning Devotion.
Perhaps he was already appealing for a transfer to a lonesome mountain village.
The citation for the temperature data is from NOAA – I haven’t yet checked, but I strongly suspect they used adjusted data. (How else could they claim that the scientific evidence for warming is “overwhelming”?)
Another strange thing about their map is that, while mirroring political differences, it doesn’t reflect the basic pattern of differences between the part of the country east of the Rockies and the part on the west side. From my limited reading, going back to Rosvold’s 1952 article on the then recent cooling trend, this is the basic distinction when it comes to climate change in the US. Yet in Kaufmann et al’s map, the northeast and the tip of Florida are both red in contrast to the rest of the eastern US.
“I think climate scientists have to step back and rethink…and use very different sorts of evidence to convince people that climate change is real,” he says.
“rethink” as in send more money please.
goes hand in hand with the sanctuary city/county map…..
http://cis.org/sites/cis.org/files/Sanctuary-Cities-Map.png
Aha, here’s another paper waiting to be written! From the looks of it there’s an almost perfect correlation.
Article: “Robert Kaufmann, BU professor of Earth and environment, has shown that local high and low temperatures can influence whether people in the United States believe in global warming. Recent record low temperatures were especially powerful in promoting climate change skepticism.”
I live in one of the hottest parts of the United States and have been a skeptic of human-caused global warming/climate change since the time the switched from global cooling to global warming. The transient weather at my place had nothing to do with it.
Article: “Liederman explains that the research also reflected an effect called “confirmation bias.” Essentially, it isn’t easy for anyone to accept information that goes against entrenched beliefs, so conflicting evidence is ignored.”
Yeah, well, in the case of CAGW there is no conflicting evidence to ignore. The lack of evidence is the problem skeptics have with the CAGW speculation.
This is about as unconvincing a study as any I have seen in a long time.
So many of these sniffy holier-than-thou pronouncements could be as easily applied to the other side, and more often than not, arguably are MORE applicable to the other side. Confirmation bias works both ways, basing ideas on own experiences works both ways…
The definition of confirmation bias used here looks *amazingly* like rational update of beliefs using Bayes’ Rule https://en.wikipedia.org/wiki/Bayesian_inference If you have sufficient evidence for your beliefs, it is irrational to let them be overthrown easily. These people are putting a really *creepy* weight on the Argument from Authority.
Agreed. My skepticism has nothing to do with local weather, and everything to do with the complete lack of any hard science to back up the ridiculous notion of “CO2 drives temperature,” and in particular, “CO2 drives catastrophic increases in temperature,” along with “human fossil fuel burning related CO2 emissions (which are a pittance compared with natural CO2 emissions) drive temperature/drive catastrophic increases in temperature.” Until they have any actual scientific proof, it’s just hypothetical BS.
To me, this map is just crazy. Global Warming would appear to respect City Limits and State Lines.
Kaufmann looks at this map and concludes that amount of warming determines belief in warming. But that doesn’t explain why it follows already existent political bounders.
I look at this map and conclude that the Political Control of an area determines how much global warming is ‘measured’ there.
“Global Warming would appear to respect City Limits and State Lines.”
More importantly, this study shows that homogenization is an invalid approach if parts of the country are warming (more record high temp) while others are cooling (more record cold) which seems to be the conclusion (or preconception?) of Kaufmann’s study. Homogenization assumes trends track over large geographic areas. Since that doesn’t seem to be the case, you can bias site selection one way or another and achieve any trend in any direction that you want.
It’s the scientists whose beliefs are influenced by weather and climate, as seen by the cold scare of the 70’s. Arrhenius and Callendar were exceptional by modern standards in that they thought CO2 warming would be a wonderful thing (as did Roger Revelle according to Arrhenius’s grandson). Singer, on the other hand, was concerned about warming back in 1960 when most were beginning to worry about the cold, and most thought petroleum would run out within a few decades. The wells did not run dry, the grand experiment went on, and the majority of the warming remained in the minds of the modelers. –AGF
http://www.governing.com/gov-data/food-stamp-snap-benefits-enrollment-participation-totals-map.html
https://www.google.at/search?q=percentage+of+people+on+welfare+by+county%2C+graphics&oq=percentage+of+people+on+welfare+by+county%2C+graphics&aqs=chrome
I would like to make a map showing a percentage of people on welfare by county, but I don’t know how.
This is similar to saying that AGW is caused by the invention of the jet engine. Not because of the CO2 output, but because of the UHI effect surrounding airports. Airports have long been the official air temperature of cities large enough to have international airports. Since the invention of the jet engine, air travel has increased along with the larger runways, taxiways, terminals, baggage handling faculties, parking lots, and expressways feeding vehicles into the area. It seems obvious that this would increase the local readings, to push several warm but not record days, into record territory. Those same areas have local news coverage that tends to cover the record temps, but not give the same coverage to cooler than average temps. There you have it. Localized UHI, and the propaganda machine to sell it as the “hottest evah!!”
Interesting. So, perhaps we might learn something by comparing nationwide large airport temps on/around 9/11, when the jets were grounded.
Well, Tucson certainly had a quite coincidental cold front move in – and stick around for several days. Officially, that is…
That time nearly drove me nuts – when you live next to an air base, you become adapted to the normal sounds. (Davis-Monthan AFB is a tactical training base – and those aircraft were grounded, too. I think the only “active” AFBs were those that had interceptor wings assigned.)
Yes, Steve.
The answer roots in
https://www.google.at/search?q=Reagan+flight+controls+tower+staff&oq=Reagan+flight+controls+tower+staff&aqs=chrome
Eh?
Writing Observer, the question was
Steve Fraser on December 22, 2016 at 2:14 pm
Interesting. So, perhaps we might learn something by comparing nationwide large airport temps on/around 9/11, when the jets were grounded.
What part of my answere You don’t understand :
Johann Wundersamer on December 22, 2016 at 11:54 pm
Yes, Steve.
The answer roots in
https://www.google.at/search?q=Reagan+flight+controls+tower+staff&oq=Reagan+flight+controls+tower+staff&aqs=chrome
I see Your Problem, Writing Observer:
You leave it to the Federals.
To the federal Marshalls trained in Israel.
America You’ve got it better.
Cheers – Hans
That was a beautiful day in history.
Agreed. It’s a map of UHI with liberals living in cites where the greatest amount of UHI is experienced. It is also a map of where the most recent drought was experienced (California) Texas had a drought a few years ago and already that has been forgotten with the recent rainy period and cooler weather.
Yup, both “warming” and “record high temperatures” have lots to do with where you put the thermometers, and/or how the locations of the thermometers change over time. Increased urbanization and population, with its related increases in traffic, increases in buildings with their HVAC equipment, increases in areas covered in concrete and asphalt, and the aforementioned increases in idling and take-off blasting jet engines (especially since airports seem to be such popular places for thermometers these days), have more to do with the “warming” and “record highs” than actual changes to the climate do.
Climate begats weather. Would somebody PLEASE smack these stupid c**ts in their s**t filled heads! PLEASE!!!!!!!
Consistent weather and trends produce climate . Many situations can produce weather which is out of the ordinary for that location, it does not mean that is the climate. Siberia can experience temperatures in the 30c range. But it is not a tropical climate. It can snow in Florida, but it is not Alpine or Tundra.
Climate begats weather, stupid. Figure it out. Oh, yea, you believe the stupidity spewed by fakenews-R-us, never mind.
Been thinking about this global warming narrative … what is a narrative other than a politically charged story stitched together lies of omission, exaggerations, half truths, etc to put the story in the best possible light. A narrative is basically a lie. Another narrative recently in play is the ridiculous Russians hacking the election narrative … the liberals seem to mostly believe it while the conservatives mostly dismiss it. The “do you believe the russians hacked the election” map is probably the same as the “do you believe in global warmjng map”. Neither really has direct access to the truth, but somehow they still made up their minds. Bottom line, conservative or liberals, we’ve all seen enough narratives to know when a narrative is in play. Liberals mostly believe liberal narratives because it is painful to reject it (it opens the liberal up to ridicule), conservatives mostly reject liberal narratives because the liberal narrative is always wrong (because of the lies required to stitch a narrative together)..
Scott, it seems there has been solid evidence since July that the Russians hacked DNC, and tried but failed to hack RNC. But Wikileaks has been clear (both Assange and the operative who flew to Washington DC to get the leaked emails from an intermidiary for the leaker inside DNC) that the Podesta emails were leaked from inside, not hacked. Both things are perfectly compatible with truth. You don’t leak hacked espionage. Defeats the purpose of espionage. Russians probably were looking for stuff to ‘blackmail’ pay-for-play Clinton since everybody ‘knew’ she would win the election. That is, until deplorables actually voted. The logic mistake is Hillary claiming the Russians leaked their hack to help Trump so she unfairly lost.
Defintitely, and the DNC emails read like the product of a Berniebot or someone annoyed with Podesta and friends, not someone finding salacious stories or evidence of corruption.
it seems? what solid evidence?
and anyway, it doesn’t matter a bit how the emails got out.
the problem was not the messenger.
“the problem was not the messenger.”
That’s right. That’s what the Dems always do: Blame the Messenger.
Hillary was the status quo and Flyover Country didn’t want the status quo anymore.
The term “confounding variables” is not specifically mentioned in the Kaufmann et al paper although they claim in the Supplementary document that they somewhat address this issue in a statistical way:
Here, %Beliefc is the percentage in the county accepting “global warming”, %Votec is explained above and TMaxc is “an index that accurately measures local changes in climate based on the number of days per year for which the year of the record high temperature is more recent than the year of the record low temperature”. μc is the usual “error term” in the regression. [Note that in the paper, the “c” on each of these is shown as a subscript indicating the specific county from which the data is taken.]
The problem is that this is not the correct way to evaluate the effect of a predictor on a response variable in the presence of other predictors that are possibly related to that predictor. In the calculation of the coefficents in the regression process, related predictors basically split their common effect on the response variable. The stronger the relationship, the less stable the allocation of their separate effects becomes often due to minor variations in the data. In extreme cases (such as collinearity), coefficients can have unreliably large values or even change sign in order to balance each other out.
In order to determine the magnitude of the effect on the response variable (%Beliefc) of a specific variable (TMaxc), a different approach is typically used. The researcher carries out two multivariate regressions – the first omitting that variable and the second using all of the predictor variables. For each of the regressions, measures of how well the data fits the model is determined. The fit using all the variables will always be better (although in rare cases they could be equal) and the difference in the fit statistics reflects the effect on the response solely due to the omitted variable in the presence of the other variables. This forms the basis for testing whether that effect is real. This methodology is commonly used in Analysis of Variance and many other situations of model fitting.
The method used in Kaufmann et al is not capable of providing justification for the conclusions stated in the above quote. Views on climate change differ substantially between supporters of the two major US parties. The relationship evident in the “Belief in GW” and the county level Voting Percentage plot and the similarities in the patterns of the US maps above indicate a need to collect more information and then carry out a proper analysis of that data.
RomanM, stats never were a warmunist strong point, since would undermine their religion. C.f. Mann’s hockeystick and his centered PC nonsense deconstructed by McIntyre.
Roman That was the first thought that crossed my mind – use some form of ANOVA when you have finely gridded demographics and related data. I would think that a step-wise form would provide all the values needed to sort out the issue.
“………..Why might this be? Study coauthor Jacqueline Liederman, BU professor of psychological and brain sciences and director of the University’s Cognitive Neurophysiology Lab, believes it’s because humans are prone to learn from their own experiences…….”
She BELIEVES that we learn from our experiences? I’ve KNOWN that I learn from my experiences a long time ago. If we need psychologists to inform us of this in the U.S. and the world, we are in a very bad way.
But do we learn EVERYTHING we know from personal experience? No, and anyone who says that we do, whether the subject is CAGW or anything else, is feeding us BS.
“. . .believes it’s because humans are prone to learn from their own experiences…….”
What she meant was extrapolate from their experiences.
And what is wrong with that?
Is John Cook a co-author on this paper or is he just a spiritual mentor to Kaufman. I bet there is a 97% in it somewhere.
This is a pretty basic case of ideology convergence. The topics are all sensitive to well-known ideology and the result is strong correlation among the maps. Similar to the “All roads lead to Rome” idiom where Rome is a point of common but dispered interest.
Sorry for the long “blockquote”, but I read that and couldn’t help but wonder if this type of thinking is why The Weather Channel several years ago stopped giving the record highs and lows for the day on their “Weather on the Eights”?
To tell people the temps were almost always “worse” back then would detract from the meme that they are “worse” now?
PS I have some of list from different years of record highs and lows for my little spot on the globe.
Comparing them shows that even the records for my little spot on the globe have been fiddles with.
(IE The most recent list of the record high for a particular day is lower than a previous years list for the record high for that particular day.)
“PS I have some of list from different years of record highs and lows for my little spot on the globe.
Comparing them shows that even the records for my little spot on the globe have been fiddles with.
(IE The most recent list of the record high for a particular day is lower than a previous years list for the record high for that particular day.)”
Really!? Is it really getting that bad? Now that you mention it, my local weather person hasn’t mentioned the record highs and lows in the forecasts, either. And now you have me worried even that would be a lie! Oh, brother!
First of all, Merry Christmas!
Then, yes, really.
TWC stopped including the record temps for day in November of 2013.
I put this up awhile ago.
https://wattsupwiththat.com/2012/08/24/a-different-take-on-the-hottest-month-on-record/#comment-1065161
It didn’t “paste” quite right then. here it is again with a little editing in the hope it “paste” better.
“…And a personal note, Dr. Kaufmann left a comment on the previous thread that was pretty ugly, and I snipped it it because, well, it played that stupid “smoking causes cancer denial” that the left likes to hurl in the context of climate change, he didn’t give his full name, which is typical for people that throw insults. The email address he used and the IP address check out as being from bu.edu You’d think Kaufmann would stand behind his own words…”
An Ivy League athletic team might be suspended if one of their players did such a thing.
The problem arises by conflating Global Climate Change with Global Warming (which it is implicitly assumed to be caused by CO2).
Even if we take an extreme case where the rate of Global Warning is 5C per century (or about 5 times what is actually being observed), we are looking at 0.5 degrees per decade, or 1/20th of a degree per year. This is about 100 orders of magnitude below what a human being is able to detect without very sophisticated instrumentation. Furthermore, this signal would be buried in natural variation making it almost impossible to separate signal from noise.
So we have the totally unscientific notion of Man Made Climate Change, where a 1/100th of a degree increase (claimed to be observed) from one year to another is responsible fore HUGE changes in weather/climate.
Is it any wonder that people do not believe it?
“So we have the totally unscientific notion of Man Made Climate Change, where a 1/100th of a degree increase (claimed to be observed) from one year to another is responsible for HUGE changes in weather/climate.”
On top of which, there has been no huge changes in weather/climate.
“…100 orders of magnitude…” is a bit strange, don’t you think?
I stand corrected.
From the paper:
“We test the relation between how the public perceives climate change and the degree to which they believe that global climate is warming (Fig. 2) by regressing the estimated percentage of a county’s adult population who agree that global warming is happening (%Belief) against county-level values for TMax (Fig. S1) and the influence of recent record temperatures (recency weighting) as represented by the most recent record temperature, high (High2005) and low (Low2005) temperatures since 2005, which is chosen based on the mean residence time of US households (Materials and Methods). Regression results indicate that there is a statistically measureable positive relation between county-level values of TMax and the percentage of the population that believes that global warming is happening (Table 1).”
Rule number one: correlation is not causation, especially not when the correlation is lousy
Rule number two: we do not test by regression, we test by prediction and compare predictions with observations.
When I search for: “statistically measureable positive relation”
I get one hit – that paper.
If I correct the misspelling and search for: “statistically measurable positive relation”
I get no hits on Google – it seems like the authors invented that term.
Can someone plot a graph of CO2 in the atmosphere vs Federal Tax Receipts.
You will probably see a much higher correlation than you get with temperature.
From the abstract to the original paper:
“We postulate that skepticism about climate change is partially caused by the spatial heterogeneity of climate change, which exposes experiential learners to climate heuristics that differ from the global average.”
Let’s construe this psychobabble, full of pompous words, into something understandable:
We suggest that observed local climate variations cause those that experience them to doubt the global mean climate change.
Of course they do! Climate is a local phenomenon. There is no such thing as a ‘global climate’ on a world where the temperature can simultaneously be from -50C to +50C.
Global mean climate change is absolutely meaningless, for the simple reason that climate change implies something mathematically undefinable (local climate) can be averaged spatially.
What is the average of tropical forest and tundra, for instance? Northern temperate? You can average temperatures but you still get something meaningless except mathematically because temperature is a potential i.e. intensive not extensive. If you area-weight temperatures you still do not remotely define a climate.
It seems that climatologists have forgotten what climate actually means, as described by Koppel, for instance. It is not mean temperature but temperature range (annual variation) and a host of other factors.
The real reason people doubt climate change is because their climate local has not, in fact, changed.
This paper makes one wonder where so-called ‘science’ is going. Restatement of the obvious is typical on much eco-, social –, and psychological ’science’.
i’m sure that’s why atheism is known as ‘the opiate of the people’.
frikkin hobby horses…
No religion is more dependent on “faith” than atheism. It is a religion based 100% on pure faith. Almost as bad as environwackism.
Atheism does not require faith, not in the slightest.
Atheism is 100% faith based. But hey, continue to lie to yourself, it has worked for muslims for their entire existence. Perhaps you can go car bomb a daycare center to make yourself relevant, same as muslims do.
I am curious but is a researcher (I won’t use the word scientist with these clowns) who makes assumptions still practicing science ? or is he some sort of witch doctor … he may as well be pouring chicken blood on a plate and casting bones to divine what is happening …
Wow – looks a lot like this map I’ve shopping around on these pages for some time now:
http://oi68.tinypic.com/15qulvb.jpg
Kaufmann’s group is planning a future project to better determine whether political allegiances affect how people learn from experience.
scientists communicate with the public about climate change. “I think climate scientists have to step back and rethink…and use very different sorts of evidence to convince people that climate change is real,” he says.
_____________________________________________
So – Kaufmann’s group isn’t at all interested in studying the real world.
They already are in possession of ‘the truth’.
Sole problem is how to convert the thoughtless majority into ‘belivers’.
“So – Kaufmann’s group isn’t at all interested in studying the real world.
They already are in possession of ‘the truth’.
Sole problem is how to convert the thoughtless majority into ‘belivers’.”
That’s it in a nutshell. And that applies to the whole bunch of True Believer scientists. They are working off the assumption that humans are causing the climate to change right now, without any evidence, and only one visual, the bogus Hockeystick graph. They are assuming too much, but that doesn’t even seem to enter their minds.
it might be fun to compare the map with a map showing alcohol consumption.
It is one way of corrupting weather forecasting. Let me present Indian scenario. Cold waves in winter and heat waves in summer. They are primarily associated with the Western Disturbances. It follow the high pressure belt pattern located Nagpur area. From this the winds flow defines the heat or cold wave condition zones. However, these are modified if a low pressure system exists in Bay of Bengal or Arabian Sea. This I presented as back as 1978. Till to date they follow the same pattern.
It is essential first to characterise the conditions that help the extreme conditions in summer and winter instead of harping on global warming. Some time scientific groups selected few years and present sensational results — like that of cyclonic activities in Bay of Bengal.
Dr. S. Jeevananda Reddy
Anthony? You have a malware/virus problem. This is the only webpage I get repeated security warnings about mega.vast.mega-tags.com on. Not .gov, got there sh*t under control. So clearly this is where it is coming from. Just letting you know.
It sounds like you have a virus on your computer, 2hotel9.
Noone else has complained publicly about this, and I don’t get anything like that loading the same page you do. When I check the list of websites trying to load their data onto this webpage (10), the website you are having trouble with is not listed, so it is not loading because of something on this WUWT webpage, which means some program on your computer is calling that website on its own.
Take the advice below and watch your status bar when you load this page and others and see if the strange website is connecting to you. Programs like “Wireshark” can tell you what websites your computer is talking to, also. Some firewalls can be set to reject connection with designated sites.
http://www.sitealyzer.net/en/p/sb/remove-mega.vast.mega-tags.com/
“Remove mega.vast.mega-tags.com From Your Browser
Published: May 31, 2016 Author: Roger Karlsson
This page shows how to remove mega.vast.mega-tags.com from Mozilla Firefox, Google Chrome and Internet Explorer.
Does this sound familiar? You see mega.vast.mega-tags.com in your browser’s statusbar while browsing on sites that commonly don’t load any content from third party domains.
Here’s a screen-cap of mega.vast.mega-tags.com when it showed up on my system:
mega.vast.mega-tags.com in the status bar
I noticed mega.vast.mega-tags.com in the status bar and the network log while I was browsing a site that I know does not load or link to any content outside of the site.
The following are some of the status bar notifications you may see in your browser’s status bar:
Waiting for mega.vast.mega-tags.com…
Transferring data from mega.vast.mega-tags.com…
Looking up mega.vast.mega-tags.com…
Read mega.vast.mega-tags.com
Connected to mega.vast.mega-tags.com…
If this description sounds like your machine, you most likely have some potentially unwanted program installed on your computer that makes the mega.vast.mega-tags.com domain appear in your browser. So don’t write angry emails to the web site you were browsing, they are most likely not responsible for the mega.vast.mega-tags.com status bar messages. The potentially unwanted program on your computer is.”
end excerpt
Everyone keeps saying that. My computer shows clean according to both my virus/malware security programs, and this is the only place that flags come up. Not cnn, not Thomas Law Library, not youtube,,,,bang, just flagged 3 times as I am typing this, no other tabs open at same time.. Does not happen anywhere else. Just trying to help, pointing out what is going on. Perhaps my security is set too tight, I built that wall and did not even make Mexico pay for it. 😉
That’s one thing I always liked about Windows XP: You could look at your task manager and see every program running on your computer, and can kill it from there, at least temporarily. Naturally, Windows 8 has complicated this process immensely. You can still find out what is running but you have to put a lot more work into it. What happened to “if it ain’t broke, don’t fix it”? I hate windows programmers! They *never* make things less complicated. 🙂
Yea, loved XP and fought to keep it. Microsoft has a bad record of “fixing” things to death. Have not had a lot of trouble with 10, so far. Got this new Dell laptop and it came with ESET anti-virus, works well, it blocks all manner of crap and notifies what and where from. My old anti-virus let stuff through and THEN told me about it, very annoying. Although my Geek appreciated the work it brought him.
Oh, I did use sitealyzer the first time you gave me that link, thanks. I had to go out and do some stuff, left this page open and it is still loading, little spinnie circle up in left top corner going round like a trailerpark girl. Thats kinda odd.
And with posting that comment it stopped. Odderer and odderer.
Whenever I click on Wattsupwiththat, as soon as the text loads, I click on that
“Stop loading this page” [X] because if I don’t the page crashes after a few minutes.
(I use Google Chrome)
“Whenever I click on Wattsupwiththat …”
I run Linux and something I notice with firefox is that the ads often crash flash. This seems to be specific to the wattsupwiththat site as I don’t see this in other places. There’s a process related to plugins that seems to consume memory without bound whenever I have a wuwt page loaded. As a result, I generally don’t keep wwut windows in an active tab as the ads generate a significant amount of background activity as they consume memory. Looks like a memory leak to me and this could lead to many different kinds of symptoms.
Yea, sometimes page loads here just keep loading, other times not.
Steve. For a while, I was running adblock and then adblock plus and added hide my addblock but it wasn’t really doing all that great. So now I’m running ghostery. I wouldn’t be having these blockers except the excessive ads on some sites were crashing my internet explorer and chrome.
Search the txt file for mega.
http://winhelp2002.mvps.org/hosts.txt
Blocking Unwanted Connections with a Hosts File
No, my anti-virus/malware security is blocking it, and this is the only webpage they are having to block it from. Just letting the Man know there is a problem. Perhaps a directed attack from environazis leftards who are quite happy to use such sh*t. In the last 15 minutes I have had 18 blocked virus notifications here. Zero at foxnews, cnn, bbc and accuweather. Is anyone starting to see a pattern here?
Just now I had 6 blo,,,no, 7 blocked cdn.stickyadstv.com. And have some sort of autoplay audio ad that is being blocked. That is new.
Look at the titles of the “professions” of these authors. You can get a PhD in stuff that hadn’t been invented until the new millennium. With junk qualifications in junk science that has more than an even chance of being fictitious one needn’t wonder if the methodology is appropriate. And their next project sounds like a clone of phrenology.
S’Truth there is going to be a lot of ‘Earth Environmental Neurosocial Political Eco-phrenologists’ driving taxicabs when this ugly epidemic runs it’s course.
Thanks to Google and Tesla they will need to search for work elsewhere. Taxi drivers will no longer be needed.
In terms pf belief versus knowledge structures, what first needs be considered is the “9 times rule”, whereby humanity was found to be 9 times more susceptible to rumor than it is to fact.
Pile on Xie et al (2011) whom provided this:
“We show how the prevailing majority opinion in a population can be rapidly reversed by a small fraction p of randomly distributed committed agents who consistently proselytize the opposing opinion and are immune to influence. Specifically, we show that when the committed fraction grows beyond a critical value pc ≈ 10%, there is a dramatic decrease in the time Tc taken for the entire population to adopt the committed opinion.”
“In the sociological context, work on diffusion of innovations has emphasized how individuals adopt new states in behavior, opinion, or consumption through the influence of their neighbors. Commonly used models for this process include the threshold model [8] and the Bass model [9]. A key feature in both these models is that once an individual adopts the new state, his state remains unchanged at all subsequent times.” https://arxiv.org/pdf/1102.3931.pdf
“Social Consensus Through the Influence of Committed Minorities” published in Physical Reviews E84 011130
Basically, what it tells us, is that the latest iteration of the genus Homo is rather susceptible to relatively minor perturbations. Clock up ~>10% and you rapidly get your consensus.
Me? More or less impermeable to pretzel logic, I am enjoying watching the weather/climate spiral ever closer to the tropics. Less Arctic sea ice allowing insolation capture, the concomitant increase of atmospheric pressure due to pH2O, producing the expected Arctic ‘highs”, and driving the polar vortex south to deliver that excess moisture to potentially nucleating the next Laurentide ice sheet.
The only thing so-far proposed that can offset or obviate glacial inception is the AGW hypothesis. The greatest modelers and thinkers of our time have absolutely no idea what it takes to offset or obviate MIS-0.
“We show how the prevailing majority opinion in a population can be rapidly reversed by a small fraction p of randomly distributed committed agents who consistently proselytize the opposing opinion and are immune to influence.”
I would say that is a perfect description of the MSM and what it does to influence public opinion and push the radical Leftist agenda. It also shows why the MSM is so effective at fooling half the country, and that they are dangerous to our freedoms because they *can* fool half the country all the time and lead them in the wrong direction, like voting for Hillary Clinton.
“The situation is completely different for a CO2 concentration of 240 p.p.m., which is close to that observed at the end of MIS19. In this case all four model versions simulate rapid ice growth several thousands of years before the present and large ice sheets exist already at the present time (Extended Data Fig. 1). This means that the Earth system would already be well on the way towards a new glacial state if the pre-industrial CO2 level had been merely 40 p.p.m. lower than it was during the late Holocene, which is consistent with previous results.”
Paywalled here: http://www.nature.com/nature/journal/v529/n7585/abs/nature16494.html
“We will illustrate our case with reference to a debate currently taking place in the circle of Quaternary climate scientists. The climate history of the past few million years is characterised by repeated transitions between `cold’ (glacial) and `warm’ (interglacial) climates. The first modern men were hunting mammoth during the last glacial era. This era culminated around 20,000 years ago [3] and then declined rapidly. By 9,000 years ago climate was close to the modern one. The current interglacial, called the Holocene, should now be coming to an end, when compared to previous interglacials, yet clearly it is not. The debate is about when to expect the next glacial inception, setting aside human activities, which may well have perturbed natural cycles.”
Crucifix, M. and J. Rougier, 2009, “On the use of simple dynamical systems for climate predictions: A Bayesian prediction of the next glacial inception”, Published in Eur. Phys. J. Spec. Topics, 174, 11-31 (2009)
http://arxiv.org/pdf/0906.3625.pdf
“The possible explanation as to why we are still in an interglacial relates to the early anthropogenic hypothesis of Ruddiman (2003, 2005). According to that hypothesis, the anomalous increase of CO2 and CH4 concentrations in the atmosphere as observed in mid- to late Holocene ice-cores results from anthropogenic deforestation and rice irrigation, which started in the early Neolithic at 8000 and 5000 yr BP, respectively. Ruddiman proposes that these early human greenhouse gas emissions prevented the inception of an overdue glacial that otherwise would have already started.”
conclude Muller and Pross (2007)
https://www.researchgate.net/profile/Ulrich_Mueller7/publication/222561971_Lesson_from_the_past_present_insolation_minimum_holds_potential_for_glacial_inception/links/0c96051e593f3a593d000000.pdf
Climate change like politics is a religion. Left leaning people from the more densely populated areas are more emotional and driven by what happens in the heat of the moment where the less populated areas spend the time to think about things and form more logical conclusions.
I believe HG Wells said “It is not much good thinking of a thing unless you think it out.”
Clearly M Courtney did not.
That’s a strange hypothesis.
Higher population density tends to lead ot more social interactions and thus more potential conflicts. Thinking before acting would seem to be a necessity in urban areas. A less emotional response.
While hillbillies can feud safely for decades.
Not sure I agree. I live in a rural area, and screwing up relationships can be much more costly. There are few places to hide, and you are far more likely to eventually need the help of your neighbor. Deliberately isolating yourself can get not just inconvenient, but deadly, if you are in an environment like Maine in the winter.
On the other hand, move three blocks away in a city, and you can restart your life. Same goes for small vs. large colleges – “there’s safety in numbers”, or at least it’s easy to reinvent yourself. Don’t doubt that the civility in rural areas is somewhat driven by the necessity to live together.
And by the way, it’s not just “hillbillies” that feud (I’ll ignore the pejorative for now), try gangs in major cities (e.g. Chicago). That is feuding on a scale never contemplated in a rural setting.
You have that sh*t entirely backwards. Are you really this clueless? About time for you to wake the f**k up and smell reality.
The term “believe” concerning climate makes the whole thing unscientific (or simply related to psychology).