By Willis Eschenbach and Anthony Watts
Today at the American Geophysical Union Convention, Willis Eschenbach and Anthony Watts will be presenting at 1:10PM in Moscone South.
FOR IMMEDIATE RELEASE
Study at AGU 2016 challenges conventional wisdom on climate sensitivity
‘Observational Quantification of Water Vapor Radiative Forcing’
December 14th, 2016 – San Francisco, CA – A new study about the role of water vapor in climate sensitivity is being presented at the 2016 Fall Meeting of the American Geophysical Union today by Willis Eschenbach and Anthony Watts in session A33B: Climate Sensitivity and Feedbacks: Advances and New Paradigms, in Moscone South Poster Hall at 1:10PM to 6PM December 14th, position A33B-0226.
The study, using satellite measured water vapor data obtained from Remote Sensing Systems (RSS) of Santa Rosa, CA, suggests that the global climate sensitivity to increased carbon dioxide, and the potential feedback mechanism of increased water vapor in Earth’s atmosphere, is actually far less than postulated by the IPCC.
An investigation was conducted utilizing the Remote Sensing Systems (RSS) 1°x1° gridded total precipitable water (TPW) dataset to determine the magnitude of upwelling long-wave infrared radiation from Earth’s surface since 1988. TPW represents the mass of water vapor in a 1 meter by 1 meter column from the surface to the top of the atmosphere. As referenced in IPCC AR5 WGI Box 8.1, the radiative effect of absorption by water vapor is roughly proportional to the logarithm of its concentration. Therefore it is the fractional change in water vapor concentration, not the absolute change, that governs its strength as a climate forcing mechanism. A time-series analysis utilizing a Loess decomposition filter indicated there is a clear upward trend in the RSS TPW data since 1988. The observed total change over the period is ~ 1.5 kg/m^2, centered around the long-term mean of 28.7 kg/m^2. Utilizing the observed relationship between water content and atmospheric absorption, the RSS TPW data indicates an increase in downwelling longwave radiation of 3.3 W/m2 over the period 1988 – 2015.
Key finding:
The finding of an observationally measured increase in downwelling radiation of 3.3W/m2 since 1988, in addition to the increase in downwelling radiation over the period as calculated by the IPCC, with little corresponding change in temperature, calls into question the applicability of the concept of “climate sensitivity”.
Corresponding author: Willis Eschenbach willis@surfacetemps.org

The full poster is here: agu16-poster-final (PDF)
Links to data and code: https://dl.dropboxusercontent.com/u/96723180/TPW.zip (600 MB)
According to the “water vapor” section of the RSS website. “This increase can formally be attributed to human=induced climate change”
In what way do you disagree with that statement ?
Change in wind?
What happened to “correlation is not causation”? Perhaps the change in temperature caused the change in atmospheric water? Not the other way around?
Doesn’t it make more sense that there is more water in the atmosphere since 1988 because the temperature has been warming since the LIA? And NO ONE KNOWS what caused temperatures to start rising since the LIA, and more than they know what caused the medieval, roman, minoan, etc warming.
Exactly. I really don’t see anything here other than the temperature went up and so did the water vapor. The only real find is the temperature rise was less than expected if the water vapor was the cause but even that is not known.
Willis and Anthony, nice work. Concise and well explained. Congratulations are in order.
If I might summarize; “Forcings” UP, Temperatures still FLAT…. Some “Forcings”…..
To repeat my position, the equilibrium climate sensitivity is zero.
The “Forcings” are merely energy making additional passes through the system at the speed of light, nothing more.
The still unobserved “Radiative Greenhouse Effect” which allegedly causes an increase in average temperatures is simply an optical mirage, a chimera, an illusion…. Sad that so much wealth and intellectual effort has been wasted on chasing this mirage.
Energy leaving an emitter (a rock as opposed to a light bulb which is a source) of thermal energy and later returning to the same emitter cannot raise the temperature of the emitter. It can change the response time of the emitter (it can warm up slightly faster or cool down slightly slower) but not add the additional energy needed to increase the average temperature.
Cheers, KevinK.
This study does not measure temperature differences between wet and dry regions at similar latitude and altitude. When you do that your study will show water vapor cools.
“However, other greenhouse gases, primarily CO2, are necessary to sustain the presence of water vapour in the atmosphere. ” – Tony B
Based on exactly what evidence? More alarmist trash.
Well, alarmist trash might be strong. I chalk it up to smug ignorance.
But but, what about all the massive rivers in the sky?
http://www.msn.com/en-au/news/world/massive-rivers-in-the-sky-will-bring-more-deadly-floods-due-global-warming/ar-AAlA7xR
or will all the polar bears in the atmosphere save us from them?
You don’t think Vlad the Impaler is messing with their heads do you?
http://www.msn.com/en-au/news/world/vladimir-putin-personally-involved-in-hack-of-us-election-intel-officials-say-report/ar-AAlA5Up?
Ivanka Marie Trump (Trumps daughter) is going to have an office in the white house. She is a democrat and is pro CAGW. She will have a big influence, so watch out…
I think that could be good. She can be the person to watch, as the other side of the picture is presented. If she backs away from her apocalyptic views to a more relaxed view, then she could have a persuasive role with the general public. She might even persuade Al Gore to relax.
Regarding these:
“The observed total change over the period is ~ 1.5 kg/m^2, centered around the long-term mean of 28.7 kg/m^2. Utilizing the observed relationship between water content and atmospheric absorption, the RSS TPW data indicates an increase in downwelling longwave radiation of 3.3 W/m2 over the period 1988 – 2015.
Key finding:
The finding of an observationally measured increase in downwelling radiation of 3.3W/m2 since 1988, in addition to the increase in downwelling radiation over the period as calculated by the IPCC, with little corresponding change in temperature, calls into question the applicability of the concept of “climate sensitivity”.”
So, does using an observed relationship to determine an increase of 3.3 W/m^2 mean that a 3.3 W/m^2 increase was actually “observationally measured”?
Also, a 1.5 kg/m^2 increase with the long term mean being 28.7 kg/m^2 sounds to me like an increase of 27.95 to 29.45 kg/m^2, or at least something close to this. That is a 5.4% increase, and the vapor pressure of water increases about 6.7% from a temperature change from 14 to 15 degrees C. So as I see things, if 100% of the water vapor increase was caused by global warming, then it corresponds to a .8 degree C temperature increase. Using what I see from http://woodfortrees.org/plot/hadcrut4gl/from:1988/to:2015.5/trend/plot/hadcrut4gl/from:1978/mean:25, global temperature smoothed by a couple years increased .4 degree C from the beginning of 1988 to the middle of 2015. I excluded the second half of 2015 to avoid a 20-year-class El Nino. (By any chance was that 1.5 kg/m^2 increase of water vapor including the last few months of 2015?)
Also, I question whether the actual measurements observed were of water vapor increasing 1.5 kg/m^2 or of downwelling IR increasing by 3.3 W/m^2, or if these were both actually measured and the measurements agree. In that case, I would note that the Kiehl Trenberth energy budget diagram/”cartoon” shows downwelling IR being 324 W/m^2. This corresponds to the “effective lower radiating surface” of greenhouse gases and clouds having a temperature of about 275 K or 2 degrees C for effective global average (or 4th root of mean of 4th powers of effective individual such temperatures worldwide). An increase of this temperature from 275 to 275.4 K causes a nearly 1.9 W/m^2 increase of downwelling longwave IR if greenhouse gas concentrations and clouds are unchanged. This seems to me as meaning that the 3.3 W/m^2 increase of downwelling IR has 1.4 or slightly more W/m^2 being caused by increase of water vapor – or total greenhouse gases? I think I got ends close to meeting each other.
For that matter, the increase of CO2 from 1988 to 2015 accounts for about .7 W/m^2 of the increase of downward longwave IR using the widely-used figure of 3.7 W/m^2 per doubling of CO2 according to the usual IPCC-favored logarithm formula for effect of change of CO2. I see this meaning .7-.75 W/m^2 needs to be explained by increase of greenhouse gases other than CO2, including assuming IPCC-favored figures. This means including the slight increase of manmade greenhouse gases other than CO2 such as methane since 1988, even though the effect of that increase is minor because halogenated hydrocarbons are manmade greenhouse gases that had their increases of atmospheric presence generally stalled in the 1990s and slightly reversing downward since then by an attempt to stop manmade increase of stratospheric ozone erosion.
At this rate, I think that ends meet each other if global atmospheric temperature increased less than HadCRUT4 reports and/or global atmospheric (tropospheric especially) relative humidity decreased. Although, I think this means that the cloud albedo feedback is slightly positive (because storm clouds get less present due to them becoming more effective at transporting heat in balance with the counterpart dry air whose efficiency does not change much), and that positive cloud albedo feedback requires a warming world to have decreasing global average atmospheric relative humidity along with decreasing global cloudiness. A warmer world makes updrafting clouds more efficient but does not make much change to efficiency of downdrafting clear atmosphere on global scale, so I expect cloud coverage to shrink as it gets more productive in its part of transporting heat in global circulation. I see this meaning that the combined feedback values for cloud albedo and water vapor are close to what the water vapor feedback alone is if global atmospheric relative humidity is unchanged, more likely a little less than a little more. At this rate, I think that the combined water vapor and cloud albedo feedbacks are slightly less than the 1.6 W/m^2 that I have heard before, so I like to say 1.5. Also, I see spectrum absorption interactions between increase of CO2 and increase of water vapor where increase of one greenhouse gas negates some effect of the other, so at that rate I like to say that the combined water vapor and cloud albedo feedbacks along with increase of water vapor detracting from CO2’s 3.7 W/m^2_per_doubling mean that the positive feedback related to greenhouse gases getting reinforced by increase of greenhouse gases is only about 1.3 W/m^2/K.
Also, there is a negative feedback that increases with global temperature – the lapse rate one. I estimate that its figure that matters for this century will be negative 1-1.05 W/m^2 per degree C/K.
(Add to these the surface albedo positive feedback – maybe ~.25 W/m^2 per degree C/K lately or in the past 50-100 years, but I expect that will mostly (even if not continuously) decrease as changeable coverage of snow/ice gets decreased and/or gets more confined to less-sunny parts of the world. I like to say that the “number that matters” for the remainder of this century for surface albedo feedback will positive about .15 W/m^2 per degree C/K.
The key finding according to this poster presentation is: “The finding of an observational measured increase in downwelling radiation of 3.3W/m2 since 1988, in addition to the increase in downwelling radiation over the period as calculated by the IPCC, with little corresponding change in temperature, calls into question the applicability of the concept of “climate sensitivity”.
This conclusion would be justified, if we know with 100 % certainty that there are no other contributors for the global warming than CO2 and H2O. So far we cannot say so. In reality there are other forces contributing for the global temperature increase. The situation could be this (I think it is possible): in the year 2000, the temperature increase of 0.85 C degrees since 1880 is caused by CO2 0.2 C, other GH gases 0.1 C, H2O 0 C, the Sun 0.3 C and other cosmic forces 0.25 C. In the year 2015 the temperature increase is still 0.85 C and the contributions are: CO2 0.3 C, GH gases 0.1 C, H2O 0 C, the Sun 0.25 C, other cosmic forces 0.2 C.
The point is that it is impossible to calculate the observational climate sensitivity – it is the temperature increase by CO2 based on the observational data, because we do not know the impacts of other contributing forces.
“The key finding according to this poster presentation is”
Actually, that’s the key finding according to the press release. The key finding in the poster doesn’t mention temperature or sensitivity (nor does the poster):
“This leads us to a curious position where we have had a larger change in forcing from
water vapor since 1988 than from all the other IPCC-listed forcings since 1750.
“
Yes, I like several others, don’t see the logic behind this claim.
I see a measured change in TOA LWIR that is primarily attributable to both WV and CO2.
There is a strong similararity to surface temp records or satellite TLT time series plus an underlying rise. Since we have both the simplistic ln(C/C0) formula and more detailed MODTRANS calculations for straight CO2 radiative effect which seem relatively uncontroversial it should be possible to compare the lower panel of Willis’ fig 4 to those two results.
For example use MLO as a typical global average CO2 and apply ln(C/C0) to get a time series to subtract from the data in fig 4. See how the result correlates with surface temperatures.
If it is fairly linear calculate a feedback in terms of K/(W/m^2)
This can be subtracted from &lamba;0 to find the WV amplification of any particular nonfeedback forcing.
I don’t see anything there which questions the concept of “climate sensitivity”. Though it should provide a useful observational check on other results and model behaviour.
sorry λ0
Willis , you have been good enough to provide you code and data but dropbox is refusing to follow demand. Could you make it available somewhere else please?
thx.
We look at the sun as an energy source and measure temperature gains. Why not look at the black sky and notice temperature loss. Artic is unusual warm this Year. It must be covered by humid air. Anyone who can confirm this?
Eschenbach & Watts write:
And:
But this isn’t an “observationally measured increase in downwelling radiation”. The only thing actually being observed here is the increase in TPW. The rest is simply calculated from the assumption that this increase in TPW is directly translatable into a parallel increase in DWLWIR. But is it? That’s the question.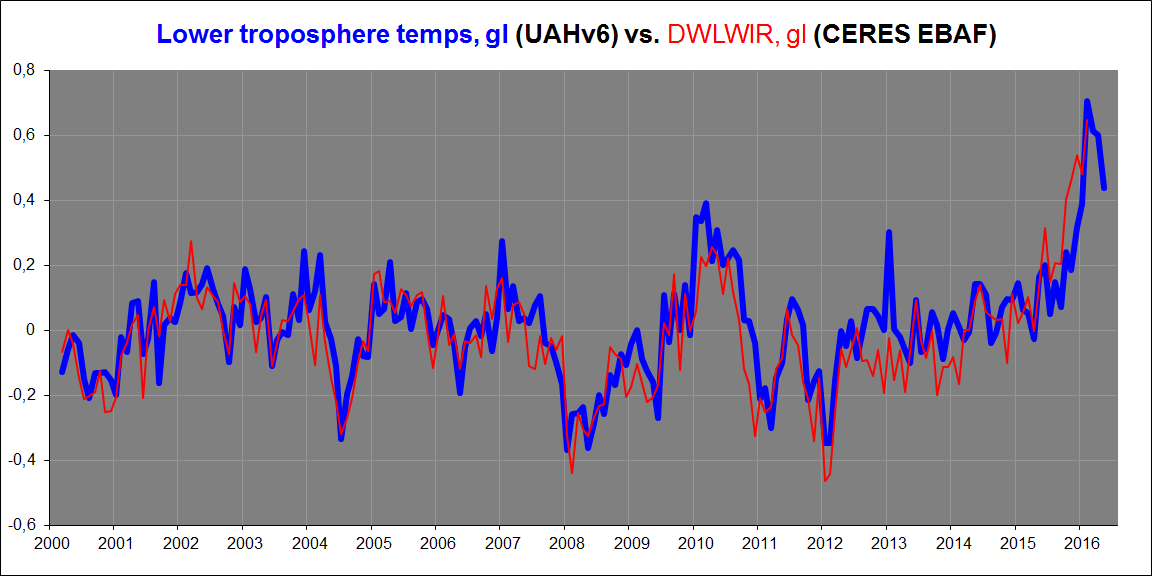

Data from CERES suggests it isn’t. Here’s global DWLWIR as estimated through the CERES EBAF Ed2.8 Sfc product, vs. global TLT (UAHv6 (beta5), 2000-2016 (the radiation flux values scaled down to fit with the tropospheric temps, y-axis):
During that same time, TPW went up tremendously, according to RSS (from Eschenbach) (DWLWIR overlaid):
The discrepancy becomes even more evident when comparing outgoing LW (OLR) from the ToA with tropospheric temps over the same period (2000-2016):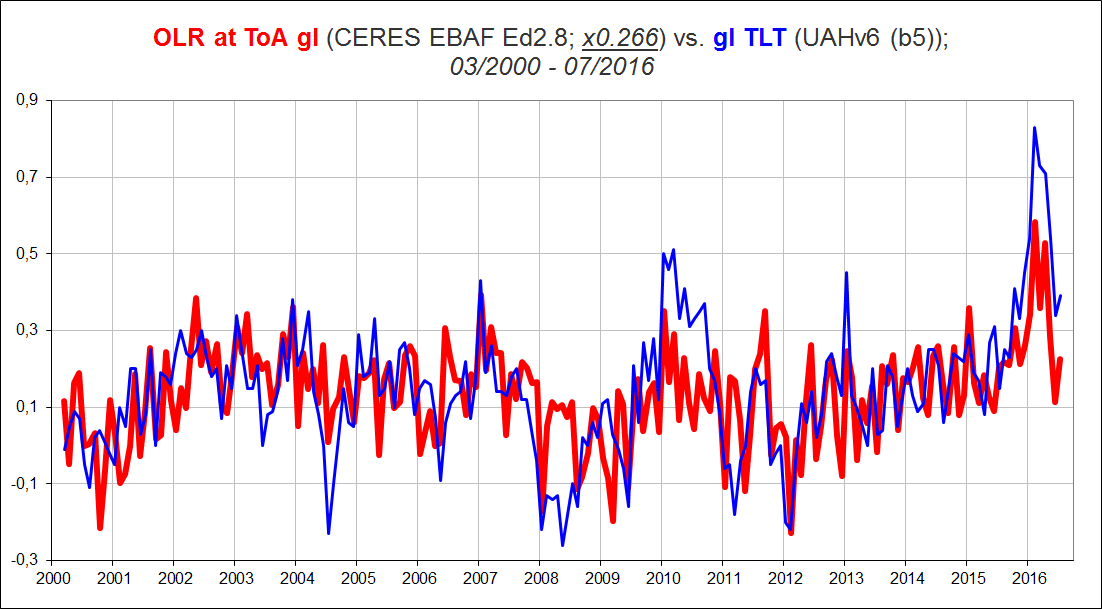
This plot shows how OLR at the ToA simply tracks tropospheric temps over time, and that the pretty significant increase in TPW (according to RSS) over this period for some reason doesn’t appear to affect this simple, tight causal relationship to any discernible degree.
OLWIR at TOA does not come directly from the surface but is radiated at what is defined as the “effective emission layer” several km up ( cf satellite TLT ) . As such it would be expected to closely follow a tight causal relationship with a la S-B emission law.
I don’t see the ‘discrepancy’.
Greg, you say:
No, it isn’t. The outgoing long-wave radiation going out through the top of the atmosphere to space is the accumulated total of the thermal emission escaping the Earth system from ALL its layers, from the actual surface to the top of the atmosphere itself, each layer contributing some fraction (big or small) of the whole. This final flux comes MAINLY from the troposphere (top to bottom), but is absolutely not tied to any particular temperature therein. It is what it is (239 W/m^2) simply because the solar input happens to be what it is (239 W/m^2), and because the Earth is in a relative, dynamic steady state, and so will tend to balance the incoming with its outgoing heat. It is only when you “back-calculate” from this average flux value that you can state a hypothetical black-body temperature for Earth as a planet in space. However, this temperature is purely a mental/mathematical construct. It isn’t an actual physical temperature to be found anywhere.
Exactly. But this study appears to assume that simply increasing the TPW of the atmosphere will also, automatically and all by itself, increase the DWLWIR, that is, this increase would come on top of an increase deriving from a temperature rise alone. However, we see no such thing in the real world (an “extra” rise in DWLWIR from T+TPW). Hence the “discrepancy” being mentioned (between DWLWIR and TPW):
“the accumulated total of the thermal emission escaping the Earth system from ALL its layers”
sorry mate you need to do some reading. The mean free path of an IR photon near the surface is just a few metres before being absorbed. Until you know the basics, be a little lest assertive in your statements.
I don’t think this is true for most of the 8u to 14u band, other than the 2 water lines, the rest of those photons under clear skies goes almost directly to space. And I’m going to take an educated guess that that window is worth about 20W/m^2 with no interference, Also, don’t forget, it’s radiating to space all day too.
Greg said, December 15, 2016 at 9:23 am:
LOL
Greg, do you seriously see Earth’s radiation escaping to space like this (from the surface air layer to the top of the atmosphere)?
nothing, nothing, nothing, nothing, EVERYTHING (your “effective emission layer”), nothing, nothing, nothing, nothing … done. Tell me you’re joking.
“The only thing actually being observed here is the increase in TPW.”
It seems that there are three separate observables here ( not two as W seems to imply ).
1. CERES TOA LW : direct measurement
2. ‘Surface Temp’ from which the supposed surface emission of LWIR is calculated. I await a working link to his code to see what data is actually being used and how the calculation is done.
3. TPW from RSS which is presumably a derivative of microwave soundings.
Sure. But what I was referring to was the statement about an “observationally measured increase in downwelling radiation”. Which ISN’T “observed” or “measured” here. It is calculated.
“But this isn’t an “observationally measured increase in downwelling radiation”. ”
It seems that this is a difference between measured TOA LW and supposed emissions from the surface based on SST and some modelled/guessed emissivity relationship. The link does not work to see what he is actually doing and the poster presentation is necessarily terse and does not explain.
Semi-empirical would be better description.
“Non-empirical, rather just assumed“, would be an even better description.
This is exactly what I’m pointing out using the plots I present. You can’t just take a (purely calculated) increase in UWLWIR (based on some rise in surface temperature), subtract from this the change in OLR at the ToA over the same period, and assume the difference you get directly equals the increase in DWLWIR. The Earth system is – evidently – more complicated than that.
what is your objection? “you can’t just” is not really an argument.
I have highlighted the fact that emitted LW at surface has to be modelled and based on some fairly broad guesses/assumptions. Why else don’t you think it works?
Specifics, not just “you can’t just” .
How much more “specific” do you want me to be, Greg? Read what I’m writing. And look at the plots provided. I’m NOT saying you can’t infer the UWLWIR from the surface temp. I’m saying you can’t just subtract the change in OLR at the ToA from the change in this inferred UWLWIR value and expect the result to be equal to the increase/decrease in DWLWIR. As evident from the plots.
Here’s Eschenbach’s TPW plot (All-Sky, just like the TLT-curves) vs. CERES EBAF Ed2.8 Sfc Clear-Sky DWLWIR, btw:
The correlation is definitely better overall, but it’s still not particularly good if you look closely. And since we neither have “Clear-Sky TPW” nor “Clear-Sky TLT” at hand, we are really comparing apples and oranges here.
What’s the temperature of the thing/object up in the sky that is producing this extra downwelling 3W?
Not absolute temp to double-digit decimal places, is it higher or lower than the earth surface temperature?
Because if its lower than the surface, Entropy and thermodynamics say it is going to be sent right back where it came from. It is not going to be absorbed and cause a temperature rise.
Cold objects do not radiate energy to warm ones and lift their temperature.
And no, (as previously stated around here) lighting a candle on Earth will NOT cause the temp of the sun to rise for that reason and at least one other. The candle at say 500degC cannot lift the temp of the sun, say= 5,000degC. The candle’s energy is sent/scattered out into space and lost.
Also, the sun is a lump of electrically conductive plasma. Any incoming electromagnetic wave will be perfectly reflected in the same way as hitting a mirror or meeting a short circuit at the end of a transmission line.
So where, to conserve energy, does the ‘extra’ 3W go?
It cannot warm the earth and it cannot raise the temp of the object that emitted it.
The only place left is outer space. It leaves. Never to return.
So. do we see what’s happening here?
The green house gas is *increasing* the outgoing radiation to space.
Does this not make sense as we are endlessly told that GHGs are good absorbers of radiation and laboratory experiments show that.
But good absorbers are also always very good emitters. Adding GHG to the atmosphere is increasing the emissivity of the atmosphere. That’s what these measurements tell us.
The extra water up there has increased the radiation level on the ground, it cannot be absorbed on the ground, cannot return to its emitter so must leave so extra energy is being ejected from Earth by these GHGs.
Again, does that not make sense?
In order to have a warm & toasty earth surface, we need an insulator above us and oxygen & nitrogen with their low emissivities are just that. Insulators.
Adding high emissivity ‘stuff’ (water vapour and CO2) will increase the radiative transport of heat up, out and into space.
And that’s even before the higher thermal conductivity of CO2 (simply because of its high molecular weight relative to O2 & N2) transports ever more heat energy aloft.
Scary innit.
But, is it not a perfect negative feedback?
Surface temp rises, water vapour rises in parallel (as per standard GHG theory) but the WV acts as an extra emitter of energy, cooling the system and bringing it back to its ‘normal’ or average level.
And *that* is what this poster tells me.
as Nick of course pointed out and asked, highlighting the blinkers almost everyone is wearing…
What is causing the observed temperatures to rise?
I say, as I’ve always done that apart from confirmation bias & data-doctoring, its the increasingly strenuous activities of the world’s farmers, plus of course the expansion of cities.
We were right all along with the surface-stations project.
Can I expand my ‘picture’, especially of ‘photons’ or energy packets.
Earth is what, 15degC. Is this about a peak radiation of 10 micron?
In the absence of GHG, earth and atmosphere continually exchange these 10 micron photons and the low emissivity of O2 & N2 means they hang around for a relatively long time, near the surface where we feel nice and warm.
But introduce some GHG,
CO2 absorbs at 15 micron and water at 22 micron.
So the CO2 molecule will intercept a 10 micron, keep 15 micron worth of energy and release the rest, at what, 30 micron?
Likewise, water will absorb 22 micron from the original 10, creating a what, 25 micron photon?
Is the 1/a=1/b+1/c formula
so you see, the GHGs are smashing up high energy (high temp) photons into a multitude of low energy colder photons. And these photons can only raise the temp of things colder than what released them.
Entropy says long wavelength, low energy photons do and CANNOT reform the high energy photon.
Ultimately, they are smashed up so much they only place that will have them is deep, outer space.
GHGs are expediting the flow of thermal energy down the thermal gradient.
They are cooling artifice, not warming
sigh.
…low energy do *not* and…….
“So the CO2 molecule will intercept a 10 micron, keep 15 micron worth of energy and release the rest, at what, 30 micron?”
No, CO2 does not absorb at 10μ. It absorbs around 15μ, but does not (mostly) re-radiate. The energy is rapidly transferred to other, mostly non-GHG molecules by collision. GHGs independently from time to time gather enough energy to radiate, at frequencies dominated also by the 15μ range (Kirchhoff). The air temperature is stable when the rate of absorption matches emission.
Except at 10 kms to 20 kms high, where the CO2 grabs back the energy from non-GHG molecules and emits that at 15μ bacl to space, thus, cooling off the Earth.
Can’t have it only two of the three ways. CO2 absorbs, exchanges energy by collision and then emits energy; all three.
“Except at 10 kms to 20 kms high, where the CO2 grabs back the energy from non-GHG molecules”
That happens at all levels. The only difference at 10-20 is that many photons escape without further absorption.
“Can’t have it only two of the three ways. CO2 absorbs, exchanges energy by collision and then emits energy; all three.”
Yes all three happen at all levels.
Nick Stokes December 15, 2016 at 10:09 am
“Except at 10 kms to 20 kms high, where the CO2 grabs back the energy from non-GHG molecules”
That happens at all levels. The only difference at 10-20 is that many photons escape without further absorption.
“Can’t have it only two of the three ways. CO2 absorbs, exchanges energy by collision and then emits energy; all three.”
Yes all three happen at all levels.
Yes but in different proportions depending on the local pressure/temperature.
“Can’t have it only two of the three ways. CO2 absorbs, exchanges energy by collision and then emits energy; all three.”
Yes, you must have all three. However, with all three, the net result of increasing GHGs is that more photons escaping to space are emitted from higher in the atmosphere, where it is colder. The rate of emission (but not absorption) depends on the local temperature. There would be no GHE without a temperature gradient in our atmosphere.
To a first approximation, doubling CO2 will double the number of photons of certain wavelengths absorbed and double the number emitted. (The amount of energy in all of those photons is well over 1000 W/m2: 90% of surface emission is absorbed on the way to space and the atmosphere – unlike the surface – emits mostly at strongly absorbed wavelengths.) The 3.7 W/m2 forcing from double CO2 the net result of a massive increase in both absorption AND emission and the small bias the temperature gradient in our atmosphere produces.
Objects that are colder than the surface do radiate longwave IR back to the surface, keeping the surface warmer than it would be if it was facing 3 degree K deep space instead. The second law of thermodynamics only requires net flow of heat to be downhill.
A molecule radiating a photon of longwave IR does not know the temperature of whatever that photon will be radiated towards, and the object receiving the photon does not know the temperature of the photon’s source.
THANK you Donald. I trust you have clarified the misapplied Thermodynamics for some!
Willis: Fascinating work. I notice that you abstracted at seasonal cycle in TPW with an amplitude of 1 kg/m2 from the satellite record (in addition to the long-term residual trend). The seasonal cycle is presumably driven by the seasonal cycle in GMST that disappears when temperature anomalies are calculated. The seasonal cycle in GMST has an amplitude of 3.5 K. You have also derived a relationship between atmospheric absorption and TPW: 2.2 (W/m2)/(kg H2O/m2)
2.2 (W/m2)/(kg H2O/m2) * 1 (kg H2O/m2)/3.5 K = 0.6 W/m2/K
Since atmospheric absorption is measured from clear skies where both water vapor and lapse rate feedbacks operate, 0.6 W/m2/K is a measure of WV+LR feedback. IIRC, the consensus of climate models is about twice as big, 1.1 W/m2/K.
Given that we have data for more than 25 seasonal cycles, the confidence intervals associated with the amplitude of the seasonal cycles in TPW and GMST are likely to be relatively small. I’m not sure how much confidence we should have in RSS’s estimate that TPW has increased by 1.5 kg/m2 over the past few decades, but that could be checked against data from radiosondes.
Is atmospheric absorption measured from clear skies and TPW from all skies? Did you get any questions about this?
I read Feldman’s work some time back – it looked like the first observational confirmation of spectrally differentiated trend in IR from CO2 downwelling – but could not understand why he thought the data confirmed the model expectations: 0.2 Watts/decade from an increase over one decade of 22ppmvCO2, computes to 1.09 watts for the rise since pre-industrial times of 120ppmv, compared to 1.8 predicted. Secondly, Feldman notes that this 0.2 watts/decade increase is 10% of the observed increase over the decade in total IR (that is, mainly water vapour). This clashes with the IPCC assumption that ‘most’ of the recent forcing/T-rise is anthropogenic – even if we allow a 3x amplifier of carbon dioxide’s effect to give a forcing of 0.6/decade, that leaves 70% of the observed increase in IR forcing to be explained by natural processes that generate the increase in water vapour. Unless, of course, IPCC is right and all of the observed increase in water vapour is feedback from CO2 and other anthropogenic GHGs!
So has Willis Eisenbach merely identified that the ‘missing heat’ is worse than we thought or am I missing something?
https://www.ipcc.ch/publications_and_data/ar4/wg1/en/ch5s5-2-2-3.html
Apol’s; *Eschenbach.
No he has quantified additional forcing from the feed-back of WV caused by rising atmospheric temps.
This is not a forcing in the sense of being anthro – which are listed in IPCC AR5 SPM.
This is feed-back that comes out of the model predictions and is not a “missing” forcing that somehow confounds that of CO2.
Thanks for clarification. Will think on that.
Toneb-
So he quantified the amount of additional WV that has been added to our atmosphere since 1988, and compared the ACTUAL amount of temperature increase that HAS resulted from that additional WV (and the additional down welling radiation caused by that additional WV) to the amount that the IPCC expected/postulated SHOULD result from that additional WV and the resulting down ward radiation caused by it (and indeed, they and the IPCC agree that there IS measurable, additional down ward radiation) and found that the increase in temperatures is far smaller than it should be…if the IPCC’s calculations/postulations/predictions/whatevertheyarebeingcalledrightnow are correct.
Which is why the result of the study (quote) “suggests that the global climate sensitivity to increased carbon dioxide, and the potential feedback mechanism of increased water vapor in Earth’s atmosphere, is actually far less than postulated by the IPCC.”
Which if true, is WONDERFUL NEWS and all who wish to save the Earth and the lifeforms living on it should rejoice!!
To Phillip, it’s suggesting that maybe the heat that they keep looking for, is not actually being created in the first place…so there’s never been any additional heat that could “go missing”. It’s like they’ve been looking high and low for the body of A. Myth, who was reported missing by some “experts”, but she never really existed in the first place.
Phillip, I added a note for you to my response to Toneb, but I’ll put it here too-
“To Phillip, it’s suggesting that maybe the heat that they keep looking for, is not actually being created in the first place…so there’s never been any additional heat that could “go missing”. It’s like they’ve been looking high and low for the body of A. Myth, who was reported missing by some “experts”, but she never really existed in the first place.”
How has the fraction-of-clear-sky data in the TPW dataset changed over the study period? Has increased TPW led to an increase in cloudiness? Because only a 1percentage point change in global average cloudiness could easily offset the increased clear-sky downwelling. –> Might be why temperatures have remained flat.
What will it take to prove that AGW theory is wrong in light of the fact that all of the claims this theory has made have failed to materialize, and the most basic premises this theory was advanced on have all not occurred.
Yet this theory lives on and the pros and cons keep being discussed.
This period in the climate not unique at all.
As I have said global cooling is now in progress and ALBEDO trumps everything when it comes to changing the climate. The smallest change will have a significant climatic impact and that is the basis for my theory as to how a solar /terrestrial items which govern the climate, that connection, will impact the climate if solar conditions are extreme enough.
Solar conditions now in the process of getting extreme in regards to solar quiet.
We shall find out soon as the climate is at a crossroads but the latest global temperature data is encouraging, temperatures still trending down as shown by WEATHER BELL temperature data.
I know ENSO effects must be taken into consideration , but I also know ENSO effects not AGW have ruled the climate over the past 30 years, with volcanic activity and atmospheric circulation changes superimposed on this factor against a back ground of high solar activity.
My bet is by spring global temperatures will be from 0 to +.2c above normal.
If El Nino should come about going forward (which is possible) global temperatures would rise but not as much as they did with the last one or for that matter the one in 1998.
OLR another very big climatic factor seemingly tied to ENSO and not CO2.
It is all going to unfold and we shall see soon.
I have a rookie question. While trying to understand just what the CERES data is I read the following in “CERES_EBAF_Ed2.8 Data Quality Summary (March 19, 2014)”. [2nd paragraph sec 1.0] says: “Despite recent improvements in satellite instrument calibration and the algorithms used to determine SW and LW outgoing top-of-atmosphere (TOA) radiative fluxes, a sizeable imbalance persists in the average global net radiation at the TOA from CERES satellite observations. With the most recent CERES Edition3 Instrument calibration improvements, the SYN1deg_Edition3 net imbalance is ~3.4 W m-2 , much larger than the expected observed ocean heating rate ~0.58 W m-2 (Loeb et al. 2012a). This imbalance is problematic in applications that use Earth Radiation Budget (ERB) data for climate model evaluation, estimations of the Earth’s annual global mean energy budget, and studies that infer meridional heat transports. The CERES Energy Balanced and Filled (EBAF) dataset uses an objective constrainment algorithm to adjust SW and LW TOA fluxes within their ranges of uncertainty to remove the inconsistency between average global net TOA flux and heat storage in the Earth-atmosphere system.”
What does this ~3.4 W m-2 ‘imbalance’ imply for the study in the head post?
link to cited paper: https://ceres.larc.nasa.gov/documents/DQ_summaries/CERES_EBAF_Ed2.8_DQS.pdf
Next to nothing. This correction almost solely affects the ABSOLUTE VALUES of SW and LW (pertaining to the accuracy of the radiometric instruments), the ANOMALIES (pertaining to their precision) hardly at all. You can verify this for yourself by comparing the CERES EBAF (Energy Balanced And Filled) global ToA LW flux anomalies with the observed ones of the CERES SYN1deg and CERES SSF1deg products:
https://ceres.larc.nasa.gov/order_data.php
Thanks for taking the time to clarify, makes sense. I have a lot to learn.
Randy: Willis’s correlation spans 150 W/m2. Adjustments of a few W/m2 are minor. (There is a separate CERES data product without these adjustment).
The multi-decade trend in TPW measured from space is more problematic. It spans multiple satellite detectors and requires a lot of processing. There presumably is a humidity record from radiosondes with which it can be compared.
Our press release was carried by AGU:
https://fallmeeting.agu.org/2016/press-item/study-at-agu-2016-challenges-conventional-wisdom-on-climate-sensitivity/
Exactly every facet of this theory is failing.
Just a detail about the term “Forcings”, which is a bit imprecise in the article.
IPCC use two different measures of forcing, namely the Radiative Forcing (RF), and the Effective Radiative Forcing (ERF).
The ERF term, which was introduced with AR5, take the readjustments of temperatures and water vapor to equilibrium into account, but the RF does not consider any surface or tropospheric readjustments.
The precise definitions are, (IPCC AR5 Chapter 8.1):
RF:
And ERF:
Before AR5 the effect of the change in water vapor was labeled as feedback, not forcing.
The forcing Anthony and Willis are discussing here is therefore the ERF.
Well, definitions are important for the understanding, and it is equally important that we stick to the same definitions.
/Jan
Dear Willis, maybe this is a dumb question. In the “Average Total Presipiitable, Ice-Free Oceans Only … figure the color scale is Kg/m2. I assume the m2 is at the Earth’s surface, but is the volume above it m2 column, a square one or is it a square column expanding each corner following the ray from center of the earth. Clearly their is a vast difference in the volume and thus the mass of the m2. In that CO2 and H20 are competing for some photons I wanted to work out the mass of air in the column and then the mass of CO2 of 4 parts in 10,000. Sticking that mass in your equation would give an upper bound for CO2 forcing.
But that upper bound would be way high as H20 is some huge multiple GHG vs CO2 per molicule. Also H20 numbers dwarf CO2 numbers where the air is far warmer and more photons are running around.
I believe estimating and comparing mass ratios, GHG factor could provide a basis of conjecture in derating the CO2 actual CO2 effects.
Outstanding analysis
tom watson
Good question Tom,
The difference between the two is small since the atmosphere is very thin compared to the radius of the Earth.
Almost all the water is located below the tropopause, and the height of the tropopause is between 9 km (at the poles) and 17 km at the equator.
Let us for simplicity say 17 km all over and compare that to the radius of the Earth (6 371 Km)
That means that 1 meter at the surface will only increase to 1.0027 meter in 17 Km height.
The area of a square meter will only be 0.54% larger than the surface in 17 km height, and the volume of the body will only be 0.27% larger than the volume of a regular prism.
/Jan
What accounts for the increase in TPW? Is it increased evaporation? Vapor from hydrocrater events?