This press conference from T of the National Snow and Ice Data Center,and , University of Bristol, in the UK was amusing. They claim that glaciers and ice sheets are melting faster due to climate change, contributing substantial volumes of water to the world’s oceans. Knowing how fast the planet is losing ice will improve projections of sea level rise and provide insights into other global and local impacts. They new database that uses the NASA/USGS Landsat satellites to track the velocity of all glaciers and ice sheets in near real-time. This new venture shows how ice velocity changes globally from season to season, and from year to year.
Call me when there is a scramble to sell Malibu beachfront homes. Leo? Anyone?
Que?
The globe is way too cold, so this is good news if it suggests that the globe is warming. However, I suspect that if we look at this data in 5 years time, it will not be so supportive of the cAGW mantra.
I fail to see how sped up glaciers indicates glacier retreat. What makes ice flow, pressure, so more ice means more pressure and more flow. There seems to be a good chance they have it entirely backwards. Glacier speeds would where there is the most snow fall bearing down on an area. If one region of Greenland gets the bulk of the snow, the other regions would slow down while that area accelerated.
Agree. Velocity is just one parameter of a multiparameter problem.
Ice mass, water discharge, and front edge retreat or advance are all important parameters to get the correct picture.
Similarly when the nearby river floods I don’t usually worry that this will cause a lack of water upstream.
.
No, it works like this:
you measure some parameter for two years. If you can find a ‘statistically significant’ change in either direction you spin an argument to link it to “climate change”. Faster, slower ; more snow, less snow it does matter, it’s always due to CO2.
Then you draw a straight line through the two dots and project it 5000y into the future and say OMG “if the current trend continues ….”
You finish with: further research is needed to monitor this crucial climate indicator which “may be” accelerating already and “could be” worse that we previously thought.
This is basic first year climatology, where have you guys been?
So faster glaciers are a sign of an increase in ice, makes sense, more ice so more pressure squeezing it to the exit point – the sea.. Hmm, that Global Warming’s a bugger isn’t it?
Also they don’t mention that near real time is actually an interpolation between two satellite passes, and therefore not exactly real time.
But it sells well.
Hahaha, Greg nailed it. So funny and so true.
Glacial speed depends on several factors. Importantly are changes in snowfall rate near the head and resistance against the ice flow. Flow resistance might come from various sources — from total elevation change from glacier head to foot; from frictional resistance to flow due to, e.g., being squeezed into a narrower channel, nature of rock surface; and from resistance against outward flow at the glacier foot, which for many Antarctic glaciers varies with the size of any ice shelf, rate of calving, melting from beneath, etc. These are all variable from glacier to glacier and over time.
I know I’m just a lowly engineer, but could the faster glacier speed be also a testament to the buildup of snow and ice. I’m thinking the flow is related to speed and area of the weir, but also the water head height. Or am I just whistling in the dark…
You are probably asking questions they hadn’t thought of.
Or were told not to think of.
(Source: Bob Edelman, who worked in aeronautic systems engineering, a very detail oriented job that combines many disciplines. He had a thirty-three year career at Boeing, beginning as a software engineer in data reduction and flight simulation and retiring as the Chief Engineer of the Electronic Systems Division,
https://wattsupwiththat.com/2007/10/04/detailed-comments-on-an-inconvenient-truth/ )
Engineers ask the right questions. “Lowly,” LOL — engineers are the best thinkers around!
In fact, calving should diminish as am ice front retreats. Since ice behaves in a plastic manner under load, increases in mass at the head of a glacier should increase the rate of advance all other ting being equal.
Janice, afaik, the calvng glacier sequence in AIT was CGI and ripped from the film The Day After Tomorrow. WUWT did a post on it but I can’t find it now.
Janice: I found this video:
[youtube https://www.youtube.com/watch?v=SnvJDwv3Z-w&w=640&h=360%5D
Nice research, Harry! Thanks for sharing.
Exactly correct, Mr. Dunnell. Actually between 2003 and 2008, the Antarctic ice mass was increasing by 82 billion tonnes per year! Only makes sense that increased glacial mass would lead to a greater rate of calving. Unfortunately glacial calving makes for some very impressive media, and unfortunately snow fall makes for very boring media coverage.
The statistic reference earlier is actually contained in a report by NASA, “Mass gains by the Antarctic ice sheet exceed losses” (Zwally et al, 2015).
https://friendsofscience.org/index.php?id=2190
Just ask if this is greater, less, or the same as 100 years ago and we can take it from there.
Yeah, just how long are their good records?
You don’t need 100y , you just take two years , draw a straight line and project if 5000y into the future to see what will happen. You guys don’t even understand the basics , do you?
Be sure to pick two years that show the trend you want to prove.
The rate at which ice melts or freezes is highly related to number of people that observe it. When more people study ice it does things faster, more dynamic, more unpredictable.
Somehow, I must reconcile this with the observation that a watched pot never boils. Too many Cooks?
(although, I must concede that one Cook can actually appear to be a consensus.)
Too many crooks.
Obviously, one is hot and the other is cold. That makes all the difference when it comes to observations.
Antarctica is a natural control for the impact of CO2 on atmospheric temperature. Ask the experts at the AGU why there has been zero temperature increase at the S Pole, even though CO2 has increased from 315 to 400ppm.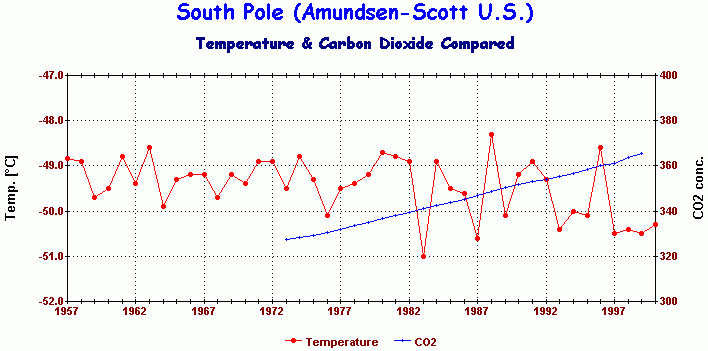
Are there corresponding temp stations at the various CO2 monitoring stations around the globe. There has to be… but I have never seen a graph like yours for the others
Intersting that there is no temp increase at the Antatartic station. I would assume that the atmospheric carrying capacity of water vapor there is low to non existent, ie no water vapor feedback influencing temps
cold air holds ALOT of water vapor
which is presumably why we get morning dew , right?
Per one of M.A. Vukcevic’s many interesting graphs, the Arctic temperature follows the Arctic geomagnetic field much more closely than the level of atmospheric carbon compounds, especially between 1940 and 1978 (see blue area). He has other graphs that show solar activity modulating the Geo field. With such a strong relationship happening in the North Pole, once can guess that a coupling relationship occurs down South.
http://www.vukcevic.talktalk.net/CO2-Arc.gif
I am really in the dark about this Arctic Geomagnetic Field. The chart ends in year 2000. Is this still tracking today, and where can I become more educated?
Cause or effect? What is the physical process that would make it cause?
Wow, that’s a striking correlation. Unfortunately as is always the case with Vuk’ we never get a link to any data to validate and take it further.
The name of an institution is not enough. I have never been able to find any of this geomagnetic data. I also want to know what processing has been done the that green line.
Does look interesting though. Thanks.
What about this: https://ngdc.noaa.gov?
NOAA;s National Geophysical Data Center was renamed or merged into National Centers for Environmental Information (NCEI).
Anthony Byrd: “I am really in the dark about this Arctic Geomagnetic Field. The chart ends in year 2000. Is this still tracking today, and where can I become more educated?”
Check out more on Vukcevik’s geomagnetic-solar correlations here:
http://www.vukcevic.talktalk.net/EarthNV.htm
The first chart on the page carries out his geomagnetic field measurements to about 2012.
M.A. Vukcevic :
Phase relationship between SOLAR and the EARTH’s MAGNETIC VARIABILITY is of the fundamental importance, when in phase oceans warm, when out of phase oceans cool.
Two magnetic signals combined (Geo-Solar cycle) closely correlate to the N. Hemisphere’s natural variability, both on decadal and multi-decadal scale.
http://www.vukcevic.talktalk.net/GSCp.gif
Per JPL/NASA: http://www.nasa.gov/topics/earth/features/earth20110309.html
Dr. J. Dickey of NASA’s Jet Propulsion Laboratory, Pasadena:
“One possibility is the movements of Earth’s core (where Earth’s magnetic field originates) might disturb Earth’s magnetic shielding of charged-particle (i.e., cosmic ray) fluxes that have been hypothesized to affect the formation of clouds. This could affect how much of the sun’s energy is reflected back to space and how much is absorbed by our planet. Other possibilities are that some other core process could be having a more indirect effect on climate, or that an external (e.g. solar) process affects the core and climate simultaneously. ”
Here’s more information on WUWT:
A link between the solar magnetic field and weather patterns on Earth may explain our lower than normal severe weather in 2013 | Watts Up With That?
https://wattsupwiththat.com/2013/10/09/a-link-between-the-solar-magnetic-field-and-weather-patterns-on-earth-may-explain-our-lower-than-normal-severe-weather-in-2013/
Greg:
“Wow, that’s a striking correlation. Unfortunately as is always the case with Vuk’ we never get a link to any data to validate and take it further. The name of an institution is not enough. I have never been able to find any of this geomagnetic data. I also want to know what processing has been done the that green line.”
I tracked down a C.C. Finlay, et al, article on “The Magnetic Field of Planet Earth” here:
http://www.igpp.ucla.edu/public/mkivelso/refs/PUBLICATIONS/Planetary%20Magnetism%202010/Hulot%20et%20Field%20Earth.pdf
Vukcevik might be accessing the data for his charts at the Institut fur Geophysik, Zurich from Finlay.
‘Ah, erm, err, um, would you mind not asking difficult questions and erm, ah, let’s see….we’ll get back to you on this just as soon as we’ve had confirmation of funds for our next 25 year long study.’
Just eyeballing it, there appears to have been cooling, especially since 1982.
Jay Dunnell writes: “…could the faster glacier speed be also a testament to the buildup of snow and ice.”
Yes, they are building up snow and ice so fast that the friction is causing heating and that’s why they’re melting away and losing mass.
Or, more likely, you’re just whistling in the dark… per wiki Average Glacier Thickness Change.
Nonsense, one ill sin.
(Source: Professor DeFreitas, Friends of Science (https://friendsofscience.org/index.php?id=3 ) in https://wattsupwiththat.com/2012/11/20/myths-and-facts-about-global-warming/ )
Agust Bjarnason:
(https://wattsupwiththat.com/2011/11/10/new-study-shows-temperature-in-greenland-significantly-warmer-than-present-several-times-in-the-last-4000-years/#comment-793097 )
Further, re: Arctic ice —
Harold Ambler:
“… Unlike the “hard hat” of land-bound glaciers in Antarctica, the Arctic sea ice is like a knit garment that is rapidly stitched together on its edges each fall and slowly pulled across the Arctic basin toward the relatively warm waters off southern Greenland. When the transited ice completes this trip, the southernmost portion of it melts, principally in late summer. It can and does take some parts of the fabric as long as a few decades to make the trip, but, again, it is a highly variable amalgam of ice, some brand new and some older, that sits atop the Arctic Ocean each winter.
More here: http://amzn.to/yLN0Zm.”
(https://wattsupwiththat.com/2012/02/05/sea-ice-arctic-circle/#comment-884947)
You really should pay more attention to NASA and NOAA:
https://www.nasa.gov/feature/goddard/nasa-study-mass-gains-of-antarctic-ice-sheet-greater-than-losses/
One of those inconvenient facts about reality is that the antarctic ice sheets have expanded their area. AGW faithful attempted to argue that the the continent was losing ice mass even as its spatial extent increased. The irrationality of the argument is self evident to anyone who actually has studied glaciology with a view to understanding ice, that “saving the world.”
They claim that glaciers and ice sheets are melting faster due to climate change….
Ask them who hid all those bodies and artifacts under the glaciers in the recent past..
…and how fast were the glaciers growing to hide all that
..and since all that’s so…why are we not just returning to normal
“Ask them who hid all those bodies and artifacts under the glaciers in the recent past…”
Wouldn’t it be better to ask the police?
And how do they explain the 4 P-38 aircraft that made an emergency landing on SE Greenland during WW2.
One was resurrected in the 90’s, 265 below the surface. See “Glacier Girl” for the story.
Snow accumulates and also melts on Greenland – the resulting loss/gain in the ice cap is the ‘surface mass balance’. but that’s only 2 thirds of the change in the mass of Greenland ice – the rest is lost through glaciers melting and calving bergs into the sea. The glaciers are losing mass faster than ever…
How do they explain Taku Glacier? Here is a picture of it pushing over an old growth forest!
http://www.poeticaperture.com/wp-content/uploads/2013/09/IMG_6130blog.jpg
Snow accumulates at the head of a glacier. As it grows thicker pressure turns it to ice. The ice then flows out from the bottom. The result is that things on the surface get pushed down, and then out.
The fact that these planes are under 265 feet of ice does not prove that the glacier is 265 feet thicker as so many want to believe. It just proves that the glacier is alive and behaving normally.
Better question: Why is Taku Glacier the only advancing glacier of the 20 major glaciers of the Juneau Icefield?
It’s all getting so tiring; they didn’t do anything except find a new way to spend millions of dollars gathering useless information for the elite warmist propagandist and bureaucrats who will use it to suck more millions out of our pockets through corruption and regulations. My opinion of course.
They are looking for funds to keep landsat 8 working, this whole 50 minutes + is an advertisement.
I do think the Amazon rain forest and what’s left of Borneo could be burned down and stripped and these fools would still be talking ice monitoring.
Ted Scambos ….Some people have ‘unfortunate’ names. They conjour up all sorts of ‘connections’.
Randy Cassingham (“This Is True” ezine) calls them, “Freaks of Nomenclature”.
I see The Next Big Thing here, a business windfall for the swiftest to jump in early. Forget commercial space flights – too risky and expensive. Think speeding GLACIER THRILL RIDES!
90% of the world’s glacial ice is found in the Antarctic, and according to NASA, the Antarctic ice cap is expanding overall. Therefore, 90% of the world’s glacial ice is increasing. 1% of the world’s glacial ice can be found in the alpine glaciers. The alpine glaciers could all melt away, and still, the world’s glacial ice is expanding overall. So where is the other 9%? – That is the ice cap on Greenland, and it is hard to know what is happening there due to all the propaganda and guessing from both sides.
Scam-bos…? You can’t make this stuff up.
And yet the rate of sea level rise has been absolutely linear with 99%+ confidence for over a century – no acceleration or correlation to atmospheric CO2.
https://tidesandcurrents.noaa.gov/sltrends/sltrends_global_station.htm?stnid=680-140
I enjoyed watching this video. One always has to look within the story. Listen to Twila from 44.30 onward. The 165 glaciers studied have robust data covering a whopping 3 seasons (yrs). She also directly correlates acceleration with ‘retreat’, Really? There are lots of question I would have liked to ask her e.g. what was the rate of deceleration on the 12 % that did so? What percentage of the SE glaciers was decelerating? What was the total area of glacial ice accelerating as compared with that decelerating? As it were all the questions from the floor involved satellite technology. Strange that.
To me this is just another useful tool that has no great value unless integrated with stuff that matters – in this case measuring melt water discharge and/or calving volumes and correlating the 2. This is pretty hard to do with satellite images. Gotta get of your butt and go into the field. Shock horror.
Disingenuous would not be inappropriate to describe this presentation.
In polar regions land-based glaciers are locked to the bedrock. Local exceptions exceptions exist in geologically active parts of western Antarctica where glaciers are being heated from below.
Glaciers in polar regions do not slide downslope. They deform under pressure imposed by gravity. Stress (force) produces strain (deformation). Increased precipitation in Antarctica has increased the stress and the strain, observed as increased glacier motion.
What is relevant is that Antarctica is losing mass in some areas near the coasts and gaining mass further from the coasts with overall net increase in mass. and you cannot demonstrate this with Landsat images.
Second, satellite estimates of the trend in sea level rise and trends estimated from worldwide tide gauges don’t match. But the satellite estimates puff up the value of Landsat imagery for this purpose. Thus, we see only the satellite estimates.
When I studied geospatial analysis, my professor pointed out the importance of ground-truthing (fieldwork) to test theories derived from satellite imagery. When you cannot do the fieldwork, some other kind of truthing is necessary, at least if you want to do science.
I have forgotten the technical term for making up a story by omitting the facts that don’t fit. Perhaps someone could remind me. (Please hold the ad hominem epithets.)
Lying by omission.
Correct. But they’re gonna’ try in 2018 with something new, because the satellites don’t show it now.
There is no doubt that glaciers, except the very highest, have been melting at a faster rate since 2000.
Read FJ Shepherd’s December 12, 2016 at 7:18 pm comment above.
What Griff knows, and what is, rarely coincide.
And if they have, Griff, so what? Who made you the glacier monitor? The guy/God who decides what the natural state of balance should be for glaciers on this planet (the one we live on, not yours)?
Thing is, Griff, in order to control the climate – which, in your hubris you really think is possible – you have to control the weather – and I’ve yet to find anyone who will admit to being able to do that.
Here are some real animations (not photoshopped like the above climate scientists use) of real Antarctic ice-shelves and glaciers.
This shows is all the bogusness regarding Antarctic ice-shelves which are all fast moving entities and appear to be growing.
The second largest one, Ronne-Filchner has grown a Massive amount since 1984.
https://earthengine.google.com/timelapse/#v=-76.56862,-58.4801,3.776,latLng&t=0.00
Pine Island Glacier is one of the fastest moving glaciers in the world and this is evident in the zoom-in. And, yeah, ice-bergs come off of a glacier moving that fast out to sea. Every ice-berg coming off this glacier is heralded by the warmers as the end-times for Antarctica.
https://earthengine.google.com/timelapse/#v=-75.1197,-99.21048,6.548,latLng&t=2.90
Larsen A and B ice-shelves which supposedly collapsed and were highlighted by James Hansen many times. They are just fast ice remnants which have almost rebuilt now.
https://earthengine.google.com/timelapse/#v=-65.09155,-60.94558,6.179,latLng&t=3.24
The largest Ross Ice-Shelf, also growing Massively out to sea. Should probably cast off some very very large ice islands soon since it has moved so far.
https://earthengine.google.com/timelapse/#v=-78.97522,-172.3322,4.029,latLng&t=3.24
Does not compute people!
https://nsidc.org/cryosphere/sotc/glacier_balance.html
“New research published in 2014 indicated that, starting in the late 1970s, glaciers “crossed an invisible line” into a declining state that cannot easily be attributed to natural causes (Marshall 2014). The study relied on multiple global climate models to simulate mass balance of glaciers worldwide, excluding Antarctica, from 1851 to 2010. The authors concluded that, for the entire period, only 25 ± 35 percent of the glacier mass loss could be attributed to anthropogenic causes, but from 1991 to 2010, the glacier mass loss increased to 69 ± 24 percent. The study found that the anthropogenic signal from 1991 to 2010 was detectable with high confidence (Marzeion et al. 2014).”
‘glacier retreat crosses a line’
http://science.sciencemag.org/content/345/6199/872
(Before you go on about models check the observed data in the NSIDC article)
‘They claim that glaciers and ice sheets are melting faster due to climate change, contributing substantial volumes of water to the world’s oceans.’
As data shows SLR linear over the past hundred years, this data proves that glacier/ice sheet melt does not contribute to sea level AT ALL.
It seems that when talking Climate Change™, one doesn’t need to consider the implications of what they are saying.
http://oceanservice.noaa.gov/facts/sealevel.html
“Global sea level has been rising at an increasing rate since the 20th century. Analysis of a global network of tide gauge records shows that sea level has been rising at the rate of about 0.6 inches per decade since 1900. Since 1992, satellite altimeters indicate that the rate of rise has increased to 1.2 inches per decade—a significantly larger rate than at any other time over the last 2000 years.”
and at the current rate, it will be six centuries before sea level returns to levels 4-6000 years ago. So what?
We aren’t living 4 to 6 thousand years ago.
In the last 6000 years we built a lot of cities at the (then) sea level
Grif you just made a huge admission against your case.
Bs, Grif
. slr has not increased when subsidence and rebind is taken into account. Every claim you make to the contrary, as has been pointed out with evidence, is based on massagefu and messaged data. That you persist in misrepresentation of this says much about you and the cause you are so strangely fixated on.
Griffie, how many buildings do you expect to last for 600 years? Especially modern ones.
When the current ones get to old to be worth repairing anymore, we tear them down and build them some place a couple inches higher.
Simple problem, simple solution. Too bad you are too simple to see it.
PS: That assumes that the current rate of increase continues in a cooling world.
Why shift from tide gauge records to satellite altimeters? They aren’t measuring the same thing, as you certainly should know. Further, it’s nonsensical to claim that the satellite altimeter rate since 1992 is “significantly larger rate than at any other time over the last 2000 years.” We don’t have satellite altimeter rates going back 2000 years.
Sea level rise only matters at the coast. There are many tide gauge records that go back well past 1992. Can you identify any gauges that you find particularly alarming?
‘PS: That assumes that the current rate of increase continues in a cooling world.’
And that assumes sea level is a function of temperature, rather than the size of the basin.
So where did the snow for the glacier basins come from? The oceans. Are glaciers flowing or receding?
anything like credible evidence of the glacier basins draining out? No. Apparently ice mass is increasing. So this is another example of the correlation between fake news and climate change news.
The physics of glacier movement are simple. A force (weight due to gravity) acts on an object to overcome static friction (the rough surface of the ground on which the glacier sits). Movement occurs due to two factors – the malleability of the ice and lubrication provided by a thin layer of water at the interface.
The water is there because the ice melts when in contact with the earth, which is CONSTANTLY radiating heat due to the generation of heat inside the earth, which radiates outward (Newton’s Law of Cooling). It is called ‘geothermal heat’, and is the reason that the deeper one digs the warmer things get.
Glaciers are constantly melting from the bottom up, regardless of the amount of melting/sublimation that occurs at the top.
Heat flow is constant and pretty close to uniform throughout the earth’s surface. (There are places with more than average heat flow because a magma plume is underneath. There are also areas with less than average heat flow because of the underlying geology.)
Ice is a pretty good insulator. So it prevents heat from escaping, as a result the area under the glacier will warm up until the amount of heat going out equals the amount of heat coming in.