From the UNIVERSITY OF COLORADO AT BOULDER and the “one month does not a trend make” department, notice that there is still plenty of ice in the Arctic as shown in the image provided with the press release. It’s weather folks, but do remember this moment the next time we get a record high Arctic sea ice extent, the same people that are caterwauling on Twitter right now about this will tell you that it doesn’t matter. At least NSIDC director Mark Serreze didn’t repeat his “The Arctic is screaming” and “death spiral” rhetoric.
Also note that before we had real-time satellite data to fret over and the Internet, the world would go on without a care.
Sea ice hit record lows in November

Unusually high air temperatures and a warm ocean have led to a record low Arctic sea ice extent for November, according to scientists at the National Snow and Ice Data Center (NSIDC) at the University of Colorado Boulder. In the Southern Hemisphere, Antarctic sea ice extent also hit a record low for the month, caused by moderately warm temperatures and a rapid shift in circumpolar winds.
“It looks like a triple whammy–a warm ocean, a warm atmosphere, and a wind pattern all working against the ice in the Arctic,” said NSIDC director Mark Serreze.
Arctic sea ice extent averaged 9.08 million square kilometers (3.51 million square miles) for November, 1.95 million square kilometers (753,000 square miles) below the 1981 to 2010 long-term average for the month. Although the rate of Arctic ice growth was slightly faster than average, total extent actually decreased for a brief period in the middle of the month. The decrease in extent measured 50,000 square kilometers (19,300 square miles) and was observed mostly in the Barents Sea, an area of the Arctic Ocean north of Norway, Finland, and Eastern Russia.
NSIDC scientists said the decrease in extent is almost unprecedented for November in the satellite record; a less pronounced and brief retreat of 14,000 square kilometers (5,400 square miles) happened in 2013. November 2016 is now the seventh month this year to have hit a record low extent in the 38-year satellite monitoring period. The November extent was 3.2 standard deviations below the long-term average, a larger departure than observed in September 2012 when the Arctic summer minimum extent hit a record low.
Arctic sea ice is still in the early stages of winter freeze-up and is expected to continue expanding until it hits its maximum extent around March next year.
NSIDC scientists said unusually high temperatures over the Arctic Ocean, persistent winds from the south, and a warm ocean worked together to drive the record low Arctic extent. Extending from northeast of Greenland towards Svalbard and Severnaya Zemlya, air temperatures at the 925 hPa level (about 2,500 feet above sea level) were up to 10 degrees Celsius (18 degrees Fahrenheit) above the 1981 to 2010 long-term average for the month. Sea surface temperatures in the Barents and Kara Seas remained unusually high, up to 4 degrees Celsius (7 degrees Fahrenheit) above average around Novaya Zemlya and Svalbard, preventing ice formation. These high temperatures reflected a pattern of winds from the south, which also helped to push the ice northward and reduce the ice extent.
NSIDC scientist Julienne Stroeve was in Svalbard during November and noted the lack of sea ice. “Typically sea ice begins to form in the fjords at the beginning of November, but this year there was no ice to be found,” she said.
In the Southern Hemisphere, sea ice surrounding the continent of Antarctica declined very quickly early in the month and set a record low. The average extent for November was 14.54 million square kilometers (5.61 million square miles), 1.81 million square kilometers (699,000 square miles) below the 1981 to 2010 average. This was more than twice the previous record departure from average set in November 1986 and was 5.7 standard deviations below the long-term average.
NSIDC scientists said that higher-than-average temperatures and a rapid shift in Antarctic circumpolar winds appear to have caused the rapid decline in Antarctic sea ice.
Air temperatures 2 to 4 degrees Celsius, or 4 to 7 degrees Fahrenheit) higher than average and an earlier pattern of strong westerly winds worked to create a more dispersed sea ice pack in the Antarctic. A rapid shift to a more varied wind structure, with three major areas of winds from the north, rapidly compressed low-concentration sea ice around Wilkes Land, Dronning Maud Land, Enderby Land, and the Antarctic Peninsula. Moreover, several very large polynyas (areas of open water within the pack) have opened in the eastern Weddell and along the Amundsen Sea and Ross Sea coast.
“Antarctic sea ice really went down the rabbit hole this time,” said NSIDC lead scientist Ted Scambos. “There are a few things we can say about what happened, but we need to look deeper.”
NASA scientist and NSIDC affiliate scientist Walt Meier said, “The Arctic has typically been where the most interest lies, but this month, the Antarctic has flipped the script and it is southern sea ice that is surprising us.”
###
Would it be reasonable to assert that the record cold air that just came down from Alaska, and yielded record snowfall onto Chicago last night was the result of heat extraction into the polar ice cap. It seems like an energy balance situation to me. Some ice is missing from the arctic but snow is falling in the Midwest now. I am preempting the ” weather is not climate” claims. I seem to be a pattern. Low sea ice = cold winters across the northern hemisphere..
Yes, the current state of the arctic is responsible for the cold air spilling out over the US and Siberia… but it doesn’t balance out.
Show your math.
Please let me help with ball park estimates:
Colder than usual:
Land area of NH: 98.47 million mi²
Warmer than usual:
Area of Arctic Ocean: 5.427 million mi²
The Arctic anomaly isn’t 18 times warmer than the NH land anomaly is colder than “normal”. Throw in the fact that the Pacific Ocean now has a cold blob, and overall I’d say the temperate zone chill outweighs the anomalous Arctic relative “warmth”.
The Atlantic current moved a lot of warm water up and into the NWP and then into Arctic currents…that is now escaping….keeping arctic air not as cold….warm air rises, cold air falls and settles
In order for the Arctic air to be that much above “average”…it had to loose a lot of heat from the water
Warmer than usual:
Area of Arctic Ocean: 5.427 million mi²
===
don’t forget land is surface……ocean is depth….
Oosp!
Land area of NH closer to 40 million sq. miles. Still over seven times the area of the Arctic Ocean. And the figure for total area of the NH still matters, since most of it is now colder than “normal”, unlike the Arctic.
Latitude
December 7, 2016 at 9:55 am
True, but it’s only the surface of the Arctic Ocean that’s warmer than usual, and the air above it. As it’s rapidly losing heat to the air, ice should form quickly and catch up to “normal” winter extent.
Typo cuz it’s so cold in my office. Will probably hit single digits F here tonight.
if you mean surface down to 700m….yes
..that’s way too much water for air or sun to affect it
You can trace the AMO moving into the NWP here.
http://www.climate4you.com/images/NODC%20BarentsSeaOceanicHeatContent0-700mSince1955%20With37monthRunningAverage.gif
Actually the area of below-normal during Eurasia’s extremely cold November was actually far larger than the Arctic Sea.
It is in my eyes a fascinating pattern, and well worth studying without thinking we have answers beforehand. I have my hunches about causes, but likely it is best to bite our tongues and simply observe. As I commented elsewhere:
I’ve been watching the situation up there all autumn, and there actually has been the import of milder-than-normal air up that way, hand in hand with the export of colder-than-normal air south. If it is thirty-above-normal at the Pole it is balanced by it being thirty-below normal in Eurasia.
It seems to me that if you want the planet to warm up you would want the milder air to stay further south, changing snow to rain and keeping the snow-cover further north. The further south the snow-line comes the more sunshine it reflects during the day, and the more radiational cooling “creates cold” during the night, which makes the winter worse. Also any “heat” sent north to the Pole is soon too chilled to melt any ice, and the heat is basically squandered to outer space.
It makes me nervous that the current pattern is losing so much heat to outer space, up at the Pole. Even when the AO is positive there seems to be a low pressure up there, like the whirlpool over a drain in a bathtub, indicating (to me at least) the air is constantly rising to lose heat up at the tropospause. I wonder if this pattern is brought on by the “Quiet Sun”, and is indicative of our planet being drained of heat as it moves to a Little Ice Age.
The so-called “climate scientists” really seem shallow to me, and to scan the surface of earth for warm places, never thinking any deeper than a sound bite.
The extreme cold at lower latitudes looks like it is now shifting from Asia to North America. Now it’s my turn to shudder. However that little drain up at the Pole keeps draining, now starting to suck its heat from the Pacific side.
https://sunriseswansong.wordpress.com/2016/12/05/arctic-sea-ice-the-long-arm-of-the-ralph/
Still not understand the difference between climate and weather, Grifter?
Of course it balances. How silly of you. It *always* balances.
“but it doesn’t balance out.”
Wow , Griff was correct .. first time for everything.
The cool patches far outweigh the warmer patches.
The state of the Arctic sea ice has little to do with the flow of the surface winds moving into or out of the region, in my opinion. That can be seen readily enough by observing the wind changes over time…https://earth.nullschool.net/#current/wind/surface/level/orthographic=-98.57,90.09,497
The same holds true for the Antarctic sea ice extent. I noticed the rapid drop last year, and as a result started paying more attention to surface wind movements. It could be seen that streams of warm moist surface winds flowing from a start point of 30S or 40S were pushing close to the edge of the continent and over the sea ice. Where ever that pattern pushed into the continent, the surrounding sea ice would then be pushed back in that area. I found that I could anticipate where changes to the sea ice boundaries would be taking place just by looking at the surface wind flows using earthnullschool. Currently, the sea ice extent is down below average as there are multiple rotations pulling warmer surface winds across the leading edge of the sea ice. This is the change that started around August of last year. Prior to that it was normal to see, for the 3 years I had been observing, a buffer area protecting the sea ice from encroaching winds..https://earth.nullschool.net/#current/wind/surface/level/orthographic=-98.57,90.09,497
“Please let me help with ball park estimates: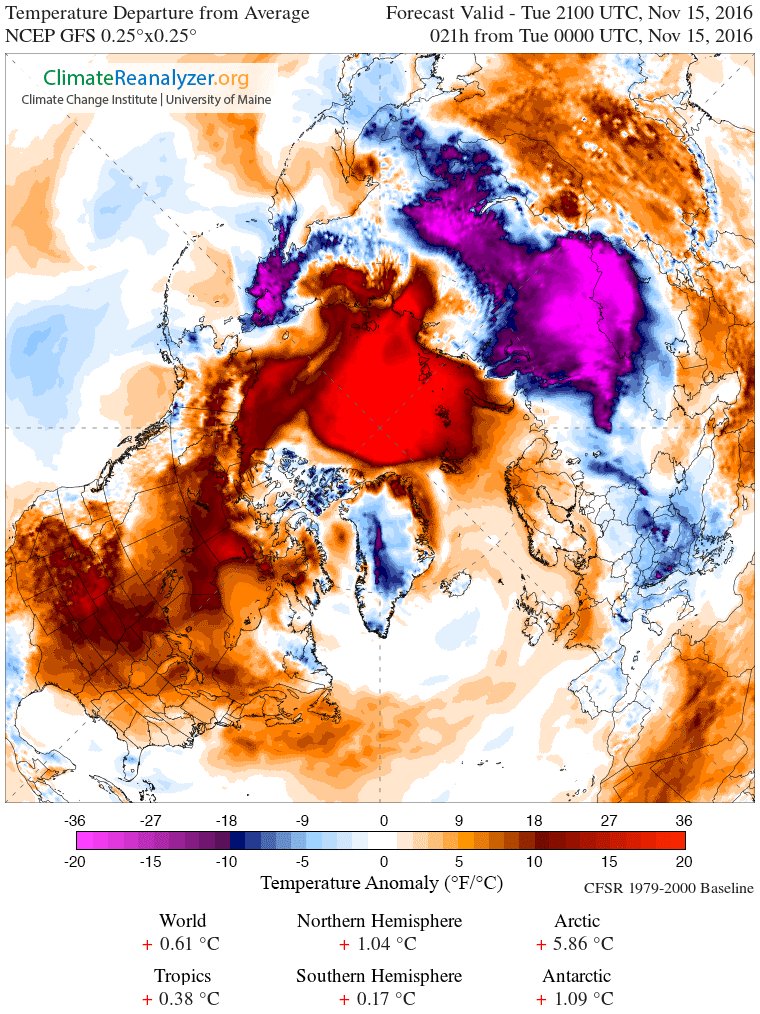
Colder than usual:
Land area of NH: 98.47 million mi²
Warmer than usual:
Area of Arctic Ocean: 5.427 million mi²
The Arctic anomaly isn’t 18 times warmer than the NH land anomaly is colder than “normal”. Throw in the fact that the Pacific Ocean now has a cold blob, and overall I’d say the temperate zone chill outweighs the anomalous Arctic relative “warmth”.”
Nope.
We are talking of Russia/Siberia.
Nothing like the size of the NH land-mass.
Also the Pacific cold-blob is likely due to the very cold westerlies exiting siberia and cooling said “Blob”.
“overall I’d say the temperate zone chill outweighs the anomalous Arctic”
Certainly not (This is the picture at mid-Nov – when the Rose bollocks was published)…..
Tone,
Your image is from Nov 15.
maybe all the ice is there: <a=href="http://www.dmi.dk/en/groenland/maalinger/greenland-ice-sheet-surface-mass-budget/"on Greenland
there 2016 had some all time low melting events and is the accumulation off the charts with an all time record high for the same period….
they are indeed the whole year very silent about greenland….
And now connect your statement with the article here: https://wattsupwiththat.com/2016/12/05/despite-denial-data-shows-global-temperatures-are-dropping-fast/
(it meant global LAND temperatures are dropping fast)
Frederik Michiels December 8, 2016 at 12:50 am
…maybe all the ice is there:
http://www.dmi.dk/uploads/tx_dmidatastore/webservice/b/m/s/y/a/todaysmb.png
The difference between this year’s lower melting and that of 2011/12, in comparison with a yearly average melt around 200 gigatons (or km³, if you prefer) per year, is hardly measurable.
“Your image is from Nov 15.”
Yes I know it is.
The *article* Rose published comes from RSS TLT data prior to that.
That is why I posted i.
@Bindidon
so an anomaly of +100 gigaton (or in short 100km³) is hardly measurable? hmmmmmm
does the same add up for all the heat we’re losing right now? (ice is an insulator so no sea ice= net heat loss.
The more i see this odd pattern progress (below average cold on land and above average warmth above sea) the more i am starting to have a gut feeling saying that now the heat balance is turning negative….
especially when that “cold blob” should be normally a warm blob in the aftermath of an el nino is something i find very “off the mark”
Last week’s Joe Bastardi has a whole section on the “Balance”. He calls it the bath tub slosh. it is very good I remember the 62 -63 winter it started very much the same as this year so be warned it is going to get cold!
Thanks for the Joe Bastardi tip… Energy is conserved so the “cold” has to go somewhere.
Very temporary (2 weeks) cold blob in Siberia does not prevent, ice growth in the arctic, where the warmth has continued uninterrupted (here is a forecast for then next week: https://sites.google.com/site/arcticseaicegraphs/forecasts).
the issue is: the cold that “should be on the north pole” is around it and imvho that’s a very bad sign…..
paul,this site may interest you: -globalwarmingdenier.wordpress.com / water=more ice/
thanks!
And they forgot to add this- The low sea ice levels has nothing to do with global man made warming.
I added it for them.
Ummm….what global man made warming?
We still have a lot to learn about ocean cycles, climate, and polar region response to ocean cycles. I rather doubt the learning will come from NSIDC though.
Wait! I though it was supposed to be ice-free by now, two years ago even.
No, just down to 1 Whadam.
Do do mean a Wadham?
I thought that was a unit of measure for panic levels.
1 Wadham = 1 million km²
Sounds reasonable, then david Letterman could advertise “Bigass Wadhams”
You won’t need to wait much longer.
Hehehe!
Of course we won’t, Tony! Of course we won’t!
You know, it’s funny, I think I’ve heard that before…
The lack of normal ice cover just means the Arctic is exporting more ocean heat to space than it usually does this time of year. That may contribute further to the rapid decline in global temp from the 2015-16 El Nino peak noted by David Rose and James Delingpole last week that got the warmunists so exercised. Paul Homewood posted today a nice take down of the Weather Channel spin on Delingpole’s Breitbart article.
while I have the utmost respect for most of ristvan’s comments here, I reject of all talk of “normal” when we only have data from 35y of a system with a strong circa 60 periodicity. We have just witnessed the warmest half of the 60 y variation which one would expect to show progressive melting. We have NO IDEA what “normal” or “average” ice cover is.
while I have the utmost respect for most of ristvan’s comments here, I reject of all talk of “normal” when we only have data from 35y of a system with a strong circa 60 periodicity. We have just witnessed the warmest half of the 60 y variation which one would expect to show progressive melting. We have NO IDEA what “normal” or “average” ice cover is.
Normal and ideal Arctic ice cover occurred in 1979, don’t you know. Coincidentally, 1979 was when the satellite coverage was alleged to have started. Satellite coverage before 1979 was “disappeared”.
“exercised” – that’s a good name for it.
Every time I excercise, I heat up. Perhaps that’s what’s happened to the arctic.
Maybe it was more “massaged” by the warm blob and the AMO.
Sorry, couldn’t resist…
Paul Homewood’s article
https://notalotofpeopleknowthat.wordpress.com/2016/12/07/note-to-weather-channel-please-get-your-facts-right/
Is good.
More cooling with open water-and more snow that will fall and accumulate and later become freshwater easier to form ice.
Look at Greenland’s mass balance.
It all cools!
A couple of years ago I wrote a long article on the warming of the arctic in the 1920 to 1940 period.
https://wattsupwiththat.com/2014/08/22/historic-variations-in-arctic-sea-ice-part-two/
There are numerous references in the addendum
What came over was that there was unusual summer melting in the arctic in that period, and much of the winter season continued this theme with higher than average temperatures. I aso collected a variety of Antarctic references ( the regions is much less documented) which also showed considerable melting. For it to occur around both ice caps at the same time was unusual.
As we can not compare like for like with satellite records it is difficult to know how extensive the current melting, or failure to freeze, is, compared to other historic periods.
It is certainly unusual however and it will not be until the end of march next year that we wil see how badly the ice has been affected and it will be next September when we will be able to tell if the limited early winter freeze up this year has had a dramatic effect or not.
The national geographic reported last month that the region had been very affected by a foehn type wind. Anyone who goes skiing will know the damage this warm wind can do to an ice or snow pack. Whether this has had any materal affect or not is supposition at present
No doubt the scientists will be looking at this winters events closely in order to be able to determine the various causes.
Tonyb
the warming of the arctic in the 1920 to 1940 period….
If it didn’t it would have been a miracle……the AMO and PDO just happened to be in sync exactly from 1920 to 1940
http://homework.uoregon.edu/pub/blogs/g2.png
And notice the doubly frigid conditions which produced the infamously cold winters of the 1960s and ’70s. Also the cold cycle of the 1890s to 1910s, which preceded the warm cycle of the 1920s to ’40s.
Ocean oscillations correlate far better with the temperature record than does CO2, which rose during the long, cold decades during the mid ’40s to late ’70s.
Huge tracts of open water along the north Siberian coast allowed early snow deposition on its shores. The resulting albedo switch created the coldest October on record in north east China. Even today the remaining open water between Alaska and Siberia is adding snow to northeastern China. The resulting expansion of the polar high will mean a very cold winter for the Northern Hemisphere. A flattening out of the jet stream, courtesy of the forming La Niña should generate a series of snowstorms alone it’s path. A more detailed winter forecast can be found on the media page of colderside.com.
Nice fun fact……..here’s a few more……….Banging your head against a wall burns 150 calories an hour…….In February 2006, the phrase “to understand and protect the home planet” was quietly removed from NASA’s official mission statement.
The temperature has been very warm north of 80 this fall. link It’s not surprising that the ice isn’t building up as fast as normal.
Climate4you shows that the total sea ice is low because of the Antarctic, not arctic which is about average and higher than 2012 & 2007.
In which case they’re wrong since extent is about 3 standard deviations below average at both the arctic and antarctic. The arctic is over 800,000 sq km below 2012 and 2007 today, (NSIDC)
Nicholas Schroeder on December 7, 2016 at 9:21 am
Climate4you shows that the total sea ice is low because of the Antarctic, not arctic which is about average and higher than 2012 & 2007.
Who would trust Ole Humlum? Here is what I consider a bit more trustworthy (JAXA and NSIDC, published by Nick Stokes at moyhu):
https://s3-us-west-1.amazonaws.com/www.moyhu.org/blog/polview.html
“Also note that before we had real-time satellite data to fret over and the Internet, the world would go on without a care.”
That may be right, but are you saying it is good to stay ignorant? Is it better for the man with cancer to stay away from the doctor so he can believe in his own mind he is well? My vote is to be as informed as we can.
I think this guy gives a pretty good breakdown of why we should know and we should care. After all it’s not just ice up/down there…..
A little bit less ice than last year, is the equivalent to having cancer?
Sheesh.
MarkW December 7, 2016 at 9:45 am
A little bit less ice than last year, is the equivalent to having cancer?
Sheesh.
A little bit each year, adds up to a lot bit over a number of years. It’s really not that complicated. So you are not concerned? If the current course of decline carries on, will you be happy to tell the generations that follow ….” well yes of course we had the technology, but we chose not to use it because it was giving us bad news.”
Simon: “So you are not concerned?”
Nope, not even slightly.
The sooner the better, in fact.
Bring it on!
Simon,
Why do you think that less Arctic sea ice is a bad thing?
Bowhead whales predate the Pleistocene and thrived during the Holocene Optimum, which narwhals and belugas also survived.
So, what’s the worry?
PS: The Ladoga seal is a land-locked, freshwater subspecies of the ringed seal, which evolved during the Holocene. Thus, ringed seals, polar bear prey, will likewise have no trouble surviving an Arctic with less ice. There will still be landfast ice in late winter on which they can build their snow lairs and give birth.
So the ice is a little bit less than it was during the coldest period of the last 100 years.
Yes, I’m not concerned.
Especially considering the fact that less ice in the arctic is one of the strongest negative feedbacks we got.
When we get another cold PDO/AMO cycle, the ice will return to what you consider normal. So there is not the slightest bit of evidence that there is anything to worry about.
Regardless, as others have pointed out, less ice in the arctic is a good thing. It makes getting to the resources up there much easier.
So who is “this guy”?
When he opens up by declaring that soon there will be no sea ice left in the summer we see what kind of scientist he is. He carries on making lots of spacious claims from the usual alarmist mantra.
He seems to have some real experience in the detail of on the ground research, he should stick to what he knows and refrain from the usual, speculative, unscientific, long term projections.
He says they have only just discovered that sea ice coverage plays a key role in CO2 transfers, so clearly they have very little understanding of the fundamental processes and feedbacks. They will also have to remark that the supposed “tipping point” caused by more open water leading to more heat input is simply not borne out by the evidence since 2007.
Sea ice min. this year was indistinguishable from 2007 : that’s a decade of “death spiral” that has gone nowhere. The conclusion from that should be more likely that open water causes a negative feedback and more cooling. This is also supported by the 45% recovery in sea ice volume measured by Cryosat2 in 2013 following the OMG, all time low of 2012.
His claim that “soon” there will be no sea ice in the summer is based on drawing a staight line through all the data and assuming nothing changes. It just does not stand up.
This Ted talk seems to be implying that the change in sea ice coverage is a negative stress that will be generally bad for Arctic life. He could not possibly know such a thing. Scientists should make NO such assumption, but if they did, a positive overall impact is probably much more likely. Sure, the melting of sea ice represents a change to the ecosystem. But winter and ice are the dead times in most biomes around the globe. Spring and summer, with more heat, open water and growing plant life are the healthy, productive times. Winter is for hunkering down and surviving lean times for most species. Polar bears will thrive if there is less sea ice, too. Their sense of smell and mobility make them deadly to land-based baby seals. Polar bears don’t go out on the ice because they like ice. They go on the ice because the seals like ice for birthing their pups. Too, there will be more net primary production by phytoplankton in open water vs. water covered by sea ice. This creates a bigger long term CO2 sink than ice-covered water, causing a long term cyclical balance back to colder water and more ice. But while it lasts, it probably will temporarily increase the Arctic’s carrying capacity for cetaceans and all other sea life that depend on phytoplankton anywhere downstream in their food chain.
Jeez, I think we need Dr. Tim Ball and Dr. Susan Crockford to come in and educate these Arctic ice Ted scientists and at least get them to a more neutral position from which to begin their research.
They assume that any change is by definition bad. Actual science isn’t necessary.
Sounds like you will digest anything he says. I have been there and am not surprised by some of what he said. What is surprising is how ignorant he can be when talking about rotten ice and not being able to find ice strong enough to put men on. Obviously he covered only a small part of the Arctic.
He talks about all this rotten ice and multi year ice decreasing. He has not paid attention, multi year ice is increasing and will continue to do so.
He talks about doing research for 30 years. Wow! The Arctic has been around for thousands of years. He started at the top of the cold cycle. They only use measurements of ice area since 1979, but have left out the early 70’s when there was less ice. the Arctic ice cycles in 70 year periods so he has been studying it for almost half a cycle. but he is an expert so the gullible must listen. What happened in the warm years of the 1930’s and 1940’s? He can speculate but cannot give you a good answer.
He is the same person who said the Arctic will be ice free in the summer of 2008 (rotten ice)
North Pole May Be Ice-Free for First Time This Summer
Aalok Mehta aboard the C.C.G.S. Amundsen
National Geographic News
June 20, 2008
Arctic warming has become so dramatic that the North Pole may melt this summer, report scientists studying the effects of climate change in the field.
“We’re actually projecting this year that the North Pole may be free of ice for the first time [in history],” David Barber, of the University of Manitoba, told National Geographic News aboard the C.C.G.S. Amundsen, a Canadian research icebreaker.
There is a conference on the Arctic in Winnipeg this week. Appears they have some better experts: Read:
http://www.winnipegfreepress.com/local/climate-change-on-fast-forward-in-arctic-u-of-m-scientist-warns-405091456.html
Some lead scientist named Ferguson now claims that Hudson Bay will have ice free WINTERS in 5 to 10 years.
Has Dave Barber beat that one?
Arctic conference in Winnipeg…………………..Let’s hope that Tim Ball takes a stroll over to set them straight.
I saw that presentation. I was NOT impressed. There was zero reconciliation of prior warm periods that caused observers to write about a lack of ice in the Arctic. In fact, the literature of 1820, 1920, 1939 heralds the Arctic as becoming “ice free”.
The good Professor should have been rebuked for that, but was not.
Pathetic. That’s not science, its hucksterism.
Arctic ice growth is behind, but is surging now.
http://rclutz.wordpress.com/2016/11/30/surging-arctic-ice-nov-30/
Arctic sea ice will catch up to “normal” later this winter.
Something similar is happening in both hemispheres. As noted by many, and currently experienced by me, frigid WX and snow over NH land masses is from air which would usually be over the Arctic Ocean. That will change, although the pattern is forecast to persist at least into next week where I live.
I say it’s similar in the SH because southern South America is also currently colder than usual for late spring, while the Southern Ocean is anomalously warm, thanks to the after effects of the super El Nino. Winds off the continental Antarctic ice sheets are also driving the more rapid than usual melting of sea ice.
It’s just weather and will create conditions for more rapid sea ice formation, as the Arctic Ocean has lost so much heat. The Antarctic might reach its minimal sea ice extent earlier than usual, but that extent might not be anything special. The multidecadal trend remains growing sea ice extent, contrary to CACA adherents’ predictions.
Agreed, since Antarctic sea ice is surrounded by water, it pretty much melts out every year. During the winter, up to 18 million square kilometers (6.9 million square miles) of ocean is covered by sea ice, but by the end of summer, only about 3 million square kilometers (1.1 million square miles) of sea ice remain. This year it went down to 2.6 million, 9th lowest and well within normal variability.
Chimp December 7, 2016 at 9:42 am
Arctic sea ice will catch up to “normal” later this winter.
Unlikely, so far the freezing season in the arctic has forgone ~700 freezing degree days, that would have resulted in ~0.3m of additional ice thickness. As a result the ice is expected to be thinner in the spring and therefore could have a ‘knock on’ effect next summer.
The thermodynamic relationship due to Lebedev, would suggest that new ice would by now be on average
1.16 m thick by this date, whereas it implies that new ice will be 0.78 m thick now.
I wonder if Jupiter’s great spot is something akin to ENSO?
Regarding the Antarctic sea ice, this is going to blow your mind.
Probably the wrong thread but this is amazing footage of the Antarctic Glaciers.
There is a really cool new Google Earth feature now where you can rapidly animate basically any place on the planet over the last 32 years, all the way back to 1984.
It opens in default mode over Miami but you can quickly move to any place on the planet or type a location in the search bar to zoom-in. Bookmark this page.
https://earthengine.google.com/timelapse/
However, what it also shows is all the bogusness regarding Antarctic ice-shelves which are all fast moving entities and appear to be growing.
The second largest one, Ronne-Filchner has grown a Massive amount since 1984.
https://earthengine.google.com/timelapse/#v=-76.56862,-58.4801,3.776,latLng&t=0.00
Pine Island Glacier is one of the fastest moving glaciers in the world and this is evident in the zoom-in. And, yeah, ice-bergs come off of a glacier moving that fast out to sea. Every ice-berg coming off this glacier is heralded by the warmers as the end-times for Antarctica.
https://earthengine.google.com/timelapse/#v=-75.1197,-99.21048,6.548,latLng&t=2.90
Larsen A and B ice-shelves which supposedly collapsed and were highlighted by James Hansen many times. They are just fast ice remnants which have almost rebuilt now.
https://earthengine.google.com/timelapse/#v=-65.09155,-60.94558,6.179,latLng&t=3.24
The largest Ross Ice-Shelf, also growing Massively out to sea. Should probably cast off some very very large ice islands soon since it has moved so far.
https://earthengine.google.com/timelapse/#v=-78.97522,-172.3322,4.029,latLng&t=3.24
Does not compute people!
No it isn’t surging…
If anything it is slowing again
Let’s see where it is at year end, close to average I’m guessing, according the MASIE, the most accurate ice extent dataset.
Yes, no tend at all… =)
http://nsidc.org/arcticseaicenews/files/1999/12/monthly_ice_11_NH.png
Sarat
Misrepresentation exaggeration from truncated manipulated y-axis scaling.
Nice work Sarat, now lets look at every other month of the year too.
Sept min was same as 2007 and significantly greater than 2012, why does November “matter” except that it fits the agenda.
It matters for the next freezing season? Using that thinking why does anything matter, why does the fact that that global temperature in October was cooler in than September? # weather
DMI has a different take on Arctic sea ice. It does not show such as much loss as NSIDC is showing. ..http://ocean.dmi.dk/arctic/icecover.uk.php
Average sea ice area for last 10 years.
Sarat, you have managed to prove that there is less ice now than there was during the coldest period on this planet over the last 100 years.
Now prove why you believe this should matter.
AndyG55 December 7, 2016 at 1:11 pm
Average sea ice area for last 10 years.
In your fit what is x?
Actually, its only the new ice that has been struggling because of this weather event.
Mid-thickness sea ice levels are increased from previous years.
Good point. March maximum will be interesting.
There is a lot of ice missing on the periphery, also the grouping of thicker ice in the middle of is in position to get exported through farm into the warmer Atlantic over the winter.
Sarat,
By missing ice around the periphery, do you mean around Nunavut? Why no, you don’t. There is a considerable amount of 5M+ thick ice around Nunavut and northern Greenland, an amount much greater than what existed in 2012.
Your attempt to rationalize the disaster agenda by cherry picking information is your own undoing, by your own graphs.
There is always a short term bumps in Arctic ice coverage. Since the 2016 we see that they are more pronounced with sharper troughs that usual. I have often hypothesised that this is probably tidal driven variation.
The stronger ripple we are currently seeing is probably linked to the “supermoon” events with perigee full moons in sept, oct and november.
Also note the recent spate of earthquakes.
Lunar orbit is currently a the highest eccentricity for several decades and 14 days after closest approach there is apogee with the lowest tidal forces. That is a change of about 15% in just two weeks a very rapid change in stress in geological terms.
The liquid earth will not stand stress and will flow. Remembering that tides are basically horizontal, not vertical. displacement of water it would not be surprising for this to have a notable affect on the distribution of floating lumps of sea ice which is what sea ice extent is measuring.
“Lunar orbit is currently a the highest eccentricity”
Caused by CO2, no doubt.
No, this is due to climate change…. the current extent is not just low but a record low way below 2012 in extent and volume.
Griff…..”No, this is due to climate change”
Are you referring to Natural Climate Change or the Global Warming Climate Change. If the latter, how did you separate the Natural molecules from the human generated molecules to obtain your decision?
“No, this is due to climate change”
More alarmist nonsense form our resident paid propagandist.
Why do you keep making an utter fool of yourself, have you no shame?
And here is a nice visual for what Griff said about volume:
http://iwantsomeproof.com/extimg/siv_annual_polar_graph.png
WRONG again, Griff.
The current low is less than 1 Wadham below the previous minimum for this day. 10.51 Wadhams (11.23 Wadhams, in 2010)
Now since we are told that 1 Wadham is effectively zero, then there is effectively ZERO difference between now and the previous minimum.
typo.. previous low was 11.25 not 11.23.
ps. does anyone know the error margin on sea ice area calculations ?
Sarat: “And here is a nice visual for what Griff said about volume:”
From which we can observe that despite the fairly significant decrease in ice coverage, the reduction in ice volume is much smaller…
Thank you!
Wow, Griffie now claims to be an expert. This is caused by CO2 and CO2 alone. How does he know? Who cares, Griffie says so, so it must be true.
PS, your precious record only goes back just over 30 years, so it’s a pretty meaningless number.
But who cares, Griffie said it so it must be true.
I wonder if the perigee high tides are emphasized in the higher latitudes when we have high eccentricity as well?
If water is drawn towards the equator by they sum of solar and peak lunar forcing, where is it going to come from ? Maybe mid latitudes, in which case there could be pole to equator standing waves and modulation of major ocean currents.
The lunar eccentricity varies in a predictable way with a cycle of 200 days or so, and is no higher or lower this year than earlier. It’s laughable to suggest that it could somehow be responsible for thousands of square kilometres of missing ice
Richard… Nobody said that or suggested that. It was all you.
the exact spot on the planet where the greatest effect of the moon is felt is also very important i feel. if over land the result is very different to over ocean. we had 6 low tides in a row on the last set of full moons that were identical in size on my local harbour on the east coast of scotland. not a phenomena i can find any record of happening previously.
despite the supermoon the largest tide on the last springs was 0.4m smaller in range than a typical max spring of 6m on my stretch of coast. this is a huge amount of water moving somewhere else due to the location of max tidal force . certainly enough to alter major currents .
On the sea ice reference page on this website, much of the monitoring of sea ice seems to have gone haywire, with obviously wrong figures and graphs.
Can someone please explain what has happened and who is still accurately monitoring sea ice extent?
One of the satellites had a failure in early part of this year… Cryosphere today (for example) which used it is thus showing rubbish data.
Luckily this not the only satellite – so some charts continued while others switched satellite… there is still reliable data
Try this one
https://seaice.uni-bremen.de/amsr2/index.html
The ice extent data was derived from the same satellite. The difference is that those doing the ice extent did the work to cross calibrate an other satellite to ensure coverage.
Cryosphere Today is not was parody of it’s own name, it has been producing garbage for nearly a year and have not done anything about it.
I guess that now the data is failing to show continued melting for the last ten years , they have lost interest. They always were a very alarmist crew at U. Illinois.
Cryosphere Today is NOW a parody of it’s own name
Charles, MASIE uses multiple sources, charts ice extent at 4km resolution and is updated daily.
http://nsidc.org/data/masie
Thank you Ron!
You’re welcome. By the way, if you download the kmz file from their webpage, it opens up in Google earth.
Ron, the MASIE Time Series Plots don’t come up for me.. I can open in new tab, but only 4 of them before it asks for passwords.
Do you have that issue?
However Ron, as they say elsewhere on their site:
“2. When should I use MASIE and when should I use the Sea Ice Index?
Use the Sea Ice Index when comparing trends in sea ice over time or when consistency is important. Even then, the monthly, not the daily, Sea Ice Index views should be used to look at trends in sea ice.”
MASIE is not the best data for comparing from year to year, that is the sea ice index, which shows today an extent of 10.40 million km^2 (the lowest for the date), the next lowest was 2006 at 10.82 and the mean is 12.17. So for today the extent is about three standard deviations below the mean.
Andy, I have not experienced that since I hit the download button and then the CSV files. I do my own spreadsheets and plots.
Phil, that advice comes from Walt Meier, who disregarded it himself when he used MASIE to try to improve SII. As I have explained here:
https://rclutz.wordpress.com/2016/02/27/noaa-is-losing-arctic-ice/
Well, finally this website mentions the elephant in the room, about 2 months after every major news outlet…
This is in no way ‘just weather’, but a step change to the bad in the declining trend of arctic sea ice.
Please note the arctic sea ice volume is also at a record low – see here for chart:
http://psc.apl.uw.edu/research/projects/arctic-sea-ice-volume-anomaly/
Note this says:
“November 2016 sea ice volume was 7,800 km3 , about 2500 km3 below the 2015 value and the lowest for any November on record exceeding the prior record set in 2012 by about 400 km3 . This record is in part the result of anomalously high temperatures throughout the Arctic for November discussed here. 2016 November volume was 61% below the maximum November ice volume in 1979, 48% below the 1979-2015 mean, and about 1.1 standard deviations below the long term trend line.
Average ice thickness in September 2016 over the PIOMAS domain was also one of the lowest on record but just a small amount above the 2012 record ”
[ “Well, finally this website mentions the elephant in the room, about 2 months after every major news outlet…”
Hey, smartass. The press-release came out today. Carried within two hours, if that’s not good enough for you, take a hike We aren’t here to serve your expectations, especially the expectations of an anonymous coward. Do your bosses at Barclays know you’ve been using the company Internet to post anonymous comments while on duty? -Anthony]
I love the way Griff declares that weather only matters, when it supports his religion.
PS: I love the way Griff declares that the current bump in ice is a permanent change. Based on what? Based on the fact that his religion has declared that it must be so.
Yes it’s at a record low. However the record only extends back to 1979, the bottom of the previous PDO/AMO cycle.
Griff, this is not an elephant is a dead dormouse. Don’t get too excited.
I think you are fooling yourself.
find me another year in the 37 year satellite record anything like this.
find me another year with any indications of something like this in December in any of the copious records from the last century.
“Griff December 8, 2016 at 12:44 am
I think you are fooling yourself.
find me another year in the 37 year satellite record…”
37 years out of 4.5billion? LOL
What will you say when sea ice extent returns to post-1979 “normal” range, as it will.
There is no evidence of a step change. There is evidence of a temporary El Nino effect.
OK Chimp what will you say when it does not and continues to decline?
I’ll say I was wrong.
But what the last decade shows is that the decline in sea ice has bottomed out, as the ocean oscillations would predict.
But if Arctic sea ice should stay lower than its centennial peak in 1979, that’s a good thing.
post-1979 “normal” range ?
BS, what makes that level “normal”?
Greg,
It’s not normal, except for the era of dedicated satellites. Normal for the Holocene would be less sea ice, as too would have been for the Eemian interglacial. Normal for the past 114,000 years would be more.
Late 1970’s was actually an EXTREME, up there with levels of the LIA.
Iceland sea ice index shows this very well
“NORMAL” at any other time other than the tail end of the coldest period in the last 10,000 years , would be much less Arctic sea ice.
“Iceland sea ice index shows this very well”
Does it really?
And do you suppose that index takes into account the whole of the Arctic basin?
And if you do suppose that, why would Icelandic fishermen(?) be roaming it when the fish would have been in vast abundance in local waters.
Or perhaps they were sailing around the Arctic for fun.
Or looking for treasure?
That graph his meaningless i terms of the totality of Arctic sea-ice – as you’d realise with just a modicum of common-sense.
Yawn, one of the main areas for Arctic sea ice expanse is through the Iceland regions
Didn’t you know that either ?
Chimp December 7, 2016 at 10:58 am
I’ll say I was wrong.
But what the last decade shows is that the decline in sea ice has bottomed out, as the ocean oscillations would predict.
I’d say that was a bit of a stretch, we’ll see.
Chimp – it ain’t got back to pre 2007 levels in over a decade….
Sadly there seems little chance of it getting back even to where it was 10 years ago.
“Sadly there seems little chance of it getting back even to where it was 10 years ago.”
So what?
You post that as if it were some sort of disaster.
Can you explain why?
Further, can you explain how any action of mankind can possibly make the tiniest difference to it?
And if not, why you continue to post your nonsense?
“Yawn, one of the main areas for Arctic sea ice expanse is through the Iceland regions
Didn’t you know that either ?”
Yawn:
Thanks for conceding my point and your bizarre confirmational *common-sense*.
Just like the G in AGW, when referring to Arctic sea-ice extent we need to look at the WHOLE basin and not just cherry-pick a small area that peps over a 1000 years were pottering around on.
You have obviously not noticed or put together the science – but seas around Iceland are closest to the northern limit of the NAD (norh Atlantic drift).
Go check out what tat means in terms of the southern ice limit around Iceland, when combined with the sign of the NAO.
wow that is about 3 times the volume of Mt Everest. Still a heckofalotta ice
Griff… That’s pretty interesting, since the DMI arctic ice volume has been tracking right in top of 2012 for the last few weeks…
http://ocean.dmi.dk/arctic/icethickness/images/FullSize_CICE_combine_thick_SM_EN_20161206.png
Now, as to Antarctica… Did you expect that it’s temp would escape being affected by the release of El Niño heat, and the formation of a large polynya?
And, while we are at it… We all know why the ice was anomalously ‘high’ in 1979… It was a period of cooling, with Jan-Feb-Mar high arctic ice extent that year. Ho-hum.
That’s modelled data I think… Piomas is corrected by observation.
Anyway, tracking ‘right on 2012’ – the lowest volume – that’s good news?
2016 maximum and May was well below 2012… Did the minimum also fell below 2012 levels? nope.
truth is we don’t know S**t of how arctic ice does behave….
we don’t even know how our climate works
you are wrong griff, all ice volume charts are modeled. all of them. they are all best guess with the help of extrapolation of a relatively tiny amount of measurements.
Griff.. Better than you implied. You see, 2016 is turning out to have higher avg ice volume than 2012, the previous worst year on the chart. There was only 1 period, mid-March to Jun 1, when this year was lower volume than 2012, and then the relationship switched. From there to the 2nd week of Sep, 2012 was lower. They touched briefly then, but 2016 began to recover immediately. The two volume values have been tracking since the last week of Oct.
If you prefer another data set, propose why you think it is more accurate, and we can discuss the vagarities of measurement and modeling methodologies.
Brilliant!
I can’t wait until all that nasty white stuff is all melted and gone. I can’t wait until CO2 reaches 1,000ppm in the wake of inevitable global temperature rise. I can’t wait until Canadian and Russian Tundras thaw and humanity is offered billions of acres of land on which to grow plants to feed a growing population.
And I’ll happily watch the Houses of Parliament and Miami swamped, because humanity might learn a lesson about building on riverbanks, estuaries and flood plains. Perhaps the money blown on a global scam could have been better spent building flood defences or relocating people instead of them desperately clinging onto prime, overpriced beachside properties to bolster their fat wallets.
Sh*t happens Griff, get used to it.
Ouch! That’s gotta hurt, Griff. And knowing how workers at banks work, or rather don’t, I would say Griff has plenty of bandwidth to play his ridiculous claims and propaganda while being paid. Well done for exposing him, funny, no more posts from Griff after this.
BTW, less sea ice is a good thing, from whatever cause.
“Normal” for the Holocene is a lot lower than now. Polar bears had no trouble surviving and thriving during the thousands of years of the Holocene Optimum and the hundreds of years each of the Egyptian, Minoan, Roman and Medieval Warm Periods.
What is the obsession with polar bears? They are bears. They will adapt, they will survive, and they might even turn brown, pink or green eventually.
If they are, as they were hailed to be, certain indicators of global catastrophe, the green nutters fell flat on their face (again) with the insane claim as their numbers are in rude health (but the BBC didn’t get the memo).
To digress slightly, the best thing about Trump’s win is that there seems to be a number of ‘early adopters’ coming crawling out the woodwork claiming they knew all along that GW was never a threat. A bit late though, breaking cover when the coast is clear.
Sorry Chimp, sounds as though I’m having a go at you, I’m not.
No worries.
I mention polies only because the Green Meanies made them the poster cuddly animal. If the Arctic were to warm to such an extent that it returned to its Pliocene state, with boreal forest at water’s edge in Canada and Greenland, then the polies would evolve back toward their brown bear ancestors’ traits. Their evolution has been so recent that they retain all the needed genes.
The Arctic as we know it is a recent, makeshift biome, less than 2.6 million years in the making. Its animal species are still closely related to or the same as their Pliocene ancestors. Arctic foxes are just cold-adapted swift or kit foxes, which should be considered a single species. Arctic foxes were placed in their own genus, but should be in Vulpes with the swift and kit foxes.
They are an indicator of the effects of rapid climate change…
Something you can see is being affected over a very short space of time (geologically/climatologically).
The sea ice hasn’t reached Svalbard yet, nor anything but a fraction of Hudson Bay.
It melted back early this year from the Beaufort Sea and given the ice thickness may well do so again next year.
Really this isn’t having any effect, year on year? (check out what that means for breeding success of Polar Bears).
“They are an indicator of the effects of rapid climate change…”
Seems polar bear populations are increasing.
More Churchill polar bear captures due to increased vigilance not global warming
https://polarbearscience.com/2016/02/
But just keep right on reading the lies in the Guardian and all the other comics you worship, all you do is make yourself look an even bigger idiot every time you post.
Re Griff
**Really this isn’t having any effect, year on year? (check out what that means for breeding success of Polar Bears).**
How will you know what effect it has?
Most people do not. Check polarbearscience.com for the effect of ice on the bears.
Thick ice affects polar bears more than less ice as it is harder to get at the seals for food.
The bears around Hudson Bay are very healthy now.
Griff,
Polar populations are increasing, not decreasing.
Ice in November is neither here nor there for polies. The ice that matters to them is in the spring, when ringed seals give birth on landfast ice.
Polies are highly adaptable. They can live and hunt on land like their brown bear ancestors, or at sea between ice floes. Thanks to the Alaska pipeline, there are lots more caribou for them to eat.
What rapid climate change? Earth warmed more rapidly for longer in the early 18th century than in the late 20th century. Warming in the early 20th century was indistinguishable from in the late.
No worries about polar bears, sea ice, or anything else having to do with climate. Although it would be good for China to burn clean, high BTU content US coal instead of its own crummy, polluting stuff.
The flux of cosmic rays and particles over Earth had a huge increase in the last months as the Sun’s magnetic field decreases very fast to soon reach its grand minimum in the period 2030-2040. Earth’s magnetic field are enough to protect the planet on lower latitudes but cannot avoid the bombardment over the poles. This is certainly increasing temperature and ice loss at both poles. But this also weakens the polar vortices and that’s why jet streamming now reaches mid-latitudes in both hemispheres which makes these regions colder. Southern hemisphere had harsh winter and spring seasons this year especially on subtropical zones as these are hit by this condition. Until the Sun’s magnetic field set back to higher values it’s very unlikely this condition may reverse. It will only happen after the year 2050. The Sun we once knew will only be back decades ahead and most of us won’t see it again.
WX in subtropical South America this year surely fits your description. Ordinarily I’d be there now, and wish I were. But will be spending December in the NH for a change.
Just now at the end of the spring temperature seems to be trying to set back to normal levels but still we have some episodes of unexpected ‘cooling’. According to ‘CCI-Reanalyzer.com’ (University of Maine) temperature anomaly in the world is < +0.4C and in the SH < +0.2C now. In Antarctica it is < +1.0C.
Gabriel,
I don’t trust the cooked books. I do trust what my friends in the Southern Cone are telling me. Maybe you’re there, too. But no temperature records can be trusted.
I know that the following graph is probably used to the point of overkill, and that various people seem to question its reliability, but, assuming it has any remote reliability at all, and assuming even the lowest possible range of its uncertainty estimates hold any truth, (if I am reading it correctly), CO2 as an obvious cause of warming is NOT supported, … I don’t get all the worry over a few months, a few years, or even a few hundred years of human-observed ice melting? And if human CO2 is not the cause, then what is it humans do to cause the ice to melt?
http://www.geocraft.com/WVFossils/PageMill_Images/image277.gifhttp://www.geocraft.com/WVFossils/PageMill_Images/image277.gif
I suggest that the obesity epidemic is causing ice to melt. I will display a graph supporting this claim later [sarcasm].
I believe this is what you wanted:
http://www.geocraft.com/WVFossils/PageMill_Images/image277.gif
Would you care to give us the albedo figures for an Earth 500 Myrs ago?
And, BTW a figure for how much less solar energy the Sun was emitting at that time would be useful.
IOW: that graph is in no way applicable to the current or recent earth.
Thanks for the graph Toneb.
It shows conclusively that even at peak CO2 levels, it could not even maintain the warming trend.
In fact, peak CO2 levels come as the temperature is decreasing.
AGW scam DESTROYED.
Well done. 🙂
I love it when alarmists use scale to hide the truth.
That same chart, when you zoom in shows that CO2 always, and I do mean ALWAYS trails temperature.
CO2 changes are an affect of temperature changes, not the cause of them.
“I love it when alarmists use scale to hide the truth.”
Wot – like this one….
http://static.skepticalscience.com/images/co2_10000_years.gif
Or this one ….. posted by a *sceptic*
http://static.skepticalscience.com/images/co2_10000_years.gif
Care to guess which *sceptic* it was?
(and it was posted this last week).
Oh, an would you care to answer…..
The albedo figures for an Earth 500 Myrs ago?
A figure for how much less solar energy the Sun was emitting at that time.
Correction:
*sceptics graph….
http://static.skepticalscience.com/images/co2_10000_years.gifi1.wp.com/www.powerlineblog.com/ed-assets/2015/10/Global-2-copy.jpg
This one
Toneb December 7, 2016 at 12:55 pm
Would you care to give us the albedo figures for an Earth 500 Myrs ago?
And, BTW a figure for how much less solar energy the Sun was emitting at that time would be useful.
———————–
I can answer these ones because I have spent some time looking at these issues.
Albedo 500 Mya, was about 27.5% compared to today of 29.83%. (I built an Albedo calculation model). At this time, Earth was quite warm, about +6.0C, having just come of the last Snowball Earth period and being right in the middle of the Cambrian explosion of life. The reason Albedo was so low compared to Snowball Earth and to today is that all the continents had moved off of the poles. Super-Continent Pannotia had just moved from the South Pole to the tropics and mid-latitudes and there was no land mass near the North Pole. Ie, no big glaciers pushing down from the poles and land glaciers are the biggest factor in the Earth’s Albedo. There you go, Albedo calculator says 27.5%.
Solar Energy 500 Mya, One can take almost a straight-line change over time (not quite straight but close enough) from the time that the Sun got going when it is was 70% as strong as today. TSI 500 Mya = (1361 W/m2 * (1-0.297*(500/4550)) = 1316 W/m2.
Solar Temp Only = 1316 W/m2 * ((1-.0.275)/4/5.67e-8)^0.25 = 254.676K (or only 0.3C lower than today).
Temperature at 500 Mya was about +6C = so we had 6.3C of extra greenhouse effect –> CO2 was 4600 ppm 500 Mya or 4 doublings of CO2, and therefore CO2 sensitivity is only 1.5C per doubling
It always works out to this number.
“I built an Albedo calculation model”
Bill the sea ice albedo is reducing. What sort of forcing change would you expect if say there was a 50% reduction in polar albedo?
Its really close to ZERO change overall.
First of all, this area is very small. The area between 70N-80N (where the sea ice is melting versus not melting) is only 2.3% of the earth surface area.
Second, because it is so far north, it only gets 50% of the average solar energy that the Earth gets.
Third, the ice is melting out near the end of the sunshine period for the latitude. After September 21, it gets so little sunlight and is mostly dark. Albedo makes no difference.
Fourth, this area has extreme cloud cover. Even when the ice melts out, it is almost always covered in clouds and Clouds with or without sea ice underneath is not that much different.
Fifth, when the sea ice starts to melt out at the end of the summer, the solar angle gets so low that even open water starts to have high Albedo.
The very lowest Albedo number for the 70N to 80N latitude is 49%. No matter how favourable the conditions, the sunlight is still reflected back at 49%. The most extreme Albedo at this latitude on the Greenland Ice-sheet which gets to as high as 83% but open ocean, ice covered ocean with the average level of cloudiness is bwteen 49% to 60%. The average for the whole latitude is 57%.
If I change the 57% to let’s say 49%, it changes the Earth average temperature by 0.08C. But to get that point, the sea ice would have to be melted out by March 21, rather than the usual August 21, so I think the most Albedo really could change is by, is let’s say 54%.
So, 0.03C total change is the Maximum impact.
Another issue I should have brought up is that once the Arctic loses its sea ice, the cloud cover overhead appears to increase which just offsets most of the Albedo implications of losing the ice. This has not been fully proven yet but has been demonstrated in several papers.
For example, here is the real Arctic on August 21, 2016 (not the fake news sort of picture of the loss of sea ice you see at global warming sites) at a time when Albedo should be at its very lowest due to the loss in sea ice and the fact that the Sun is still at a high enough angle to make a difference between open ocean and ice-covered ocean.
Sorry, Nope. Just one big High-Albedo White Spot.
I think you’re right about more cloud cover with reduced ice. Makes sense that there would be more evaporation.
But this is the bit I’m interested in
If I change the 57% to let’s say 49%, it changes the Earth average temperature by 0.08C.
How did you arrive at a temperature? I thinking in terms of energy balance – in other words a positive feedback. Less ice = less albedo = more absorption, etc
Seems I recall some significant low pressure and high pressure systems (1050mb+) in the high latitudes over the last month…… compaction and export?
If you look at the daily drift maps, the ice east of Svalbard was being pushed toward pole during most of November rather than spreading out over that portion of the arctic. It’s weather. That ice floats on water and is at the mercy of the winds.
Yep, this seasons weather is playing a part.
However the Arctic sea-ice is increasingly vulnerable to “weather”.
I think we first saw this in the summer of 12 when the Arctic storm had a disproportionate effect on sea-ice extent (Arctic storms are NOT that unusual).
This is what is to be expected.
As with Global temps, there are short-term, natural variations in the longer term trend.
Annual/seasonal weather plays it’s part in that variation.
There comes a point at which a trigger or triggers are reached due to a confluence of things that cause the system to “jump”.
Who cares? What difference does it make? You paid trolls blather on monotonously with meaningless rationalizations. Arctic sea ice at this moment in time is not an indicator of anything.
Can you elaborate on what physics backs your triggers jumping? By the way- historically, cycles far outweigh trends. Do you realize the extent of human experience on this planet is on a scale likened to the life of a flea on a dog?
“life of a flea on a dog?” That depends on how aggressively that dawg scratches. We ain’t been scratching anywhere near aggressively enough.
Maybe you first saw it then, but the 2007 low was also because of a storm.
No one pays me sunshine.
It matters because it is an indication of the reality of AGW.
It can alter Boreal winter climate patterns, lead to methane release (CH4 – a GHG), and decrease the planet’s albedo.
“There comes a point at which a trigger or triggers are reached due to a confluence of things that cause the system to “jump”.”
Pure speculation, driven by biased opinion….
Why is it that there has been virtually no coverage in the media or in scientific papers of the potential good things that could happen or are happening from a warmer climate. It seems to never even occur to AGW alarmists that a warmer climate might actually be better for life on earth…..as history has shown repeatably in the past.
No doubt the rate of change argument will be reeled out again, but observations are not showing armageddon on weather extremes, instead if anything the opposite.
And for what it’s worth I am an ex UKMO Meteorologist, just like you ToneB.
“And for what it’s worth I am an ex UKMO Meteorologist, just like you ToneB.”
Oh goodie.
We might have met.
Which stations did you work at and for how long may I ask?
I don’t think that’s the case… quite a lot of the time storms have been pushing the ice towards Svalbard, and it has been melting.
See 30 day drift here:
https://www7320.nrlssc.navy.mil/hycomARC/arctic.html
I understand that the Greenland ice sheet is growing and breaking records. Does the combination with warmer ocean water suggest the start of slow down of the “conveyor current” from the tropics? Will there be very harsh winters in the north for the next few decades?
I don’t think that is the case:
http://nsidc.org/greenland-today/2016/10/2016-melt-season-in-review/
This details the melt conditions in 2016, showing the ice cap continues to melt/lose volume/lose elevation
The graph is missing half a year. Back to drawing board, dude.
Satellite observations of sea ice extent, and (indirectly) reliable global average temperature for that matter, start in a period that at the time was regarded as unusually, even alarmingly, cold.
Yes, but they are after 37 years enormously lower in max/min extent, volume, old ice, thickness than in 1979.
Further, we have very good records from many sources for the last century… the lowest extent in that period in the 1940s was higher than the 2007 figures… I am citing Judith Curry there.
Given that 37 years ago scientists had just warned about a new ice age / glaciation, I’m not that convinced.
Fool me once, your fault, fool me twice, my fault. Pull the other one…
There is a conference on the Arctic in Winnipeg this week. Appears they have some better experts: Read:
http://www.winnipegfreepress.com/local/climate-change-on-fast-forward-in-arctic-u-of-m-scientist-warns-405091456.html
Some lead scientist named Ferguson now claims that Hudson Bay will have ice free WINTERS in 5 to 10 years.
Has Dave Barber beat that one?
Well as of today Hudson Bay is pretty ice free…
Griff,
That’s not that egregious. The definition of freeze-up for Hudson Bay is 10% ice coverage. That image suggests that that level hadn’t been reached by yesterday. IIRC the latest freeze-up date since 1979 was December 6, but late November is more common.
It’s just weather.
I suspect the ‘missing ice’ from the Arctic Ocean is piling up on Greenland.
Who cares? What does this tell us about next year’s spring and summer? Will we have a longer/warmer/sunnier/wetter growing season, with less late/early frosts? And everywhere, or just in some places, and overall plus or minus? After all, that is ***the only thing*** that really matters when studying climate.