UAH Global Temperature Update for October 2016: +0.41 deg. C
by Roy W. Spencer, Ph. D.
October Temperature Down a Little from September
NOTE: This is the nineteenth monthly update with our new Version 6.0 dataset. Differences versus the old Version 5.6 dataset are discussed here. Note we are now at “beta5” for Version 6, and the paper describing the methodology has just been accepted for publication.
The Version 6.0 global average lower tropospheric temperature (LT) anomaly for October 2016 is +0.41 deg. C, down a little from the September value of +0.44 deg. C (click for full size version):

The global, hemispheric, and tropical LT anomalies from the 30-year (1981-2010) average for the last 22 months are:
YEAR MO GLOBE NHEM. SHEM. TROPICS
2015 01 +0.30 +0.44 +0.15 +0.13
2015 02 +0.19 +0.34 +0.04 -0.07
2015 03 +0.18 +0.28 +0.07 +0.04
2015 04 +0.09 +0.19 -0.01 +0.08
2015 05 +0.27 +0.34 +0.20 +0.27
2015 06 +0.31 +0.38 +0.25 +0.46
2015 07 +0.16 +0.29 +0.03 +0.48
2015 08 +0.25 +0.20 +0.30 +0.53
2015 09 +0.23 +0.30 +0.16 +0.55
2015 10 +0.41 +0.63 +0.20 +0.53
2015 11 +0.33 +0.44 +0.22 +0.52
2015 12 +0.45 +0.53 +0.37 +0.61
2016 01 +0.54 +0.69 +0.39 +0.84
2016 02 +0.83 +1.17 +0.50 +0.99
2016 03 +0.73 +0.94 +0.52 +1.09
2016 04 +0.71 +0.85 +0.58 +0.94
2016 05 +0.55 +0.65 +0.44 +0.72
2016 06 +0.34 +0.51 +0.17 +0.38
2016 07 +0.39 +0.48 +0.30 +0.48
2016 08 +0.43 +0.55 +0.32 +0.50
2016 09 +0.44 +0.50 +0.39 +0.37
[2016] 10 +0.41 +0.42 +0.39 +0.46
To see how we are now progressing toward a record warm year in the satellite data, the following chart shows the average rate of cooling for the rest of 2016 that would be required to tie 1998 as warmest year in the 38-year satellite record:

Based upon this chart, it would require strong cooling for the next two months to avoid 2016 being a new record-warm year (since the satellite record began in 1979) in the UAH dataset.
The “official” UAH global image for October, 2016 should be available in the next several days here.
The new Version 6 files (use the ones labeled “beta5”) should be updated soon, and are located here:
Lower Troposphere: http://vortex.nsstc.uah.edu/data/msu/v6.0beta/tlt/uahncdc_lt_6.0beta5.txt
Mid-Troposphere:http://vortex.nsstc.uah.edu/data/msu/v6.0beta/tmt/uahncdc_mt_6.0beta5.txt
Tropopause:http://vortex.nsstc.uah.edu/data/msu/v6.0beta/ttp/uahncdc_tp_6.0beta5.txt
Lower Stratosphere: http://vortex.nsstc.uah.edu/data/msu/v6.0beta/tls/uahncdc_ls_6.0beta5.txt
NOTE: About an hour after publication, the story was edited to correct a typo from 2017 to 2016 on the data table (h/t to Marcus)
Ties with 2015 as the warmest October on record in UAH v6.
http://www.nsstc.uah.edu/climate/2015/october2015/102015_tlt_update_bar.png
If you use Micro$oft Excel to plot your blue scatterplots, they can give you an actual band limited continuous function, which might actually conform to the Nyquist criterion. I use it all the time and they use some sort of cubic spline fit to the actual data set points.
Otherwise, the discontinuous plots convey nothing and predict nothing for the future.
Trend line “predictions/projections” evoke some questions that all have yes/no answers.
1/ Will the next data point obtained be the same as the current most recent point. ?
2/ Will it be higher …. ?
3/ Will it be lower …. ?
4/ Will it be the same as ANY previous data point in the set ?
5/ Will it be higher …. ? new record maximum.
6/ Will it be lower …. ? new record minimum.
NONE of those questions can be answered from these graphs.
G
6/
Marcus, I’m curious why you left the last 12 months off your graph.
Where did you find the Oct 2016 numbers for UAH V6 ??
They’re stated in the table on Roy Spencer’s post.
Why does GISS make 1997-8 so much cooler than 2016?
What do you mean by “GISS” ?
If you are referring to their land and sea index “LOTI” they have rigged the SST data by “correcting” daytime to data using night time data.
“If you are referring to their land and sea index “LOTI” they have rigged the SST data by “correcting” daytime to data using night time data.”
Obviously you havent looked at the data.
Differences between Satillite and Surface are NOT PRONOUNCED if you compare Ocean only
That is why, as will soon be shown, the satillite records of SST VINDICATE KARL.
too funny… wait for it…
CO2 cannot warm the oceans.
OOPS. Mosh just tried to sell another LEMON. !!
Mosher, isn’t atmospheric water vapor the best satellite proxy for SST?
Btw, I saw a glimpse of the new HADISST2 dataset, still unofficial, that seemingly corroborates ERSST v4 during the satellite era:
http://www.karstenhaustein.com/Dateien/Climatedata/HadISST_vs_HadISST2_1870_2010.png
Andy, that’s true for radiation. However CO2 warms molecules around it by absorbing radiation, then transfering that energy as rotational/vibrational energy. IE heat. That is, it gains energy then transfers that energy to other molecules by bouncing into them.
It doesn’t matter if that other molecule is O2, N2 or H2O.
1. They measure different things.
2. They measure different things in different ways.
there is ZERO expectation that the two metrics will be the same or even comparable
Mosh’ says:
Mosh’ says:
too funny ….
They don’t “make it cooler”. Surface temperature behaves different than troposphere temperature. It is not a GISS problem: other surface measurements behave similar.
Nonetheless, even UAH6 shows for the Globe warmer temperatures for 2015/16 than for 1997/98 as well. Why don’t you wonder about that?
But it does not in the Tropics:
It is rather puzzling. Despite falling ENSO numbers all year, the last 4 months have been at least 0.05 above the June anomaly.
A precision of hundredths of a degree is beyong the accuracy of most thermometers used to measure these temps so your comment should read “…have been at least 0.00 above the June anomaly”.
When you average the daily values of thousands of measurements to build a monthly mean, you need such precision.
Averaging lots of readings together, when the readings come from separate instruments in widely different places, does not increase the accuracy of the data.
You are correct that it does not increase the accuracy of the data, but it does increase the accuracy of the estimator of the population mean which you are measuring. The standard error decreases as the sample size increases. This is basic statistics which you seem to be unaware of.
.
http://0.tqn.com/d/statistics/1/S/M/-/-/-/standarddev.GIF
.
https://en.wikipedia.org/wiki/Standard_error#Standard_error_of_mean_versus_standard_deviation
That only applies when you are measuring the same thing the same way, eg in a factory.
With surface temperatures you most certainly ARE NOT.
“beyong the accuracy of most thermometers “
These are not thermometer measures. Not that I think they are more accurate than those.
It rather puzzles you I guess. Probably because you live with the supposition that a global averaging of troposphere temperatures and ENSO indices are by definition in correlation (your guest post about “UAH and ENSO” is the best example of the mistake).
Never mind, need new glasses…D’oh…
La Nina appears to be forming again and should impact the last two months but 2016 will still likely be the warmest year in the short record.
The UAH figures for November/December would need to average below 0.23 for 2016 ‘not’ to set a new record. It’s possible but seems unlikely.
“in the short record.” Thank you very much for that statement, it always amazes me that we are attempting to extrapolate, or even base decisions on the spending of billions (I daresay trillions) of dollars on such an insignificant data set. Let’s have some fun with the past 38 years of the data we have ……
Life has existed on the planet between 3.5 to 4.1 billion years – I will use 3.8 billion years for ease of the math and the assumption that, “where there is life, there is climate.” Two ways to visualize this, in the time dimension and in the space (okay, area) dimension. My basis for time is a calendar year (averaged for leap years, therefore rounded to 365.25 days), and my basis for area is the US football field.
If we were to use one calendar year for the length of time that “climate” has existed on this planet, then the past 38 years fits into the final 0.3 seconds of December 31. Put another way, you are between “1” and “Happy New Year” when accurate temperature data began being recorded, and a whole lot closer to “Happy” than to “1”.
If we were to use a football field as the basis for the size of “climate” on earth, then you only need to look at a tiny fraction of space in the end zone, actually a square with sides of 0.288″, as the area occupied by accurate recorded temperatures.
Therefore, let’s use this “short record” as the basis for the hysteria and paranoia surrounding climate change, and let’s also state, very inaccurately I might add, that CO2 is both a greenhouse gas (which it is not, only in confined laboratory conditions and only via specific wavelengths does it actually absorb energy, and this is called a resonance frequency, and all molecules have it, fortunately the sun emits radiation over an incredibly large bandwidth, thereby eliminating the “greenhouse” effect of basically all molecules – and there is also this thing called the second law of thermodynamics), and that one part in 2,500 (i.e. 400 ppm) can somehow miraculously be responsible for warming the other 2,499 parts, and let’s use this to base regional, state, federal and UN policies on.
More pragmatism. At the end of the Ordovician period, approximately 450 million years ago, there was a significant glacial event (a.k.a. Ice Age), yet the CO2 concentration was 4,000 ppm, or TEN TIMES current. How does CO2 drive temperature?
At the end of the Jurassic period, approximately 150 million years ago, there was yet another significant glacial event with a CO2 concentration of 2,000 ppm, or FIVE TIMES current. How does CO2 drive temperature? Please do tell.
A very select few are becoming incredibly wealthy at the expense of a vast majority of very poor, and as always, money doesn’t talk, it screams.
Note we are now at “beta5” for Version 6, and the paper describing the methodology has just been accepted for publication.

@roy
I have asked a few times now how you fixed the 0 K and 285 K calibration points?
and with the continued updates in the no. of versions I get increasingly skeptical of your results, because it indicates that you don’t really know.
My results are indicating that we are losing heat.
From the top latitudes down…
http://oi60.tinypic.com/2d7ja79.jpg
and more so in the SH
but even looking at the whole earth
if you know how….
there is no man made global warming and it is actually cooling.
live with it….
more cold coming up right ahead.
Why would anyone expect a sine wave fit ?
The bottom ends of your blue (presumed actual data) graph shows NO HINT of a change in curvature consistent with a sine wave.
Try fitting your blue curve to the form: y = exp(-1/x^2)
G
@george
well
all my data are showing that the half cycle is 43 years:
in fact I made a mistake with the Alaskan data of assuming a total cycle of 88 years when in fact it was exactly 86.5 years.
http://www.nonlin-processes-geophys.net/17/585/2010/npg-17-585-2010.html
Why would think that Minimum temperatures collected in South Africa could tell you ANYTHING WHATSOEVER about the system as a whole. And also,, UAH doesnt Estimate Minima or Maxima.
Apples and Oranges.
https://wattsupwiththat.com/2016/11/01/uah-global-temperature-update-down-slightly-for-october/#comment-2330988
@ur momisugly steven mosher
minima are important
AGW is claiming a GH effect due to more CO2
GH effect is like increasing minima similar to observation of an increase in minima when it is overcast in winter [here]
there is no increase in minima [average, global]
ergo there is no AGW
My take from your comment:
Why would think that CO2 concentrations collected in Hawaii could tell you ANYTHING WHATSOEVER about the system as a whole.
Why would you think that temperatures based on measurements from barely over half the land surface have any bearing to reality?
And so many of those thermometer, are pretty much guaranteed to be JUNK. Either at airports, heavily affected by urban growth etc etc
You can prove me wrong by showing us pictures of the pristine temperature stations that provide data to the 6 places marked by circles
Then you can show us where the data for all the grey area comes from.
Come on Mosh.. step up !
Just for fun, I picked up one of the temperature series that GHCN refuses to use in Central Africa.
See the huge warming trend… NOT !
Andy, closer to 20% of the land surface. Next to nothing for sea surface.
Polynomial fits have no predictive power and should never, ever be used to show the fit outside of the fitted data. Roy used to include them on his UAH plots (with the disclaimer “for amusement purposes only”), but dropped them years ago. If you carry your parabola out another 10 years things start looking pretty silly!
BTW, you used the same .jpg file for both images.
@ur momisuglyRic
sorry there was an unintended double copy and paste of the southern Africa result. Here is the global result:
https://wattsupwiththat.com/2016/11/01/uah-global-temperature-update-down-slightly-for-october/#comment-2330988
quadratics are fine to approach half the sine wave (half Gleissberg= 43.25 yrs) in K / time squared as long as you have 4 points [ 4 regressions showing K or C /annum from each weather station, averaged] to define the function showing acceleration/deceleration.
in the case of my estimate for the warming/cooling of earth, the sampling procedure of weather stations is important
1) must be random, daily data for at least 45 years
2) equal weather stations NH and SH
3) all weather stations must balance to zero latitude [ longitude does not matter as long as we look at K/annum]
4)70/30 @ur momisugly sea/inland
Not so difficult for a class of first year stats students to check my results with a sample of 50 weather stations?
Enjoy!
Dr. Spencer, the anomaly is +0.41C – with what margin of error? I was taught to never provide a measurement without a margin of error.
1. Its not a measurement, its an estimate.
2. The biggest uncertainty is the structural uncertainty which has only been estimated for RSS.
Here is the official documentation.. but not for the current version.. needs updating
http://www1.ncdc.noaa.gov/pub/data/sds/cdr/CDRs/Mean_Layer_Temperatures_UAH/AlgorithmDescription.pdf
“As discussed previously, decisions regarding limb correction procedures involving the
linear combination of many different channels, or computation of the TLT “pseudochannel”
from various view angles of AMSU channel 5, or how to interpolate the
gridpoint products, were optimized based upon how well two different AMSUs flying on
different satellites in different orbits agreed with each other in the resulting products.
Thus, the products and procedures used have been optimized to be fairly robust in a
statistical sense. Especially when regression is used for the development of a product
based upon a huge volume of satellite data, “over-fitting” of the regression equation
coefficients is quite common. This potential problem was indeed seen and avoided to
the extent possible.
Nevertheless, algorithms using remotely sensed data are never perfect. Thus, the
algorithm might or might not be sensitive to long-term changes in (say) surface
emissivity, or sensor changes, or satellite orbit changes, depending upon the nature and
severity of these various influences.
There has been little effort to explore all of the potential sources of these problems and
potential mitigation strategies.”
It is somewhat unusual to add, in this context, such information to single values. The margin of error, the confidence interval are rather in use for series, and denote how many single measurements deviate from a linear estimate among the series.
This margin therefore depends on the number of measurements. Thus when considering all monthly values published by Roy Spencer since december 1978, you obtain a linear estimate of 0.122 ± 0.009 °C per decade.
But for the period: january 2011 till now, you obtain 0.900 ± 0.105 °C / decade. The margin of error is here bigger than the value itself, what is simply absurd.
You are right FG as far as most engineering measurements are concerned. On a lathe you often enough need a precision of e.g. ± 0.05 mm: I experienced this decades ago. Not mentioning such a precision makes any discussion about the product simply redundant.
But for single temperature measurements, I never saw it; as I wrote, It is known to me only in the context of time series for which you execute e.g. a linear regression.
last graph [for the drop in global minima] should have been
showing that we are cooling
Curious, what would the trend need to look like in 2017 for “the Pause” to return?
what Pause?
Sigh, so much willful ignorance.
The pause which so many climate experts have been standing on their heads around trying to explain. Or should I say “mask” by “adjusting the data”?
The one that was interrupted by the TRANSIENT of the EL Nino.
You do know what transient means, don’t you.
Its what you will be when you leave BEST..
“what Pause”
This pause.
This pause:
Want more?
Here.
Yes, ^THAT^ Pause.
Acceptance leads to healing…
Steven Mosher said, November 1, 2016 at 12:09 pm:
This pause: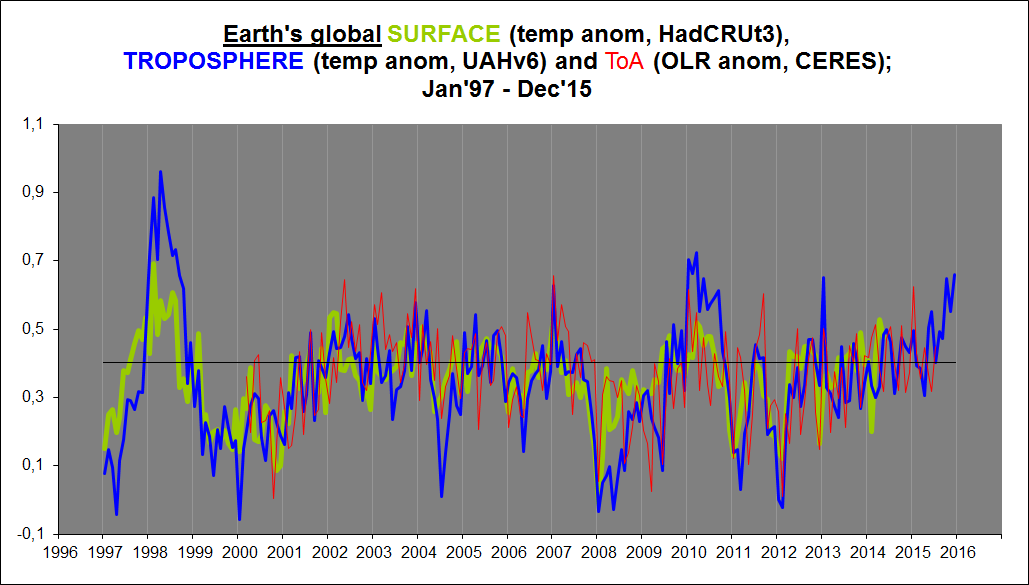
“Curious, what would the trend need to look like in 2017 for “the Pause” to return?”
There is simple arithmetic you can do. UAH did show a near zero trend from about May 1997 to Feb 2016, and the intercept was about 0.25°C. As long as the mean since Feb 2016 is greater than 0.25, the trend since 1997 will be positive, else not. This is an approx good for a year or two at least. The average since Feb is now way higher, and continued monthly values of around 0.4 are adding to the task. The trend won’t stop rising until months are below 0.25 °C, and no pause until a sequence of months have been below 0.25 by as much cumulatively as 2016 has been above. That’s very unlikely.
It’s called La Nina, I suspect you have heard about them, even if you want to pretend otherwise.
Why is that “very unlikely”?
Why unlikely? I looked up details. From Jul 1997 to Jan 2016, there was zero trend, and the average was 0.14C (I had V5.6 above). From Feb to Sep, the average was 0.55. For pause return, the average since Feb 2016 has to be 0.14. So what would it take? Either:
1. Eight months averaging -0.26C. But such months individually are very rare in the record.
2. 24 months averaging 0C. That did happen once, around 2008. But it didn’t start from temps of 0.4C.
And yet, UAH seems to be running along at about 0.4. Each extra month which is 0.26 above the .14 level requires another balancing month 0.26 below, or -0.12C.
Nick Stokes said, November 2, 2016 at 2:17 pm:
Thanks.

Yes, I understand that for you this whole thing is a purely statistical exercise. As it is for Monckton. I, however, fundamentally object to this approach. It tends to neglect the natural processes behind the data. Because what happens then when you have a towering El Niño spike towards the end of your data segment? You end up seeing the trees and not the forest. The purely statistically generated linear trend line will have a hard time coming back down. Even if the data itself were to drop back to the previous mean level.
To me, all that is needed is for global temps to revert to a mean level fluctuating around +0.13 for a plateau to pick up, disregarding the ENSO noise:
So for you, the data needs to come down to a level much lower then the level it was at before the late El Niño spike in order for the “Pause” to continue. For me, it only needs to come back down to where it was before …
If you assume that the temperatures from now until the end of 2017 are the same as they were from November 1998 until December 1999, after 1998’s el Nino, (anomalies averaging just below zero), then the Pause will still not return (except for a new one stretching back to 2012).
This longing for and belief in the return of the Pause reminds me of those South Sea Islanders who believe that one day Prince Philip will return.
Richard B,
Skeptics take things as they are, not how they wish they were. Therefore, there is no “longing” for a pause. It either happened or it didn’t.
Rather, it is the refusal by some folks to admit that global warming paused for many years. For example, Steve M refuses to admit it happened. Maybe you should ask him why, since you don’t have that problem.
Yes you’re quite right. My comment was somewhat tongue-in-cheek, with a glimmer of reality!
This compares very favorably with the NCEP CFSR/CFSv2 numbers calculated by Dr. Ryan Maue of WeatherBell, where the temps have been bobbing up and down across the +.4C line since June.
I wish they would put this graph on the public site. Every once and a while Bastardi and Maue put it on Twitter, so it is quasi-public. To me this is the best calculation of terrestrial-based calculations out there since it feeds the daily runs of the weather models.
If you take out the El Nino spike it looks like the sustained rise since 2011 is holding. Having the last few months coming in very similar it looks like the downside of the peak is done. It may not get much lower.
“Based upon this chart, it would require strong cooling for the next two months to avoid 2016 being a new record-warm year (since the satellite record began in 1979) in the UAH dataset.”
There you go… even the satellite data.
You say that as if you actually believed it was something meaningful.
As all of us said back in 2014, nothing matters until after the El Nino is fully out of the picture.
Of course you are an expert at cherry picking only the data that supports your point.
(PS: We will be sure to bookmark this post so that we can taunt you with it in another year or so when the pause resumes.)
…Ummm, it is called an “El Nino” ….What did you expect, a new Ice Age ?
True, but it has halved from +0.84C in February. How does CO2 do that, I wonder?
In the mean time
Chigaco will be having one hell of a winter…
too funny. Its like a member of BLM pointing at one bad cop and trying to draw a conclusion from cherry picked data.. who knew you learned your logic from Liberals
must say that I am not really that much interested in your opinions
would like to hear from roy spencer how he manages to keep stable probes against the current scorching sun and how the system can effectively be calibrated
HenryP, instead of constantly expecting detailed personal tuition from Dr Spencer., maybe you should just do the leg work and start reading the published documentation. It is pretty hard going but it’s no one else’s job to do it for you and spoon feed you an easily digestible summary.
Yep. And probably the rest of us in the northern 2-3 tiers of states.
I’m grateful for the mild October and not getting my fingers frozen while working in the yard for a change. 99% of the time, there’s a cold dry wind out of the north. We actually even had an Indian Summer this year; haven’t had one of those in a long while. (that will be politically incorrect)
not being native of your country,
do explain to me what is understood by an Indian summer?
Sure 🙂 Wikipedia describes it better than I can – “Indian summer is a period of unseasonably warm, dry weather that sometimes occurs in autumn in the Northern Hemisphere. The US National Weather Service defines this as weather conditions that are sunny and clear with above normal temperatures, occurring late-September to mid-November. It is usually described as occurring after a killing frost.”
HenryP,
‘Indian Summer’ is an unusually warm period that occurs across much of the U.S., close to the autumnal equinox. It generally occurs in the last half of September, and lasts for a week or so.
(From memory. You can also do a search…)
thanks.
The Indians lost it –
perhaps that is a sign that summer will lose it against winter?
as [natural] climate change sets in, – it is getting slightly cooler – it appears that the seasons shift a bit up – on our year calendar.
when you see that you are still shoving snow in late spring you know that the big winter is coming…….apparently in some places in England there have been years during the LIA that there never was a summer….
2016 would barely exceed 1998, by a fraction, yet CO2 concentrations have soared these past 20 years, and blown right past the so-called “tipping point”. So you smugly rest your case on statistically insignificant warming, obviously independent of CO2? Must be nice to be able to close your eyes, cover your ears, and chant “Naw-naw-naw-naw!”.
@brians356
November 1, 2016 at 3:36 pm: It’s a prime requisite for the job.
:
“Much ado about nothing” – We are still in the 10% of the coldest years in the past 10,000, and the trend has been overall cooling since the Holocene Climatic Optimum over 6,000 years ago. We have been warming for 300 years, ending the coldest period of the past 10,000 years, the Little Ice Age. Now it appears that climate alarmists have enlisted El Ninos to buffer their increased CO2/climate change position. What was CO2 doing 6,000 years ago when it was much warmer? And why is temperature not responding to CO2’s sudden surge with a sudden surge of its own? Is it waiting for El Nino?
“Waiting for El Nino” – that’s a promising book title.
“And why is temperature not responding to CO2’s sudden surge with a sudden surge of its own?”
Because temperature is doing exactly what theory predicts.
There is no instantaneous response from increased c02.
lag.
look it up. only three letter
Searches are usually better with more than three letters.
BTW, there’s also a couple months lag between SSTs, as in El Nino, and air temps, as in what UAH measures, it’s worth keeping that in mind when SST anomalys are changing rapidly.
I think what you mean to say is CO2 is “lagging” ocean water temperatures. Look it up.
I looked it up and I saw a variety of models all showing rapid warming, and below a line showing observed warming. The models almost all showed projected warming far higher than observed. Is that what they are supposed to do?
A twenty year lag? How convenient.
Fifty years ago, or a hundred years ago, if I had access to temperature reconstructions of past million years, or just the past 10,000 years, I could have predicted the current warming following the Little Ice Age, and with better accuracy in terms of rate and magnitude than the current climate models. Both the models and I would have the benefit of hind-casting, and it’s remarkable that their current theory is incapable of explaining past climate changes. It’s Al Gore-ish, claiming that CO2 increases (why? and how?) before warming.
Look it up, Steven, it’s only four letters: fail.
“There is NO response from increased C02.
Just leave out the “instantaneous”… or just keep fooling yourself.
.
Mosh’s strong point is apparently not physics. The effects of absorbing radiation are indeed instantaneous but also cumulative.
figure 7 from Spencer and Baswell 2011 compares the lag shown by both models and observations
One of many things that models get fundamentally wrong, indicating that whatever theory is being used is being misapplied or is wrong.
The negative side of that graph corresponds to radiation driving temp change ; the lag is about 12 months in the real world. Depending on the nature and magnitude of the feedbacks which we DO NOT understand and are mainly guesses, there will be a longer term settling towards a new dynamic equilibrium.
SM wrote:
Because temperature is doing exactly what theory predicts.
No wonder he won’t admit the ‘Pause’ happened!
Too funny…
I wouldn’t call doing nothing for 14 years and then suddenly coming out of hibernation coincident to a massive El Nino…a “lag”,
Don’t forget everyone that as temps have been rising since the LIA that any year that does NOT make a new record should make news .
A new high does not mean it’s anything to do with humans – there have been new highs every few moths for 400 years .
It’s only in “Hoaxworld ” a “record ” temp is big news .
Mosher writes
Far from it.
Theory predicts strong positive feedback as represented in the GCMs. Reality has the warming happening at a much lower rate.
This is looking more and more like a step increase following the ENSO event. Theory doesn’t predict that either. If there are years of pause following a step increase the the “C” part of CAGW all but vanishes.
Here is my take:
The “Quiet Sun” is having an unexpected warming effect, as the traditional winds are changed by the revolutionary lack of energy.
Simply stated, the lack of winds over certain parts of the ocean leads to a lack of up-welling, which means less cold water is brought up from the deeps. This makes SST warmer, which makes air temperatures warmer.
This in turn throws things out of balance, especially as the “Quiet Sun” makes the background colder even as SST makes things warmer. In order to regain balance, the planetary flow is more loopy and meridional, which brings a rush of warmer air to the Pole (where heat is squandered to outer space) and colder air is transported to lower latitudes (which may eventually chill SST).
This is an ongoing process, and your bet is as good as mine what the next phase will be. I expect things to be more out-of-balance than in-balance for some time.
In the end we likely will have a better idea of what the weather maps for the Dalton Minimum looked like.
Caleb-san:
Solar cycles have been collapsing since 1996.
Since 1996, global temp trends have been ostensibly flat (excluding the late 2014~early 2016 El Nino spike):
http://www.woodfortrees.org/plot/rss/from:1996.6/to:2015.7/plot/rss/from:1996.6/to:2015.7/trend/plot/esrl-co2/from:1996.6/to:2015.7/normalise/trend/plot/esrl-co2/from:1996.6/to:2015.7/normalise
Your hypothesis doesn’t match the empirical data..
We’re in the early stages of a La Nina cycle. By mid-2018, a 22-yr flat global temp trend should reappear as the current La Niana cycle offsets the 2014~16 El Nino spike, despite 30%+ of all manmade CO2 emissions since 1750 being made over just the last 22 years…
From 2019, the AMO will enter its 30-yr cool cycle and the PDO already entered its 30-yr cool cycle in 2008… The weakest solar cycle since 1790 starts around 2022..
In just 5~7 years from now, a global cooling trend will likely appear from 1996, which will finally end the CAGW scam.
We’ll see soon enough.
If the “quiet sun” were having an unexpected warming effect, I would think winds should be picking up as convection would likewise increase.
My guess is that reaction would be secondary, after the warming effect. First the warming has to occur, before the winds pick up. The primary effect would be less wind, and thus less up-welling, and thus less cold water brought to the surface.
I’m just guessing. The La Nina showed less up-welling than expected, and I took it from there.
It’s the day/night cycle (warming and cooling) that drive the winds/convection currents, so the response to hotter temps would be instantaneous. Freeman Dyson says “A field of corn growing in full sunlight in the middle of the day uses up all the carbon dioxide within a meter of the ground in about five minutes. If the air were not constantly stirred by convection currents and winds, the corn would stop growing.”
I agree with Caleb, the Earth is currently in a mixing phase due to the Sun’s impact on upper atmosphere lag to then settling down.
The next 2 months look fairly chilled as things dry down.
It is not unusual for there to be a little bounce back for a few months on the downside of an El Nino. In fact, this occurs in almost all El Ninos. .
Secondly, in this last El Nino, Temps went up very fast and then came down very fast, dropping initially faster than they usually do.
We are right on schedule right now for how temperatures should be going down after the 2016-17 Super El Nino.
My troposphere model is basically bang-on this month and we should continue heading down for at least 6 months yet.
Nice job, sounds really good. Please allow for a remark.
You speak about a “Super El Niño”for the 2015/16 event. Maybe it has been one of these, but compared with the 1982/83 and 1997/98 editions (using MEI) it looks like the little brother.
http://fs5.directupload.net/images/161102/2sk9a668.jpg
Maybe this meaning is influenced by the UAH6.0 time series in its Globe variant. Looking at the Tropics stripe gives another impression, better fitting to MEI.
Moreover, 1982/83 and 1997/98 began by far more peaky than did 2015/16, which in fact had a weak start by end of 2013 already, before restarting in 2014.
Sometimes I get a bit bored by these endless claims about surface data measurements being inaccurate, flawed, if not even… manipulated!
Let me show you a little example falsifying these claims, using as source temperature measurements in Australia since 1979, performed by:
– the 570 GHCN surface stations (data from the unadjusted record)
– the UAH TLT temperatures measured by satellites (zonal and 2.5° gridded record).
No doubt: what GHCN stations measure is quite a bit warmer than what is by UAH. Here the trends for 1979-2016, in °C / decade:
– GHCN: 0.273 ± 0.028
– UAH: 0.157 ± 0.026
No wonder: GHCN unadjusted itself is quite a bit warmer than is GISS land-only.
http://fs5.directupload.net/images/161102/hj6ylc6d.jpg
But a look at the 60 month running means should convince that the (red) surface and (yellow) troposphere measurements are much nearer than so often pretended. And the difference beween the two running means would be small if the data was originating from the GISS land-only dataset (I don’t have it in the PC).
Pour enfoncer le clou, to drive home the point, I made an additional experiment, by collecting all the 2.5° grid cells encompassing one or more of the australian GHCN stations, and computed for these cells a time series out of UAH’s gridded data (the green plot).
The extreme small difference between UAH’s complete view over Australia and the grid cell selection encompassing GHCN stations imho is a good measure for the representativity of these stations for the whole country.
One could do the same for CONUS…
these endless claims about surface data measurements being inaccurate, flawed, if not even… manipulated!
@Bindidon
the problem is that these figures from your ‘official data’ don’t tie up with my own figures. According to my own figures, earth cooled by at least 0.1-0.2K since 2000.
Where did it go?
Maybe if you did your own measurements you would come to the same conclusion?
that involves doing some work…. ???
https://wattsupwiththat.com/2016/11/01/uah-global-temperature-update-down-slightly-for-october/#comment-2331557
remember, on any subject of science, you cannot have a vote.
You only need one man to get it right.
So your “own figures” are more worth than the work of thousands of people? You are simply ridiculous, HenryP.
Please please don’t answer to my comments anymore.
no,
you cannot pick and chose commenters.
that’s not how it works here, I am sure.
btw
why don’t you show us what results you have actually measured, for yourself,
instead of relying on those of others.
Right. None?
That shows us you are either here because of wanting commenters to follow your beliefs / hidden agenda or you are lazy.
Are you trying to argue the “unadjusted” data is good? That is the point we are making.
It is the “adjusted” Australia temp trend which adds more than 1.0C to the unadjusted trend that is the problem.
Sorry Bill Illis, I can perfectly understand your claim, but…
http://fs5.directupload.net/images/161103/b8pmdqay.jpg
You clearly can see here
– what it means to homogenize GHCN unadjusted into valuable data, without outliers etc etc
– that this complex process doesn’t add any °C to the unadjusted data: the contrary is the case.
The trends for 1880-2016 in °C / decade:
– GHCN unadjusted: 0.229 ± 0.006
– GISS land-only: 0.097 ± 0.001
– GISS land & ocean: 0.070 ± 0.001
Fell free to download all the data and to compare your processing with mine.
Unfortunately I lack GISS data restricted to specific countries. But Australia is, like is CONUS, a very stable land wrt temperatures: thus you shouldn’t expect GISS to show there anything higher than it does for the whole Globe.
One day I’ll download the complete GISS netcdf stuff together with the FORTRAN routines needed to expand that into text files!
Many hours ago I sent a comment in reply to another comment:
https://wattsupwiththat.com/2016/11/01/uah-global-temperature-update-down-slightly-for-october/comment-page-1/#comment-2331446
and oops?! It was not published.
That the moderation of a site rejects a comment with an explanation of why it was refused I of course can understand: it’s the moderation’s job.
But that a comment simply disappears I can’t understand.
Hi Bindidon,
Comments ocassionally disappear. It’s happened to me several times. It’s probably a WordPress glitch, not the fault of this site. WUWT doesn’t delete comments due to their scientific point of view. If it did, it would quickly become apparent from the large volume of complaints that would generate.
Unfortunately, WordPress doesn’t offer a preview function, so the best thing you can do is save your comment until you see it published. You can even save your comment as an email draft. It’s good insurance. You can delete the draft after it’s been posted.
D. B. Stealey! You are missed around WUWT. Don’t be such a stranger!
Hope all is well.
NCEP CFSR 35 year running record had it .378C so close to this. Also had this as warmest year on its record Running daily model initializations available here http://models.weatherbell.com/temperature.php
Polar vortex is very weak.
http://models.weatherbell.com/climate/ims_ice_current.png
http://www.cpc.ncep.noaa.gov/products/stratosphere/strat-trop/gif_files/time_pres_HGT_ANOM_OND_NH_2016.png
Index El Niño gradually declining.
http://pics.tinypic.pl/i/00836/6r5h4qv7bj6z.png
The sun without visible spots …
whilst the sun is hotting up
earth is cooling down
anyone who knows why, gets an A plus from me…
@Greg
referring to your request to do my own research on UAH calibration
you have to be kidding me/ no idea where to start.
I have my own results, telling me what is happening.
my results show UAH is out, it should be about 0.1-0.2K lower on average, over the period measured from 2000.
you are all free not to believe my results but it is my right to report the matter –
A somewhat unusual view on our planet…
Activate the two following links (Nick Stokes’ wonderful globe plot facility, and a gridded temperature dataset), e.g. in Chrome or Firefox
https://s3-us-west-1.amazonaws.com/www.moyhu.org/maps/webgl/grid.html
http://m.uploadedit.com/ba3s/1478209143722.txt
in a tab each, copy the whole text from the second one, paste it into the “Data” field, and click on “Plot new”.
Any idea of what it might be?