Robbie Andrew from the Center for International Climate and Environmental Research – Oslo has created an interesting animated graph showing the growth of CO2 in the atmosphere. While it has the typical “climate proponent” view attached to it, it is interesting to watch because it clearly shows how CO2 jumps faster when ENSO is strongly positive.
He writes:
Drivers of Atmospheric CO2

Discussion
While we measure the amount of CO2 in the atmosphere in mere parts per million (ppm), this small amount has a substantial effect on the temperature at the surface of the Earth. The amount has now increased by 40% since the industrial revolution, leading directly to increased temperatures worldwide.
There are four main drivers of the changes in the level of CO2 in the atmosphere.
The seasonal cycle
The first is the seasonal cycle, dominated by the forests of the northern hemisphere, absorbing CO2 via photosynthesis in summer and spring, and then, in autumn and winter, the decay of their fallen leaves to release some of that CO2 back into the atmosphere. This cycle can be seen here as a pulse, sometimes imagined as the planet ‘breathing’.
Emissions
The second most important driver is our emissions from burning of fossil fuels and deforestation. This transfers carbon that has been stored for a very long time underground into the atmosphere in the form of CO2. Nature partially compensates for this increased level of CO2, with both forests and oceans absorbing more (the latter leading to acidification of the oceans), but this amounts to only a little over half of the new CO2, with 44% of each year’s emissions remaining in the atmosphere.
The El Niño Southern Oscillation
The third driver is often referred to as El Niño, or more correctly as the El Niño Southern Oscillation (ENSO). ENSO describes a naturally occurring cycle of pressure and temperature differences across the width of the Pacific Ocean. In El Niño years there tend to be more droughts in important forested areas, and that reduces the productivity of forests, in turn reducing their absorption of CO2 from the atmosphere. The drier conditions can also lead to increased wildfires, sending even more CO2 into the atmosphere. Strong El Niño conditions can be seen in here 1983, 1988, 1998, and 2015.
Volcanoes
The fourth major driver is the periodic eruption of volcanoes, the most significant of which in the last few decades was Mt Pinatubo in the Philippines in June of 1991. The enormous amount of fine debris thrown into the atmosphere – probably the largest since Krakatoa in 1883 – stayed there for many months, blocking sunlight, reducing global temperatures by about 0.6°C, but also increasing diffuse sunlight, which stimulates tree canopy growth, with the overall effect of increased natural carbon sinks. Note that it’s not about the CO2 volcanoes emit when they erupt: Pinatubo emitted about 50 MtCO2 in 1991, compared with our own emissions of about 29000 MtCO2 in the same year.
Relative effects
The relative effects of ENSO and our emissions on the growth of atmospheric CO2 can be determined by analysis of these data. The bars at the bottom of the animation above show these effects, with the effect of emissions being always positive and growing, while that of ENSO flicks between positive and negative depending on whether the planet is currently in El Niño (to the right) or La Niña (to the left). The effect of the sea-surface temperatures used to measure ENSO on measured atmospheric CO2 is delayed by several months because of the natural processes involved. The year 2015 was a particularly strong El Niño year, and, when combined with our record-high emissions, atmospheric CO2 levels rose more sharply than usual.
Sources
NOAA releases weekly average concentrations of CO2 measured at Mauna Loa, Hawaii here. These data are similar to, but not the same as, estimates of global average concentration. Mauna Loa data are often used because they are the longest set of measured data.
Global emissions data are from the Global Carbon Project.
ENSO temperature data are from the Hadley Centre’s Sea Surface Temperature dataset HadSST.3.1. Note that data for October 2016 were not available at the time of writing.
For the relative effects of ENSO and emissions I have relied on the relationship found by Richard Betts and colleagues.
Anthony adds:
One thing worth noting is that Mr. Andrew’s opinion about the nature of ENSO and climate differs from the view of the NOAA ESRL author of this graph:

Klaus Wolter says:
El Niño/Southern Oscillation (ENSO) is the most important coupled ocean-atmosphere phenomenon to cause global climate variability on interannual time scales.
What is clear from his MEI graph above, is that since 1976, we’ve spent far more time in the positive (warmer) phase of ENSO than we have in the blue (colder) phase. This is backed up by a BAMS paper in 2005 by Hartmann and Wendler, who say this about the climate of Alaska:
The 1976 Pacific climate shift is examined, and its manifestations and significance in Alaskan climatology during the last half-century are demonstrated. The Pacific Decadal Oscillation index shifted in 1976 from dominantly negative values for the 25-yr time period 1951–75 to dominantly positive values for the period 1977–2001.
Mean annual and seasonal temperatures for the positive phase were up to 3.1°C higher than for the negative phase.
This shift not only translates to Pacific ocean warming and subsequent climatological effects in Alaska, but also outgassing of CO2 due to CO2 having less solubility in warmer water (think warm soda pop).
Roger Andrews noted this in 2012 in a comment left at Tallbloke’s Talkshop:
The graph compares ICOADS global SST anomalies with the Mauna Loa CO2 record, with both records 12-month smoothed to remove seasonality. The scales are adjusted so that CO2 visually tracks SST.

To illustrate the change in SST, I’ve added arrows to show the dramatic change in slope that occurred in the mid to late 70’s with SST.

The breakpoint in 1976/77 is known as the Great Pacific Climate shift, and was identified in a paper by Ebbesmeyer et. al in 1990.
In 2009, WUWT published a press release about the paper:
“The surge in global temperatures since 1977 can be attributed to a 1976 climate shift in the Pacific Ocean that made warming El Niño conditions more likely than they were over the previous 30 years and cooling La Niña conditions less likely” says corresponding author de Freitas.
“We have shown that internal global climate-system variability accounts for at least 80% of the observed global climate variation over the past half-century. It may even be more if the period of influence of major volcanoes can be more clearly identified and the corresponding data excluded from the analysis.”
The paper: http://www.agu.org/pubs/crossref/2009/2008JD011637.shtml
So while CO2 emissions have certainly increased globally since 1958…so has the positive effect of ENSO. One has to wonder what the climate argument would be like today had the great Pacific Climate Shift not occurred. I’m betting that Dr. James Hansen would not have testified in 1988 about global warming, or need to turn off the air conditioner in the hearing room to dramatize his point, but likely would have been more concerned about cooling.
wayne: We humans have nothing to do with the annual up’s and downs, the source are the variations of tropic SST ( they can absorb more or less CO2 from the atmosphere) . We h a v e to do with the long time increase.
Frank:
You wrote: “We h a v e to do with the long time increase.” Where is your evidence?
The evidence I have seen suggests that the sensitivity of climate to increasing atmospheric CO2 (from whatever cause) is so close to zero as to be insignificant. Most or all of the warming in the satellite era (since 1979) is natural recovery from two major volcanoes, El Chichon from 1982 and Pinatubo from 1991 (each for about 5 years). For the evidence, see
https://wattsupwiththat.com/2016/10/14/the-divergence-between-surface-and-lower-troposphere-global-temperature-datasets-and-its-implications/comment-page-1/#comment-2320319
Regarding the “long time increase”, one interesting hypo is that of Dan Pangburn, which suggests that long-term global temperatures correlate with the integral of solar activity, moderated primarily by the PDO/ENSO:
http://globalclimatedrivers2.blogspot.ca/
Regards, Allan
Allan,
frankclimate’s remark is about the increase of CO2, not the (non)increase in temperature…
Thank you Ferdinand – if indeed Frank is referring to CO2, not temperature, then you are correct (provided your mass balance argument is also correct). 🙂
If temps are responsible, even in part, for rising CO2 in the instrumental record period, then I’d love to see these points addressed, which seem to me to speak against that notion;
1) There was a ‘pause’ in global temps from 1940 to the 1970s. During this time, atmospheric CO2 rose. How did that happen if temps are responsible for CO2?
2) There was a slowdown in rise of global temps from 1998 to 2014, but CO2 rise was the fastest over that period than it had been since the 1950s. Why faster rate with little temp change?
3) During the Quaternary glacial transitions atmos CO2 changed by about 100ppm over the long term, while global temps changed by about 5C. Where is the 5C global warming preceding the 110ppm rise over the last century or so? MWP warmed by at most 2C global, so that can’t be it.
Om 3) I’d like to see a hypothesis that can be falsified. How about a value for increase in CO2 from 1C global warming? State any lag required, then we can test the theory.
Ferdinand has given figures for that upthread, arguing that temps can’t be responsible for recent 110ppm rise. Have any of the advocates of temp leads CO2 in the recent record given a value also – one that we can test to falsify?
I admit skipping after getting halfway through this long thread, but I hadn’t seen anything from proponents of temp-leads-CO2 in the modern period that could be falsified – hence, no useful theory. Only curve-fitting, which is definitely not what the proposition of falsifiability requires.
Did I miss something that could be used to test the hypothesis for the modern period? Feel free to link to it.
Regards, barry.
Barry wrote:
“If temps are responsible, even in part, for rising CO2 in the instrumental record period, then I’d love to see these points addressed…”
Hello Barry, here is what I think we know with confidence:
1. Global temperature T warmed to ~1940, then cooled to ~1975, then warmed to ~2000, and has since remained about the same (with the usual short-term fluctuations due to ENSO, etc.).
2. We have quality CO2 measurements since 1958 at Mauna Loa (and elsewhere since) – before that we have various estimates that may or may not be accurate. Average atmospheric CO2 since 1958 has generally increased annually by 1-2 ppm, with the seasonal Keeling curve “sawtooth” declines during each Northern Hemisphere (NH) summer, apparently dominated by NH terrestrial photosynthesis. Annualized Mauna Loa dCO2/dt has “gone negative” a few times in recent decades, specifically during the global cooling decades for 12-month intervals ending in: 1959-8; 1963-9; 1964-5; 1965-1; 1965-5; 1965-6; 1971-4; 1974-6; 1974-8; 1974-9.
3. The rate of change dCO2/dt changes ~contemporaneously with global temperature T in the modern data record, and its integral atmospheric CO2 lags temperature by ~9 months. This natural relationship is robust – comments about “curve fitting” and “spurious correlation” are specious in this case.
4. Because of points 1 and 2, I do not conclude that temperature is the only or even the primary driver of CO2.
5. I do conclude that since this dCO2/dt signal and resulting ~9 month lag is the only clear signal in the modern CO2-vs-T data record, therefore “Temperature, AMONG OTHER FACTORS, drives CO2 much more than CO2 drives temperature”. That is your testable hypothesis.
6. There could be other drivers (causes) of increasing atmospheric CO2 that include deforestation, fossil fuel combustion, deep ocean upwelling/exsolution, etc., but the dCO2/dt signal and resulting ~9 month lag survive loud and clear. These other possible “causes of increasing atmospheric CO2” are largely irrelevant to the global warming debate, because increasing atmospheric CO2 clearly does not cause significant global warming – if it did, temperature would lag rather than lead CO2 in time, and it clearly does not.
7. Furthermore, Earth is clearly CO2-deficient, and this increase in atmospheric CO2, from whatever cause(s), is beneficial to humanity and the environment.
8. In summary, the future cannot cause the past – the alleged global warming crisis is a fiction – it does not exist in scientific reality.
Regards, Allan MacRae
Post Script:
Others will probably weigh in with more comments, which are intended to support a further conclusion about the cause of the increase in atmospheric CO2. I suggest that these comments are irrelevant, in that whether correct or incorrect, they do not effect this hypothesis.
Thanks for the reply, Allan.
I do conclude that since this dCO2/dt signal and resulting ~9 month lag is the only clear signal in the modern CO2-vs-T data record, therefore “Temperature, AMONG OTHER FACTORS, drives CO2 much more than CO2 drives temperature”
Without some values given, I don’t see any way to falsify this hypothesis with any confidence. Could you state a way to do this with data available?
But I’ll do my best to ‘break’ this hypothesis as stated. No doubt you have made attempts yourself, or you wouldn’t be posting it with any confidence. I’d be curious to know how you’ve attempted to ‘break’ it.
One way I can think to break the hypothesis is to test various periods and see how well CO2 rise and temp rise correlate. As there is a purported lag of 9 months, then I need to choose a longer period. Of course, the annual cycle means that I need to choose a period longer than a year. And in case the ENSO fluctuations given in the OP have merit, I’d have to allow for a few cycles, so I’m going to go with a minimum of a decade, hopefully more.
Essentially, I’m going to look for the longest cooling or flat period in the instrumental record and see if atmos CO2 ceased rising (after 9 months?) or slowed or decreased. I’ll also compare with periods that have a strong rise in temps.
I’ll choose HadCRUt data for temps, and the ML data set, as that is the longest instrumental record we have of atmos CO2.
1959 – 1980 (Dec) temp trend is flat, at -0.003 C/decade.
CO2 rate = 0.97ppm/yr
1974 – 1997 (Dec) gives a warming rate of 0.18C/decade
CO2 rate = 1.37ppm/yr
1998 – 2012 (Dec) temp trend = 0.05 C/decade
CO2 rate = 1.77ppm/yr
First period (22 years) shows flat temps with CO2 rise.
Second period (24 years) shows strong warming trend with accelerated CO2 rise.
Third period shows ‘slowdown’, but accelerated CO2 rise.
These are the best periods I could think of to try to break your hypothesis. I think these quick and dirty tests throw a fair bit of cold water on the notion that temps have had much to do with the long-term CO2 rise. I think it is pretty well demonstrated by you (and the OP) that CO2 fluctuates interannually by temps.
Annual atmos CO2 rise has been nearly monotonic, with some acceleration. This correlates well with anthro emissions, but not with the much more various temp record. (Derivatives greatly magnify tiny fluctuations. href=http://www.woodfortrees.org/plot/hadcrut4gl/from:1959/plot/esrl-co2/from:1959/derivative>Here is what the graph looks like without scaling and factoring).
I’d be curious to know what your best methods for breaking your hypothesis would be.
It would be great to get a value for predicted CO2 rise from 1C of global temp rise.
For example, If 5C temp rise over 5000 years gives us 100ppm from the last ice age to the current interglacial, what does that give us for about 100 years and 0.08C rise?
Or perhaps you have another way to calculate this?
Hi Barry.
Like some others, you are making a fundamental error: Please address what I have written on this subject, not what others have said. Others, who say temperature is the only or primary cause of increasing atmospheric CO2, may be taking my hypothesis “a bridge too far”, when there is no real need to do so. To falsify the false global warming alarmist hypothesis, one only has to show that CO2 lags and does not lead temperature, and why, which I have done.
I have used up my allotted time talking with Ferdinand, so I will “cut to the chase”.
My hypothesis was discussed extensively in 2008-2009, because it contradicted the popular notion that increasing atmospheric CO2 primarily caused rising temperature, which was false. Both sides of the fractious global warming debate (the warmists AND the skeptics) bitterly contested my hypothesis.
The close dCO2/dt relationship and resulting 9-month lag of CO2 after temperature is now generally accepted, even among many warmists. The best counter-argument the warmists have suggested is that the ~9-month lag “must be a feedback effect”, which is a cargo-cult argument:
“We KNOW CO2 drives warming (our paychecks depend on it), therefore it MUST BE a feedback effect.”
You have not read the relevant information above on this thread. Here is one depiction of the subject dCO2/dt vs T relationship, although I think it is slightly different mathematically from my own, which I suggest is technically more correct.
http://www.woodfortrees.org/plot/esrl-co2/from:1979/mean:12/derivative/plot/uah5/from:1979/scale:0.22/offset:0.14
If you want to check my math, the 2008 spreadsheet is here – see Figures 1 to 4.
http://icecap.us/images/uploads/CO2vsTMacRaeFig5b.xls
I used UAH LT and Hadcrut3 for temperatures, and global CO2 concentrations back to 1979. The dCO2/dt vs T correlation holds.
In a separate unpublished spreadsheet I used Hadcrut3 and Mauna Loa CO2 back to 1958 and the correlation still held.
I no longer use the surface temperature data, Hadcrut or other, because I have lost confidence in its accuracy, especially due to all the recent “adjustments”.
In conclusion, I remain reasonably confident that the future cannot cause the past (in our current space-time continuum). 🙂
Regards, Allan
Post Script:
Statistician Bill Briggs also examined my hypo in 2008 using a completely different approach, and supported my conclusion (even though I did not like his methodology much. because it only examined a 12-month lag).
http://wmbriggs.com/post/122/
See also Humlum et al, January 2013, written five years after my icecap.us paper:
http://www.sciencedirect.com/science/article/pii/S0921818112001658
Highlights
– Changes in global atmospheric CO2 are lagging 11–12 months behind changes in global sea surface temperature.
– Changes in global atmospheric CO2 are lagging 9.5–10 months behind changes in global air surface temperature.
– Changes in global atmospheric CO2 are lagging about 9 months behind changes in global lower troposphere temperature.
– Changes in ocean temperatures explain a substantial part of the observed changes in atmospheric CO2 since January 1980.
– Changes in atmospheric CO2 are not tracking changes in human emissions.
****************
Thanks again, Allan. It seems my reply has prompted you to repeat much of your earlier comments. I’ll try and distill.
1) In what ways have you attempted to break your own hypothesis? What statement/s have you made that could be falsified, and how have you attempted to do this?
2) The derivative of CO2 shows interannual fluctuations consistent with temperature (which I expect and accept), but does not help us demonstrate long-term growth, because that function removes the trend. It does, however, reveal a small acceleration – there is a trend in the derivative itself, albeit orders of magnitude smaller than the actual CO2 trend. You are not in any way addressing long-term Temp–>CO2 growth that I can see, only interannual variation. Hence the thrust of my original questions.
Here is a graph of the derivative of temps since 1979 plus the trend of that. As you can see just about perfectly flat. Derivative function removes linear trend, thus you cannot demonstrate temp–>CO2 link to long-term change using this function, only interannual fluctuation (which is accepted).
It is troubling that you cannot furnish a value for CO2 rise from temps. This makes the hypothesis unfalsifiable, as there is no quantification for the relationship over time, hence my repeated requests for something more concrete.
To sum up, the derivative of CO2 shows interannual fluctuations and a slight acceleration in the trend. But it cannot reveal that temperature rise over the long term is responsible for any CO2 rise. Thus, we need a quantitative equation or statement on this that can be tested.
I’d add (again) that the aceleration demonstrated by the derivative of CO2 is consistent with anthropogenic source.
I know you don’t agree with the mass balance argument, but it is quite a difficult stumbling block for your theory. If anthro emissions are about twice that of the annual increase over time, and this relationship is quite consistent (it is), then rejecting that argument requires some pretty tortuous logic. Allowing for slight interannual variation, the long-term correlation is astoundingly good.
Allan,
You are using false arguments:
The best counter-argument the warmists have suggested is that the ~9-month lag “must be a feedback effect”
That is not what warmists or luke-warmers like myself say. The ~9 month lag is the transient response of (mainly tropical vegetation) CO2 to temperature (and humudity) changes. That is clearly said by NOAA’s Pieter Tans at his speech at the 50 years Mauna Loa data festivities in 2007 (that is before the publication of your theory):
http://esrl.noaa.gov/gmd/co2conference/pdfs/tans.pdf from slide 11 on.
What you still don’t see is that the ~9 months lag is solely for the small variability around the trend, not for the trend itself. By including the slope of dCO2/dt with some “trend matching” arbitrary offset and factor, you attribute all the trend to temperature, which is completely bogus, as you compare T with dCO2/dt, where in dCO2/dt most of the slightly quadratic increase in the atmosphere is already removed. Only a linear increase in dCO2/dt remains, but that is not caused by temperature, as the derivative of temperature is completely flat and the increase in T is down, up, flat, while CO2 is always up, every year of the past 55+ years…
Again, comparing T with dCO2/dt is not done: either you compare T with CO2 or dT/dt with dCO2/dt. Comparing T with dCO2/dt has no physical meaning.
That all has nothing to do with the mass balance or any of the many other observations that point to the human cause for the bulk of the CO2 increase in the atmosphere. This is simple logic which shows that you (and Humlum) compare apples to oranges and then conclude that red apples are oranges, because they have the same color…
Barry – now you are talking like a Ferdinand clone. I won’t address your comments in detail because they are largely irrelevant, as were Ferdinand’s. Repeating, I do not care about the source of CO2,
You are asking me to sift through and retrieve almost a decade of correspondence on this subject to satisfy your lack of reading.
FYI, Ferdinand and I both made monthly predictions of CO2 based on temperature many years ago on wattsup, for up to ~9 months into the future – see if you can find them.
Allan,
Our discussion boils down to one point only: does the 110 ppmv CO2 increase (80 ppmv since Mauna Loa) leads or lags temperature?
Hello Ferdinand – my answer to your question follows:
I stated above:
“Global temperature T warmed to ~1940, then cooled to ~1975, then warmed to ~2000, and has since remained about the same (with the usual short-term fluctuations due to ENSO, etc.).”
During this time period, atmospheric CO2 generally increased, with a few 12-month reversals during cooling periods.
In answer to your question:
There is NO clear relationship between TOTAL atmospheric CO2 and temperature – total CO2 neither leads nor lags the temperature curve. The observation that CO2 is generally increasing says nothing about lead/lag or cause/effect. You seem to disagree on this point but you should not.
Nevertheless, there is a clear signal in the modern (since 1958) data that dCO2/dt varies ~contemporaneously with temperature T, and its integral atmospheric CO2 LAGS temperature by ~9 months. This relationship has a clear lead/lag and cause/effect, in which temperature LEADS CO2 by about 9 months.
One possible interpretation, which you favour, is that there is an underlying primary cause of most of the CO2 increase, and you attribute that cause to fossil fuel combustion. You may be right, but it is also possible you are wrong. I do not really care, nor do I take a position on this point, because I see no need, pending more CO2 satellite data. I regard this point, which you deem of great importance, to be largely irrelevant to the fractious global warming debate.
The fact that this clear dCO2/dt signal survives “on top” of your alleged underlying “cause of most of the CO2 increase” suggests that, regardless of the cause of that “base CO2 increase”:
1. Temperature, among other causes, drives CO2 much more than CO2 drives temperature.
2. Therefore, the alleged global warming crisis is a fiction, and the squandering of trillions of dollars to “fight global warming” is a waste of scarce global resources that should be spent on much more important human and environmental needs.
3. Furthermore, atmospheric CO2 is not alarmingly high, it is alarmingly low for the continued survival of terrestrial carbon-based life on Earth.
4. In a decade or less, this increase in atmospheric CO2, from whatever cause, will be viewed as beneficial and not harmful.
That is my position
Best personal regards, Allan
Allan,
1. The observation that CO2 is generally increasing says nothing about lead/lag or cause/effect.
Regardless of the cause or the short term variability, there is Henry’s law for the solubility of CO2 in seawater with temperature. That is surpassed with some 110 ppmv by now, which is not seen in any ice core in the past 800,000 years. What else do you need as proof that total CO2 leads total T over the past 165 years?
2. dCO2/dt varies ~contemporaneously with temperature T, and its integral atmospheric CO2 LAGS temperature by ~9 months.
The integral of dCO2/dt doesn’t lag T. The integral is the full CO2 increase which doesn’t follow T at all: it is increasing much faster, slightly quadratic, compared to any up and down influence of temperature on CO2 from oceans (16 ppmv/K) or vegetation (a net sink of average ~1 GtC/year). The lag is only for the small influence of temperature (+/- a few tenths of K) on the variability in CO2 (+/- 1.5 ppmv) around a trend of 80 ppmv…
3. Temperature, among other causes, drives CO2 much more than CO2 drives temperature.
You can’t conclude that on the base of the lag of CO2 variabilty after T variability: the temperature to CO2 effect is only 4-5 ppmv/K. That is the only lag you have with certainty. That is no proof that the 110 ppmv rise since ~1850 has no effect on temperature, as you haven’t proven that there is a lag of CO2 after temperature for the total increase. It may have been reversed: the extra CO2 may have caused (part of) the T increase…
No problem with the other points…
Ferdinand you wrote:
“What else do you need as proof that total CO2 leads total T over the past 165 years?”
With respect, your definition of “leads” is meaningless, because the 20th-century data shows there is NO correlation in which increasing atmospheric CO2 caused a significant increase in global temperature – in fact, increasing CO2 occurred when temperature went up, down, up and sideways.
Using your definition Ferdinand, increasing CO2 leads everything, and thus could be the primary cause of the declining production of buggy whips.
Allan,
There is certainly a reasonable correlation between CO2 and temperature:
http://www.ferdinand-engelbeen.be/klimaat/klim_img/temp_co2_1960_cur.jpg
That doesn’t prove causation, but you can’t conclude that there is no causation either way…
Ferdinand you wrote: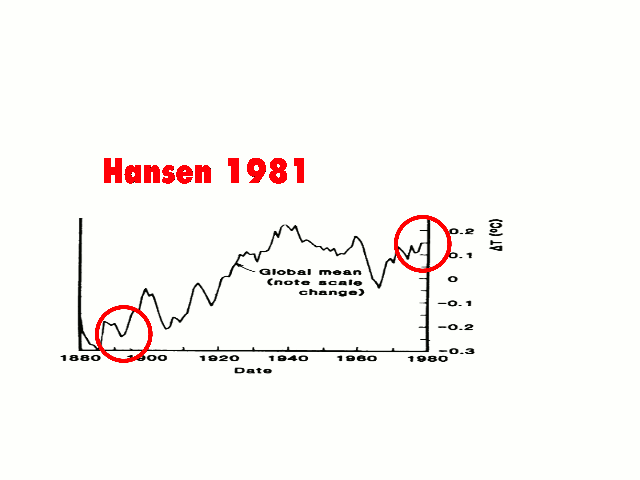
“There is certainly a reasonable correlation between CO2 and temperature…”
Sorry, but your above statement is unsupported by the data – it is false.
Here is a Surface Temperature (ST) data record, starting with Mann in 1981, and then mutating to GISS 2014 – after all the “adjustments”.
Source: https://stevengoddard.wordpress.com/alterations-to-climate-data/
I regard the Mann 1981 data as the least corrupted. As CO2 (allegedly) strongly increased after ~1940 due to fossil fuel combustion, (there is quality data only after 1958, at Mauna Loa), surface temperature DECREASED from ~1940 to ~1975, INCREASED to ~2000, and has since stayed about the same.
Thus your alleged correlation of temperature with CO2 has been down, up and sideways – actually, no correlation at all.
Regards, Allan
Allan,
I used the HadCRU data, except for the past few years – after the NOAA manipulation – less manipulated than GISS, but that doesn’t matter much, there is still a reasonable correlation if you use the shorter RSS or UAH data periods.
So we agree that temperature did go up and down in the past decades, but in general up, certainly in the period 1975-2000, but in general since 1850, when also CO2 started to increase.
Statistically it doesn’t mean anything that temperature in some periods goes down and in others goes up, that is natural variability.
Sea level goes up and down with meters per minute by waves and meters twice a day with the tides, still there is a -statistical- increase of a few mm/year deducable from tide gauges, even if you need 25 years of data before it can be calculated with sufficient accuracy…
In the case of T and CO2, it is certain that both did go up at least since 1976, statistically significant. Both UAH and RSS give a (for a natural process at one side) reasonable correlation (the 2016 extreme temperature peak excluded):
http://www.ferdinand-engelbeen.be/klimaat/klim_img/acc_temp_rss_uah.jpg
The correlation is heavily influenced by the 1998 El Niño. The steeper UAH temperature curve gives already a higher correlation and longer periods where both go up will only make it better…
Still you can’t say that there is no correlation and that CO2 can’t influence temperature over longer periods…
That doesn’t mean that I don’t agree with you that the influence of CO2 on T is minimal and harmless, but you have no proof of zero influence of CO2 on T, even if the (small) variability in CO2 around the (huge) CO2 trend lags the (huge) variability in T around the (small) T trend…
Ferdinand my friend, you wrote:
“So we agree that temperature did go up and down in the past decades, but in general up, certainly in the period 1975-2000, but in general since 1850, when also CO2 started to increase.
Statistically it doesn’t mean anything that temperature in some periods goes down and in others goes up, that is natural variability.”
Re your points:
1. Temperature increased since ~1850: I suggest a this was a natural recovery after the Little Ice Age. Also a recovery from the cooling effect of the huge Mt. Tambora eruption (1815), a VEI-7 event. I suggest there is no evidence that atmospheric CO2 played a significant causative role in the warming since ~1800 or ~1850.
2. Temperature increased from 1975-2000: This warming corresponded to the Great Climate Shift of 1977, which was also naturally-caused. Also, much of the warming since the satellites were launched in 1979 was a natural recovery from the eruptions of El Chichon (1982) and Pinatubo (1991). Please see
https://wattsupwiththat.com/2016/10/14/the-divergence-between-surface-and-lower-troposphere-global-temperature-datasets-and-its-implications/comment-page-1/#comment-2320319
NOT A WHOLE LOTTA GLOBAL WARMING GOIN’ ON! Please see and understand this plot:
https://www.facebook.com/photo.php?fbid=1106756229401938&set=a.1012901982120697.1073741826.100002027142240&type=3&theater
Please also see Bill Illis’ plot here, which is excellent predates my work on this subject:
3. Statistically, your correlation is NOT causation. In fact, your correlation is very poor, because of the natural cooling that occurred from ~1940 to ~1975, just as fossil fuel combustion strongly accelerated, and the so-called “Pause” since ~2000, all as CO2 increased. Also, the slope of the warming up to ~1940 is the same as the slope of the warming from ~1975-2000, so again there is no evidence that increasing CO2 was the cause of any part of this warming.
4. The logical conclusion is that the Null Hypothesis stands – there is no evidence that anything other than natural climate variability has governed the last 150-200 years of global temperature and climate change.
5. I will allow that your Mass Balance Argument could be correct and fossil fuel combustion could be the primary cause of increased atmospheric CO2. I just allow for other possibilities to exist in the huge CO2/water cycle. I am officially agnostic on this point, pending further data from new satellites.
Richard Feynman wrote: “The test of science is its ability to predict.’
Let me close by asking you to predict global temperature over the next few years:
I wrote in 2002 that global cooling will be start by 2020-2030; I now say it will probably start by 2020 or perhaps sooner, because of low solar activity.
What do you say, my friend?
Others are also welcome to play. Ladies and germs, faites vos jeux!
Best personal regards, Allan
Allan,
I do largely agree with all what you wrote, except the null hypothesis:
That is not that I can’t prove that CO2 has some influence, it is that you can’t prove that there is no influence.
There is certainly a small positive trend in temperature with a large variability around it. There is certainly a huge trend in CO2 with a small variability around it. Yearly or decadal variations in slope of temperature don’t change that, one only need to be careful with begin and endpoint bias.
While I do agree that natural variability (PDO, ENSO, Pinatubo,…) has the largest influence, that doesn’t prove that CO2 has zero influence. Theoretically, some 2 W/m2 since 1850 (without any feedback) or some 0.5°C: about half the total warming. Even RSS and UAH show a warming of resp. 0.35°C and 0.42°C over the past 36 years (before 2016) There is nothing in the data which refutes that the warming is partly caused by the increase of CO2.
Of course you can predict temperatures a few months ahead by looking at tropical seawater temperatures etc.. Again that says nothing about the cause of the warming oceans, including ENSO…
My best guess is that we will have a continuing of the plateau since 2000, maybe even with a little upjump as was the case after the 1998-2000 super El Niño / La Niña, until 2030…
Ferdinand you wrote:
“That is not that I can’t prove that CO2 has some influence, it is that you can’t prove that there is no influence.”
Ferdinand, I always thought the onus was on the person who wanted to disprove the Null Hypothesis (in this case by proving that CO2 significantly drives global warming) to do so. If you cannot disprove the Null Hypothesis, then it stands, as follows:
“Major changes in global temperature are overwhelmingly natural and are not caused by human activities.”
This does not preclude minor local temperature effects due to land use changes, energy usage. etc., but there is no evidence that increasing atmospheric CO2 is a major driver of global warming – thus the alleged dangerous manmade global warming crisis is a fiction. It is also extremely costly, wasteful and dangerous, the latter due to foolish “green energy” policies that have driven up energy costs, destabilized the electricity grid, and increased Excess Winter Mortality, especially among the elderly and the poor.
I suggest the work of Bill Illis helps to provide an upper bound on the very small impact of increasing CO2 on temperature. Bill’s plot is above, and his equation is:
[Tropics Troposphere Temp = 0.288 * Nino 3.4 Index (of 3 months previous) + 0.499 * AMO Index + -3.22 * Aerosol Optical Depth volcano Index + 0.07 Constant + 0.4395*Ln(CO2) – 2.59 CO2 constant].
Using this formula, total warming due to the CO2 increase from 280 to 400 ppm is LESS THAN 0.2C. This upper bound of <0.2C would be consistent with much of my work on this subject.
In the longer term, ocean temperatures are probably driven by the integral of solar activity, as suggested by the work of Dan Pangburn, among others.
Remember, my position is NOT that increasing atmospheric CO2 has NO influence on global temperature – it is that
"Temperature, among other factors, drives atmospheric CO2 much more than CO2 drives temperature."
I do appreciate much of your most recent post. I suggest that we agree more than we disagree – it just took a long time to get to this conclusion.
Best, Allan
Post Script: I really hope you are correct in your temperature prediction and I am incorrect – humanity and the environment do much better in a warmer world.
Today is Remembrance Day in Britain and the Commonwealth.
I shall sign off for the rest of the day.
Regards, Allan MacRae
I recommend these videos:
https://www.theguardian.com/uk-news/video/2014/nov/11/remembrance-day-last-poppy-tower-london-video
https://www.theguardian.com/world/video/2014/nov/11/tower-of-london-poppies-aerial-view-video
In Flanders Fields
by Lt. Col. John McCrae MD, May 3, 1915
In Flanders fields the poppies blow
Between the crosses, row on row,
That mark our place; and in the sky
The larks, still bravely singing, fly
Scarce heard amid the guns below.
We are the Dead. Short days ago
We lived, felt dawn, saw sunset glow,
Loved and were loved, and now we lie
In Flanders fields.
Take up our quarrel with the foe:
To you from failing hands we throw
The torch; be yours to hold it high.
If ye break faith with us who die
We shall not sleep, though poppies grow
In Flanders fields.
Allan:
Major changes in global temperature are overwhelmingly natural and are not caused by human activities.
If that is your null hypothesis, you have only proven that the changes over the year by year variability +/- 1.5 ppmv CO2 around the trend is overwhelmingly natural, but you have not proven that the trend of 80 ppmv since Mauna Loa is not caused by human activity and that such an increase has no influence on temperature. Thus the null hypothesis still stands…
BTW, my late father was a WWI veteran, captured after 10 days by the Germans and spent 4 years as war prisoner in Germany, the last years – lucky for him – by working at a farm, so he had at least some food… not all were that lucky and many did never return… His grave is on the war memorial of the two WW’s…
Allan,
The second part of your null hypothesis:
and are not caused by human activities
is not disprovable, as the increase in temperature can be a mix between 0-100% of natural and human causes. Only if temperature goes down over longer periods and CO2 (NOT dCO2/dt) goes down over the same -long- period, that can be seen as proof.
Until now, the opposite happens: CO2 goes up regardless of what temperature does, only the rate of change is influenced by temperature variations, the trend hardly is. For me sufficient proof that humans are at the base of the CO2 increase (and may somewhat influence temperature)…
All,
If you have the chance to come to Flanders, Belgium. have a visit to the many graveyards from WWI, reachable by bike (rentable at Ypres railway station) all along the WWI frontline or by car.
Everybody who has seen the countless graves in Flanders Fields is impressed by the madness of war, where so many young men died for the glory of a few mighty who only wanted more power…
“Clone”
This is meant to dismiss, but doesn’t it occur to you that two individuals correctly see the imperfections in your reasoning, and that this corroborates, rather than detracts from, the veracity of the criticisms?
Actually, no.
Reprise – for John MacDonald – looks like you got your wish John.
Best personal regards, and best wishes for America, from Allan
Allan MacRae, P.Eng., Calgary
https://wattsupwiththat.com/2016/10/24/the-clintons-renewables-plan-would-create-green-jobs-but-would-also-destroy-real-jobs/comment-page-1/#comment-2326086
Hi John MacDonald,
My serious comments in the above post were these, and they were very serious:
“A USA election is imminent. For most countries, I suggest that the question of a Hillary vs a Donald would come down to “who gets energy right (Donald), and who gets it utterly wrong (Hillary).”
Cheap, reliable abundant energy is the lifeblood of society, and our very cheap fossil fuel energy should provide our two countries with an overwhelming economic advantage, IF the greens would stop sabotaging our economies to advance their far-left political objectives.
Since the USA is a global power, there are more issues than just the domestic economy.”
I tend to agree with your comments John, regarding the risks to “liberty and freedom, the rule of law and the survival of the Constitution”. However, as a Canadian I do not think I should comment on these matters. The American people have a critically important choice to make, and you should understand these issues far better than I do.
I hope your voters do not get dragged down by the mud-slinging that is going on, and focus on the facts that matter. For the Clintons to focus on Trump’s alleged sexual misconduct, given Bill’s sordid history, is a remarkably bold attempt to influence the stupidest voters in America.
I have never liked campaigns to “get out the vote”. I would be much happier if there was a campaign to urge really stupid voters to stay home – something like a skill-testing question on a billboard, with the caption:
“If you are too stupid to answer this question, STAY HOME – you’re way too stupid to vote!” 🙂
Regards, Allan