
The sun has been completely spotless on 21 days in 2016 and it is currently featuring just one lonely sunspot region.
In fact, on June 4th of this year, the sun went completely spotless for the first time since 2011 and that quiet spell lasted for about four days. Sunspot regions then reappeared for the next few weeks on a sporadic basis, but that was followed by several more completely spotless days on the surface of the sun.
The increasingly frequent blank sun is a sign that the next solar minimum is approaching and there will be an even greater number of spotless days over the next few years. At first, the blankness will stretch for just a few days at a time, then it’ll continue for weeks at a time, and finally it should last for months at a time when the sunspot cycle reaches its nadir. The next solar minimum phase is expected to take place around 2019 or 2020. The current solar cycle is the 24th since 1755 when extensive recording of solar sunspot activity began and is the weakest in more than a century with the fewest sunspots since cycle 14 peaked in February 1906.
One other note, the weak solar cycle and the expectation for continued low solar activity this upcoming winter is an important factor in this year’s colder-than-normal Winter Outlook for the Mid-Atlantic region.
more at Vencore Weather
Hugh Hudson had a nice ‘nugget’ on this:
http://sprg.ssl.berkeley.edu/~tohban/wiki/index.php/Spotlessness_returns
with an interesting comment: ” It is remarkable that solar magnetic activity actually does not seem to care whether or not sunspots form, suggesting strongly that these beautiful things are just blemishes on the surface of the Sun, fascinating for many reasons but not at all representing the action of the solar dynamo that we imagine to pulse powerfully away in the deep solar interior”.
Svensmark says this in similar fashion. He notes the odd difference in long run revised trend in sun spots (flat), versus elevated trend in magnetic field over the same 100 year trend.
Svensmark is not correct about this. He does not understand the processes involved. Perhaps you could provide a link to his exact statement on this.
See Svensmark lecture on YouTube December 2015.
If you want people to look at it, give a link.
The discussion of revised sun spot data and magnetic fields is near the end of the talk.
He was certainly right about this:
http://www.leif.org/research/Solar-Theory-Dead.png
Yes, I thought that would result in cherry picking that plumb slide….while not addressing the question.
There is really nothing to address. One could spend all one’s time to address misconceptions and errors to no avail. The revised sunspot series is the best data we have. If you disregard that because it conflicts with your pet idea, it is your loss.
What pet issue? I’m just trying to understand Svensmark’s point or issue.
Well maybe not, but something causes them to come and go on a regular basis. And in the context of the Earth’s temperature it seems we have had some pretty cold spells when they are not there.
So is there a causal effect on temperature? One thing we do have coming into the next period of solar minimums are satellites that can measure all sorts of things so in the next 30 years or so if the data doesn’t get corrupted by zealots, maybe we can see just what effect it has.
The Russians are betting on colder temps and if anyone knows cold, they do.
Yes, and the Russians tried to tell us how to build the Alaskan pipeline——–nyet, no bury.
low sunspots also seem to be when we get more and stronger quakes as well.
The Next ‘Little Ice Age’ Is Already Here, Russian Scientist Claims
A new study by a prominent Russian astrophysicist claims the “new Little Ice Age” started at the end of 2015 due to low solar activity, kicking off decades of “deep cooling” in the latter half of the 21st Century.
http://dailycaller.com/2016/10/31/the-next-little-ice-age-is-already-here-russian-scientist-claims/#ixzz4OgrbzyjZ
He has already been falsified by the data:
http://www.leif.org/research/Abdussa3.png
Thanks!…I thought you would know
The Daily Caller link references a Dr Easterbrook book and a December, 2013 Climate Depot article where Dr Norman Page seems to align himself with the Russian scientist’s work. Both have made comments at this site in the past.
I grow wary of predictions that we are sliding into the next LIA type of cooling,there have been too much certainty in it.
It is far more likely that it will cool slowly over the next few decades,then shift back to a warming trend again,just as it has been the past 300 + years,since the bottom of the LIA in the 1600’s.
I’m watching with interest because of some of the things that Isvalgaard has stated. We can always learn something from any event. I have too many loose ends right now to say whether globally temperatures will fall. I feel fairly certain that we won’t see temps like we did with the past el nino for awhile. I don’t have enough of the when, where, and how. Solar cycles still seem to follow their own path.
From an arguments sake a low solar cycle and colder climate would confirm that connection. As a practical matter, I never want to see the 1970s again. Not a fan of a colder world.
Good points.
But we’re stuck in an Ice Age with alternating glaciations and short warm periods. Even if the Sun is assumed to be a constant and only has an effect on local climates, the next glaciation is certainly going to occur. I think even the most rabid warmist would hope that the Earth does enter the next glaciation during their lifetimes even it they truly believe, without a shred of proof, that the Earth will boil over during their lifetimes..
When will glacial begin … is the big question. That’s my big gripe about AGW. They are spending time and money on a non problem instead of trying to find out the real reason for when the climate changes.
“When will glacial begin … is the big question.”
Next glacial may not start as long as the N.E. Canada rebound is going, it keeps Mid Atlantic Ridge active. Once those two stop it might take a while but it will not be long off.
Magma under the ridge will start to solidify further and further down, joining the two plates. All volcanic activity will cease, with a new Ice age taking hold. It will take N.Canada wide external pressure around or above 2000kg/cm2 to crack open the plates boundary again, but when it does happen the MAR will go off with a truly big bang resulting in an imminent de-glaciation.
Then whole thing will start all over again.
(the above is a summary of the currently in ‘writing’ but as yet unknown vukcevic et al glaciation hypothesis)
See Svensmark lecture on YouTube December 2015.
I assume you mean this one, apparently delivered 12/12/2015 in Essen, Germany, and uploaded 04/22/2016:
The poster behind Dr. Svensmark suggests the Heartland Institute was one of the sponsors.
When the question is
Do sunflares impact aerosols which are steering elements of earth’s climate.
Johann, do you mean cloud condensation nuclei?
Crispin, yes –
that’s we’re talking about here .
And that’s just one thing the computer models never be able to solve.
Perhaps the lack of flaring encourages CCN through the mechanism of increased cosmic rays reaching our atmosphere. Tony Phillips is quietly gathering evidence that might later influence NASA’s position on anthro-climate forcing, once the progressive scientologists are purged from its ranks.
What does this mean for California?
Carbon taxes and large government expenditure on solar and wind. Repeat as needed.
Don’t forget the Toy Trains from Nowhere to Nowhere else.
g
California will still enjoy all four of it’s seasons: drought, fire, mudslides and earthquake.
And a bonus season called elections
We Have the KFC Bird Fry Season too; or izzat the Fly to Fry Season ??
g
This is a direct cause of CO2 emission and pipeline expansion across the continent. When will man be stopped!
You are wrong about this. CO2 does not influence the sunspots.
Your sarcasm detector needs to be recalibrated.
Yes, I agree with Leif. If intended as sarcasm, add a /sarc at the end of such comments.
Well, stars like the sun do make carbon and oxygen.
/sarc
I can’t believe you guys didn’t catch that……….
So, it’s just because of the pipeline expansion?
May the Sioux save us all!
/s <– seriously? I have to put that now? It wasn't even subtle sarcasm, it was blatantly sarcastic.
This is a blog about the science, not to be polluted by sarcasm.
Oh come on guys, even I got that one. Everyone needs ti chill.
I’m amazed Leif!
I thought CO2 could do anything!
/SARC/
This is a blog about the science, not to be polluted by sarcasm….
You mean your past posts were not sarcasm!!!!!
😉 <<< WINK
polluted by sarcasm?
Sheesh.
Large number of sarcastic comments self deleted.
lsvalgaard You are wrong about this. CO2 does not influence the sunspots
Now stop this Leif. You are just throwing bait to the Carp for a ‘rise’…
Oops! Did I forget a /sarc ?
Grandparent actually said the quiet sun was a “direct _cause_ of CO2 emission”, not a result of CO2 emission.
I think cold weather does cause anthropogenic CO2 emission (running the heater). But then, so does hot weather (running the AC).
KB, across the world’s population, the airconditioner owners are a small minority compared to those with access to heating in cold weather.
Man releases Copious CO2. –>Earth’s atmosphere warms.–> The atmosphere expands. –>Earth spins slower. –> Magnetic reconnection to the solar plasma is more efficient –> Angular momentum is transferred from the sun to the Earth. –> The Sun slows its spin. –> Magnetic flux tubes rise more slowly as the twisting of ploidial magnetic fields slows –> fewer sunspots.
IOW, the microbial flagella on the flea on the dog’s tail wags the dog.
If you look at the forces and energies involved, you will find that your chain does not hold up.
What does hold up Leif?
The world is full of stuff. If you have something particular in mind, bring it up and we can discuss it.
/phantasmorphic amounts of sarcasm requires phantasmorphic amounts of BS.
Bring on your BS.
RE: BS.
See Vuke (below).
Is the BS his or yours?
Leif wrote:
Frequently here on WUWT and other blogs, that same harsh analysis of the CO2-CAGW hypothesis is shown. But that doesn’t stop NOAA, NASA and other climatists though with their climate alarmist BS.
I’m Tired of the climate BS and lies.
But I’m afraid we’ll be subjected to 4 more years of even more intense BS and lies with POTUS HRC.
People have the politicians they deserve [having voted them in]…
How about a complex climate system interaction over a long term scale? We seem to look for instant answers and they all fail. What does the next 50 years hold based upon our current situation? The world does hold much stuff, no? How about, could the impact of phytoplankton in the Southern Hemisphere have more impact than anything we’ve seen yet? How does deep water brine currents impact the SAL via the Monsoon cycle and the S American rain forrest fertilization? Just sayin 😉
People [and politicians] are enamored by simple [and simplistic] explanations. Now many aspects of climate are actually simple, while others are very complicated. Critical to all explanations is that they are quantitative, i.e. that they deliver numerical predictions that can be tested [and falsified]. We might on day be bale to explain the climate, but we are not there yet.
Leif wrote, “People have the politicians they deserve [having voted them in]…”
Does that include dead voters? illegal alien voters?
If a people allow such things, they doubly deserve what they get…
“IOW, the microbial flagella on the flea on the dog’s tail wags the dog.”
Leif, you missed this line.
The line does not apply as the sun lags the nervous system that the dog has.
its actually two other gasses Hydrogen and Helium /sarc
The Sun !
What he make Hydrogen out of ??
g
Hi Big G.
In my parts of the universe The Sun is to say least an interesting tabloid, but of course we have The daily Star too. /sarc
Read carefully what he said, i.e., that the decreased sunspot activity is the cause of CO2 emission and pipeline expansion. If the weather were to get colder and people burned more fuel, it would be true, although the effect might be negligible.
Thumbs up for you! My bad word play has caused a sarcasm to be a truth.
Well you know this just proves that Global Warming is Real.
Because Science!!!, says Neil Tyson.
Somebody has their color spectrum out of whack there.
So white lies between purple and red ??
g
La Niña can be quite strong.
http://www.tropicaltidbits.com/analysis/ocean/nino34.png
Very high pressure in the Arctic.
http://pamola.um.maine.edu/fcst_frames/GFS-025deg/DailySummary/GFS-025deg_WORLD-CED_PMSL.png
Polar vortex.
http://www.cpc.ncep.noaa.gov/products/stratosphere/strat_a_f/gif_files/gfs_z10_nh_f00.png
Sun’s magnetic field.
http://wso.stanford.edu/gifs/DipallR.gif
We’ll have October number tomorrow, watch this space.
For the moment suffice to say the magnetic dipole (polar field) strength has stalled, while it was suppose to power ahead towards maximum as the sunspot number is heading towards minimum.
Not correct. The south polar fields have stabilized, the north is still increasing:
http://jsoc.stanford.edu/data/hmi/polarfield/
http://www.leif.org/research/HMI-Polar-Fields-Growth.png
The arrow shows positive polarity on its way to the north pole.
It helps if one knows a bit about what is going one.
It helps if one knows a bit about what is going one….<- sarcasm pollution alert
/SNARK
lsvalgaard October 31, 2016 at 12:09 pm
Not correct. The south polar fields have stabilized, the north is still increasing:
http://jsoc.stanford.edu/data/hmi/polarfield/
__________________________________
Did you look at the amount negative flux ah just ahead of your arrows tail? That positive flux has made some feeble attempts to strengthen and push northward, but but looks like there is still troubles ahead. Still has a lot of pink mixed with light blue at the northern lats Dr. S.
Hasn’t the mixed polarity been the issue this cycle for the movement of positive flux northward? A cancelling out of the positive flux?
Ya know it appears as though the high speed solar wind streams from coronal holes don’t have much of an effect on pushing out the galactic cosmic rays (GCR). Solar cycle 24 has shown us a new continuous higher level of them.
From Anthony’s link above:
http://www.vencoreweather.com/blog/2016/10/24/2016-2017-winter-outlook-by-vencore-weather
…Low solar activity
Research and empirical observations have shown that low solar activity tends to be correlated with frequent high-latitude atmospheric blocking patterns …
…The “analog years” plot (below) shows upper-level height anomalies in previous low solar activity years (i.e., during solar minimum phases) and high pressure tended to dominate near Greenland and Iceland (orange, red regions) which typically leads to sustained cold air outbreaks into the eastern US. Based on the actual results of these previous low solar activity years, odds would favor high-latitude blocking scenarios this upcoming winter season given the strong likelihood for low solar activity to continue….
It would appear as though the northern polar vortex has already set the stage of some of what the Vencore prediction discusses at the link above.
Link below to Earth Wind map, depicting current northern polar vortex.
https://earth.nullschool.net/#current/wind/isobaric/10hPa/overlay=temp/orthographic=-94.17,89.76,455/loc=-16.131,84.586
And quite visible at 70 hPa also.
https://earth.nullschool.net/#current/wind/isobaric/70hPa/overlay=temp/orthographic=-94.17,89.76,455/loc=-16.131,84.586
Hasn’t the mixed polarity been the issue this cycle for the movement of positive flux northward? A cancelling out of the positive flux?
Such mixings are a feature of every solar cycle. See, e.g. Slides 22-24 of
http://www.leif.org/research/Asymmetric-Solar-Polar-Field-Reversals-talk.pdf
The polar vortex is predicted to split unusually early in only two weeks bringing very cold weather to Eastern NA. Expect a cold, snowy December.
Has nothing to do with the Sun, so is not very relevant.
Ozone is the largest absorber of galactic radiation.
http://sol.spacenvironment.net/nairas/Dose_Rates.html
The magnetic field and the solar wind have much in common with the distribution of ozone over the polar circle.
http://www.cpc.ncep.noaa.gov/products/stratosphere/strat_a_f/gif_files/gfs_o3mr_01_nh_f00.png
Ozone is diamagnetic and is repelled by the magnetic field.
ren, i really wish you would write a guest article here detailing your research . you post some great information, but it is fragmented throughout several comment streams.
Yet another chance to see if sunspot numbers relate to weather, despite apparently not greatly affecting total solar output.
Isvalgaard thinks this solar cycle will not be as deep as many think. So I am keeping track of that. I’m also keeping track to see if that might be true because some have suggested that the position of the larger planets affect the solar cycles and climate. From planetary positions, it doesn’t look like it will be that deep or long. So I’m watching that. I’m also watching the cosmic ray activity in relation to co2. I saw that there is a difference in lag/lead time on cosmic rays between odd and even solar cycles. This should be a very interesting solar cycle. And of course we will all be watching TSI.
Geomagnetic field has been rather active during last week or so (see here) charging upper atmosphere, concentrating atmospheric pressure excursions on the earth’s magnetic two N.H. maxima.
http://www.vukcevic.talktalk.net/GMFz.jpg
http://www.cpc.ncep.noaa.gov/products/stratosphere/strat_a_f/gif_files/gfs_z10_nh_f00.png
In the winter months this leads to polar vortex splitting up, bringing cold winters to the N. Hemisphere.
Above is very similar what happened in Jan 2013 and Jan 2009, both cold winters more here, but this one is too early in the year
The geomagnetic field on those time scales have nothing to do with the climate. Perhaps you forgot a /sarc ?
Looks like leif’s pride has been stung.
Even though the sun has been quiet spot wise in the past week we got hit by a solar wind stream from a hole and a filament as well. As these events disturb our magnetic field, I suspect you should see resulting geomagnetic field responses. If these can translate in to high and low pressure systems … I just don’t know. I think we put blinders on when we only deal with sunspot numbers for our solar activity indicator.
The sunspot number is a good proxy for just about everything solar. What other indicator would you suggest?
F10.7 is better. But you know that.
F10.7 and EUV and Cosmic Rays all follow the sunspot number:
http://www.leif.org/research/EUV-Magnetic-Field.pdf
So the sunspot number [going back 400+ years] is still the indicator with the farthest reach.
I seem to recall your F10.7 estimation based on a measured East component of Earth’s magnetic field.
F10.7 is not subject counting/area effects of spots. Also as the umbral field may decline, surface spots may disappear from the photosphere surface. But the magnetic cycles underneath still continue but without flux tubes breaking the surface to darken the optical band.
F10.7 tells us what is happening inside the magnetic inductive cookstove whether there are spots or not.
F10.7 is indeed as very good measure of solar activity. see e.g. http://www.leif.org/research/EUV-Magnetic-Field.pdf , but correlates very well with the sunspot number. Going back before 1740, the sunspot number is what we have [back to 1610], so the sunspot number is important. Understanding how the sun makes sunspots has made great progress lately, and we are getting better at teasing out a measure of solar activity from the sunspot count [once we get the count right].
This graph shows how well the solar microwave flux [of which F10.7] is a part and the sunspot number [the black curve] match each other:
http://www.leif,org/research/Solar-Microwave-Flux-Nobeyama.png
http://www.leif.org/research/Solar-Microwave-Flux-Nobeyama.png
Polar vortex at a height of 45 km.
http://www.cpc.ncep.noaa.gov/products/stratosphere/strat_a_f/gif_files/gfs_z01_nh_f00.png
Polar vortex at 10 hPa
https://earth.nullschool.net/#current/wind/isobaric/10hPa/orthographic=-6.25,91.48,431
Splitting of polar vortex is an important winter event for the N. Hemisphere.
http://eoimages.gsfc.nasa.gov/images/imagerecords/36000/36972/npole_gmao_200901-02.mov
Vuc, you are right about it being early. It is unprecedented, actually, and bodes ill for Canada (again). Waterloo dropped to -34.5 C last time.
The prediction is (link I found on this list) that the vortex will split about 15 Nov and the cold will spill south starting in the East. It is already below normal in Siberia and the snow is spreading West.
I figure the UK is shafted this winter. The engineers predicted that the grid will start collapsing this winter and it was said before knowing it would be unseasonably cold.
You sure get around!
OMG! Globull Worming/Climate Change/Climate Disruption/Catchphrase du Jour is causing the sun – and the earth – to cool!
We’re all gonna freeze (and die)!
/Do I really have to?
/yes
The front page of http://www.spaceweather.com/ shows that there was 1 spotless day in 2014, so the July 4th spotless day was not the first since 2011. — John M Reynolds
Is galactic radiation will grow?
http://pics.tinypic.pl/i/00835/90i8ff596l1m.gif
No, and Oulu [that you show] is abnormal. Here is a better graph:
http://www.nwu.ac.za/sites/www.nwu.ac.za/files/files/p-nm/SRU%20Neutron%20Monitors%20Monthly%20Graphs.pdf
lsvalgaard October 31, 2016 at 5:24 pm
_________________________________
Dr. S., your link is all African Neutron Monitors. Myself, am in the Northern Hemisphere, and I use Moscows Neutron Monitor. I always figure that the Moscow monitor will be as accurate as it can get. Just cause it is… Moscow. lol
Here is a NH monitor [Climax]
from https://www.ngdc.noaa.gov/stp/solar/cosmicrays.html
South Pole Neutron Monitor
Real-Time Data
http://neutronm.bartol.udel.edu/realtime/southpole.html
the climate has been quite unpredictable this days….
I think overall, the climate has been very predictable.
In fact, the maps created by Koppen over a hundred years ago are still quite representative of the various climate regimes on the Earth.
Weather, on the other hand, can be rather difficult to predict more than a few days in advance.
Sure
Climate or weather?
Climate is very predictable to 30-50 years..
Weather is unpredictable beyond 7 days.
This map shows the difference (in cm) between the current daily snow depth and the average value over the 1998/99 through 2011/12 time period. Areas where the current snow depth is within ±5 cm of the historical average are shaded gray. The thick red contour line indicates the historical location of the snowline (50% probability of snow depth ≥ 2 cm).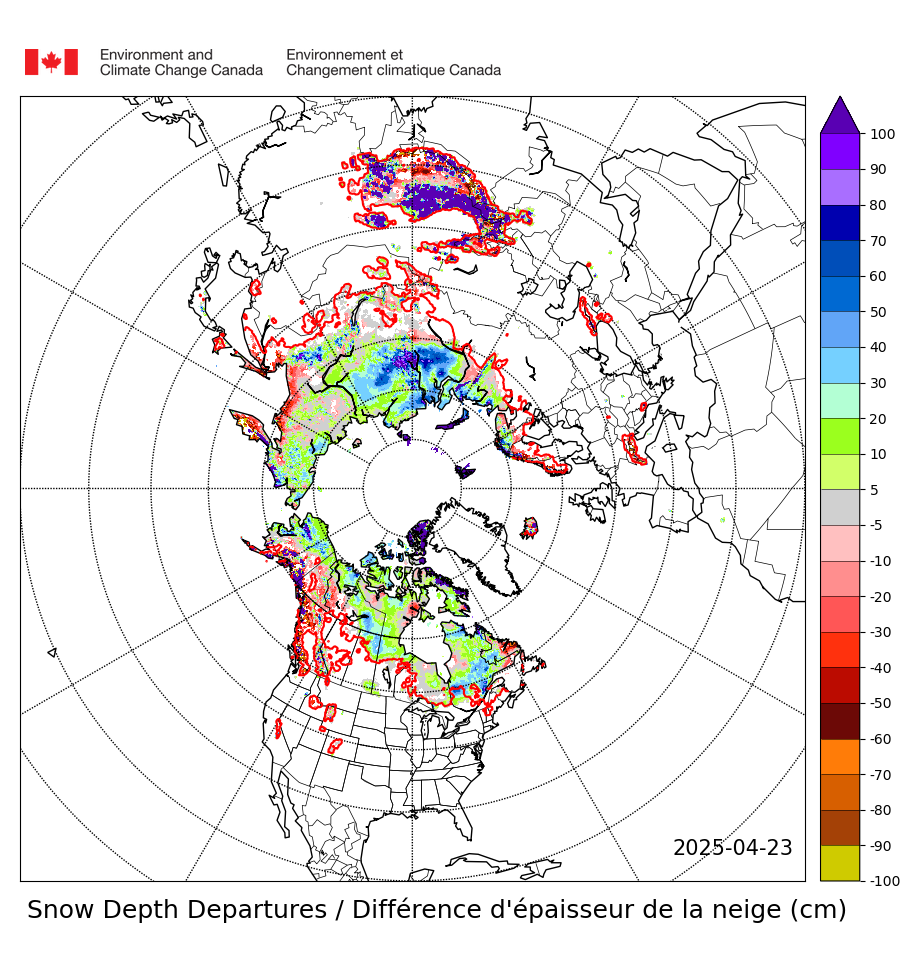
Reblogged this on Climatism and commented:
Ssshhh! Don’t mention the sun. It’s not a climate driver according to the UN IPCC who are tasked to link only your CO2 emissions with climate change and tax you accordingly, in order to stop bad weather.
I always enjoy these low/no sunspot picture posts. It reminds me that my monitor needs a good cleaning a little more often.
Good post. I tried to clean off that one little sunspot on this laptop..
Excellent discussion from Vencore weather on their Winter outlook.
Been watching for changes in the strong southern stream coming out of the Pacific which has been steering very mild, oceanic origin air masses bodily across the US from west to east thru October.
This despite a pretty stout -AO and -NAO. The northern stream and colder air associated with that has been mostly deflected by the above feature. There have been a few brief intrusions of chilly air in the Northeast quadrant of the US but are quickly blown out by the southern stream coming from the Pacific.
For sustained cold to finally arrive, we need the southern stream to either buckle strongly in the east Pacific, forcing an upper ridge to build downstream in western North America or for the pattern this week, with upper level ridging in the center of the country to retrograde and line up closer to the West Coast………especially if the upper ridge can extend into higher latitudes of western Canada.
There have been numerous “false alarms” from week 2 models over the last 5 days, suggesting this is starting. However, there has not been any follow thru as updated models with fresher guidance has often reverted back towards the recent pattern. “Some” of the latest guidance continues to suggest ridge building in western North American as we head towards the middle of November.
http://mp1.met.psu.edu/~fxg1/ENSHGT_12z/f384.gif
Those previous maps were the 500 mb forecast at 384 hours from the 12z GFS. Ensembles.
I would give more weight to things like neutron counts when it comes to solar magnetic activity and maybe proxies like 10Be and 14C going back over time than to observations of sunspots. While there certainly is some correlation between spot counts and solar magnetic activity, I am not convinced that they are as tightly coupled as would be measurements of GCRs reaching Earth orbit (assuming that GCR density is uniform over time though they appear to be over the duration of the Holocene). One reconstruction that fascinates me is this from Steinhilber et al. (2012)
http://solarphysics.livingreviews.org/Articles/lrsp-2013-1/fig_20.html
(as excepted from “A History of Solar Activity over Millennia”
Ilya G. Usoskin )
http://solarphysics.livingreviews.org/Articles/lrsp-2013-1/articlese3.html
Was this really posted by Antony or is it David Archibald?
/ sarc
I think we should look to the sun’s primary variability and the secondary climatic effects associated with that solar variability moderated by changes in the strength of the earth’s geo magnetic field, and lunar influences.
These factors bringing the terrestrial items that influence the climate either toward a warmer mode or cooler mode, and if these terrestrial factors are pushed far enough in one direction or another climatic thresholds could be reached which result in a complete reorganization of the climate.
THE TERRESTRIAL ITEMES
changes in atmospheric circulation patterns
changes in oceanic current patterns
changes in frequency of major volcanic activity
changes in sea surface temperatures
changes in global cloud coverage
changes in global snow coverage
changes in global sea ice coverage
Milankovitch Cycles yes, Continental Drift yes they do cause the climate to change but that is in the big very gradual climate change picture but these forces can not and do not explain all of the many abrupt climatic changes which have sometimes according to Ice Core evidence taken place in a decade or two. I mean swings of 4 or 5 or 6F, not necessarily for the entire globe but at least in the northern latitudes of the N.H. which is significant enough.
If the solar parameters reach the criteria I have called for which is more likely then not the global temperature trend will be down.
Already the just like in the period of 2008-2010 when solar activity was very low the AO is responding to negative values once again.
The historical climatic record supports all of my views until I am shown otherwise through data past or present my views remain unchanged and if anything even more certain.
By what measure or location are they expecting colder than average winter? So far, Denver has been enjoying summer part two, with a few records set for high temps. According to the Climate Prediction Center (nearly as accurate/useful as an unpopular politician (exercise left to the reader)), they are showing a much warmer than usual winter for most of the lower 48 states.
Yes I understand the lower 48 is roughly only 2% of the earths surface, it can’t be the only spot to use less energy in a warmer winter.
Northern solar polar field build up seems to be slowing some.
What desperation can make you say…
There is no evidence of that.
Somewhere around the year 1600 began the earth’s magnetic revelsal. Currently, the earth’s magnetic field is weaker by about 20% .This means that during the upcoming Grand solar minimum, more cosmic rays will enter our atmosphere.
Difficult to say, according to various estimates the last 3000 years earth magnetic dipole was loosing some of its strength, while in the previous 3000 years it was gaining. Field strength now may be about the same as it was around 2500 BC (CALS10K estimate – thick red line), the time the Egyptian Great Pyramid was built. It was at the time of one of two Holocene’s climate’s optimal periods.
http://www.vukcevic.talktalk.net/GMF-Ds.gif
Somewhere around the year 1600 began the earth’s magnetic reversal. Currently, the earth’s magnetic field is weaker by about 20% .This means that during the upcoming Grand solar minimum, more cosmic rays will enter our atmosphere.
That’s going to leave a mark or make for a very cloudy period (Svensmark).
It is not a given that another Grand Minimum is upcoming…
A spotless sun in 2017 will produce a cool NH summer like 2009 but with much less ocean heat content than that earlier case. See for multivariate comparison…
1) Global monthly heat content anomaly (GJ/m2) in the uppermost 700 m of the North Atlantic (60-0W, 30-65N)
2) Niño 3.4 region (5oN-5oS, 120o-170oW)
Therefore, look to the winter of 2017-18 for the real deal.