
As WUWT first reported yesterday, Arctic sea ice has reached the minimum and turned the corner. This press release from NSIDC today updates the date and minimum extent value.
BOULDER, Colo.—The Arctic’s ice cover appears to have reached its minimum extent on September 10, 2016, according to scientists at the National Snow and Ice Data Center (NSIDC). Arctic sea ice extent on that day stood at 4.14 million square kilometers (1.60 million square miles), statistically tied at second lowest in the satellite record with the 2007 minimum. The 2007 minimum occurred on September 18 of that year, when Arctic sea ice extent stood at 4.15 million square kilometers (1.60 million square miles).
“It was a stormy, cloudy, and fairly cool summer,” said NSIDC director Mark Serreze. “Historically, such weather conditions slow down the summer ice loss, but we still got down to essentially a tie for second lowest in the satellite record.”
“It really suggests that in the next few years, with more typical warmer conditions, we will see some very dramatic further losses,” said Ted Scambos, NSIDC lead scientist.
Arctic sea ice cover grows each autumn and winter, and shrinks each spring and summer. Each year, the Arctic sea ice reaches its minimum extent in September. The record lowest extent in the 37-year satellite record occurred on September 17, 2012 when sea ice extent fell to 3.39 million square kilometers (1.31 million square miles).
During the first ten days of September this year, the Arctic lost ice at a faster than average rate. On average, the Arctic lost 34,100 square kilometers (13,200 square miles) per day compared to the 1981 to 2010 long-term average of 21,000 square kilometers (8,100 square miles) per day. The early September rate of decline also greatly exceeded the rate observed for the same period during the record low year of 2012 (19,000 square kilometers, or 7,340 square miles, per day). By September, the air is cooling and there is little surface melt. This argues that that the fairly rapid early September ice loss was due to extra heat in the upper ocean. Recent ice loss was most pronounced in the Chukchi Sea, northwest of Alaska. NSIDC scientists said ice may also relate to the impact of two strong storms that passed through the region during August.
“This has been an exciting year with several record low extents reached during winter and early summer but thanks to a colder than average summer, more ice remained than at the end of 2012,” said Julienne Stroeve, NSIDC senior scientist. NSIDC scientists said there was a lot of thin ice at the beginning of the melt season, because thinner ice does not take as much energy to melt away, this may have also contributed to this year’s low minimum extent.

This animation above shows Arctic sea ice extent from 1979 through September 13, 2016. The black line is the 1981 to 2010 average, and the gray band around it shows ± 2 standard deviations for the same period. Yearly extents are color-coded by decade: 1979 to 1989 (green), 1990s (blue-purple), 2000s (blue), and 2010s (pink). This animation is adapted from NSIDC’s Charctic interactive sea ice graph.
Please note that the Arctic sea ice extent number for 2016 is preliminary—changing winds could still push the ice extent lower. NSIDC will issue a formal announcement at the beginning of October with full analysis of the possible causes behind this year’s ice conditions, particularly interesting aspects of the melt season, the set up going into the winter growth season ahead, and graphics comparing this year to the long-term record.
See the full analysis at NSIDC’s Arctic Sea Ice News and Analysis page.
See the NASA press release.
The National Snow and Ice Data Center (NSIDC) is part of the Cooperative Institute for Research in Environmental Sciences at the University of Colorado Boulder. NSIDC scientists provide Arctic Sea Ice News & Analysis content, with partial support from NASA.
This animation shows Arctic sea ice extent from 1979 through September 13, 2016. The black line is the 1981 to 2010 average, and the gray band around it shows ± 2 standard deviations for the same period. Yearly extents are color-coded by decade: 1979 to 1989 (green), 1990s (blue-purple), 2000s (blue), and 2010s (pink). This animation is adapted from NSIDC’s Charcticinteractive sea ice graph.- Earliest minimum since 1997 – shows how cold it is there
- This year extent was 22% above 2012, despite two massive storms
- Thickness is way up on 2010 and 2011
- Already extent is above 2007, as well as 2012, for this date
- We are looking at one of the fastest ice growths in September on record
https://notalotofpeopleknowthat.wordpress.com/2016/09/15/arctic-ice-growing-rapidly/
So, who’s to say what is normal, what the mean is and the distribution looks like? I say, there is nothing whatsoever unusual going on. One thing for certain, . . . ice melts . . . and water freezes. Not certain what the freezing point of salt water is in the arctic.
And mebbe it’s a type of Lindzen Iris (http://earthobservatory.nasa.gov/Features/Iris/)
but at any rate, it’s just like this:
While causes, rate of melt and outcome can be debated, I fail to see why anyone can argue against the trend of decreasing ice cover in the Arctic. If they are not convinced by now, what on earth would it take?
You are seeing half of a sixty-seventy year cycle:
1979-1980: Top of the cycle, anomaly = +0.5
1980-2005: Anomaly slowly, then more rapidly decreases through 0.0 towards -1.00
2006-2016: Anomaly remains steady at -1.0 .
For the past ten years, the Arctic sea ice anomaly has not gotten “larger” … It has oscillated around the same -1.0 valiu.
It is only a flat-earth, straight-line trend that projects arctic sea ice into 0.0.
Oh, by the way, from this point on, the more arctic sea ice is lost, the greater the cooling effect on the Arctic ocean 7 months of the year. Less sea ice = a cooler planet.
And historically,
A SMALL sea ice area in Sept means a very large sea ice extent in March-April the next year.
A LARGE sea ice extent in April-May (and 2016 April-May sea ice extents were higher than any recent years) means a SMALL sea ice extents the next Sept at minimum.
http://arctic.atmos.uiuc.edu/cryosphere/IMAGES/seaice.anomaly.arctic.png
Yes. It IS opposite what the conventional arctic “death spiral theory” holds near and dear to their hearts and papers. It IS opposite what hundreds of thousands of on-line pages and printed papers say. But it IS what the record shows to happen.
All this commentary about the Arctic ignores 90% of all polar ice: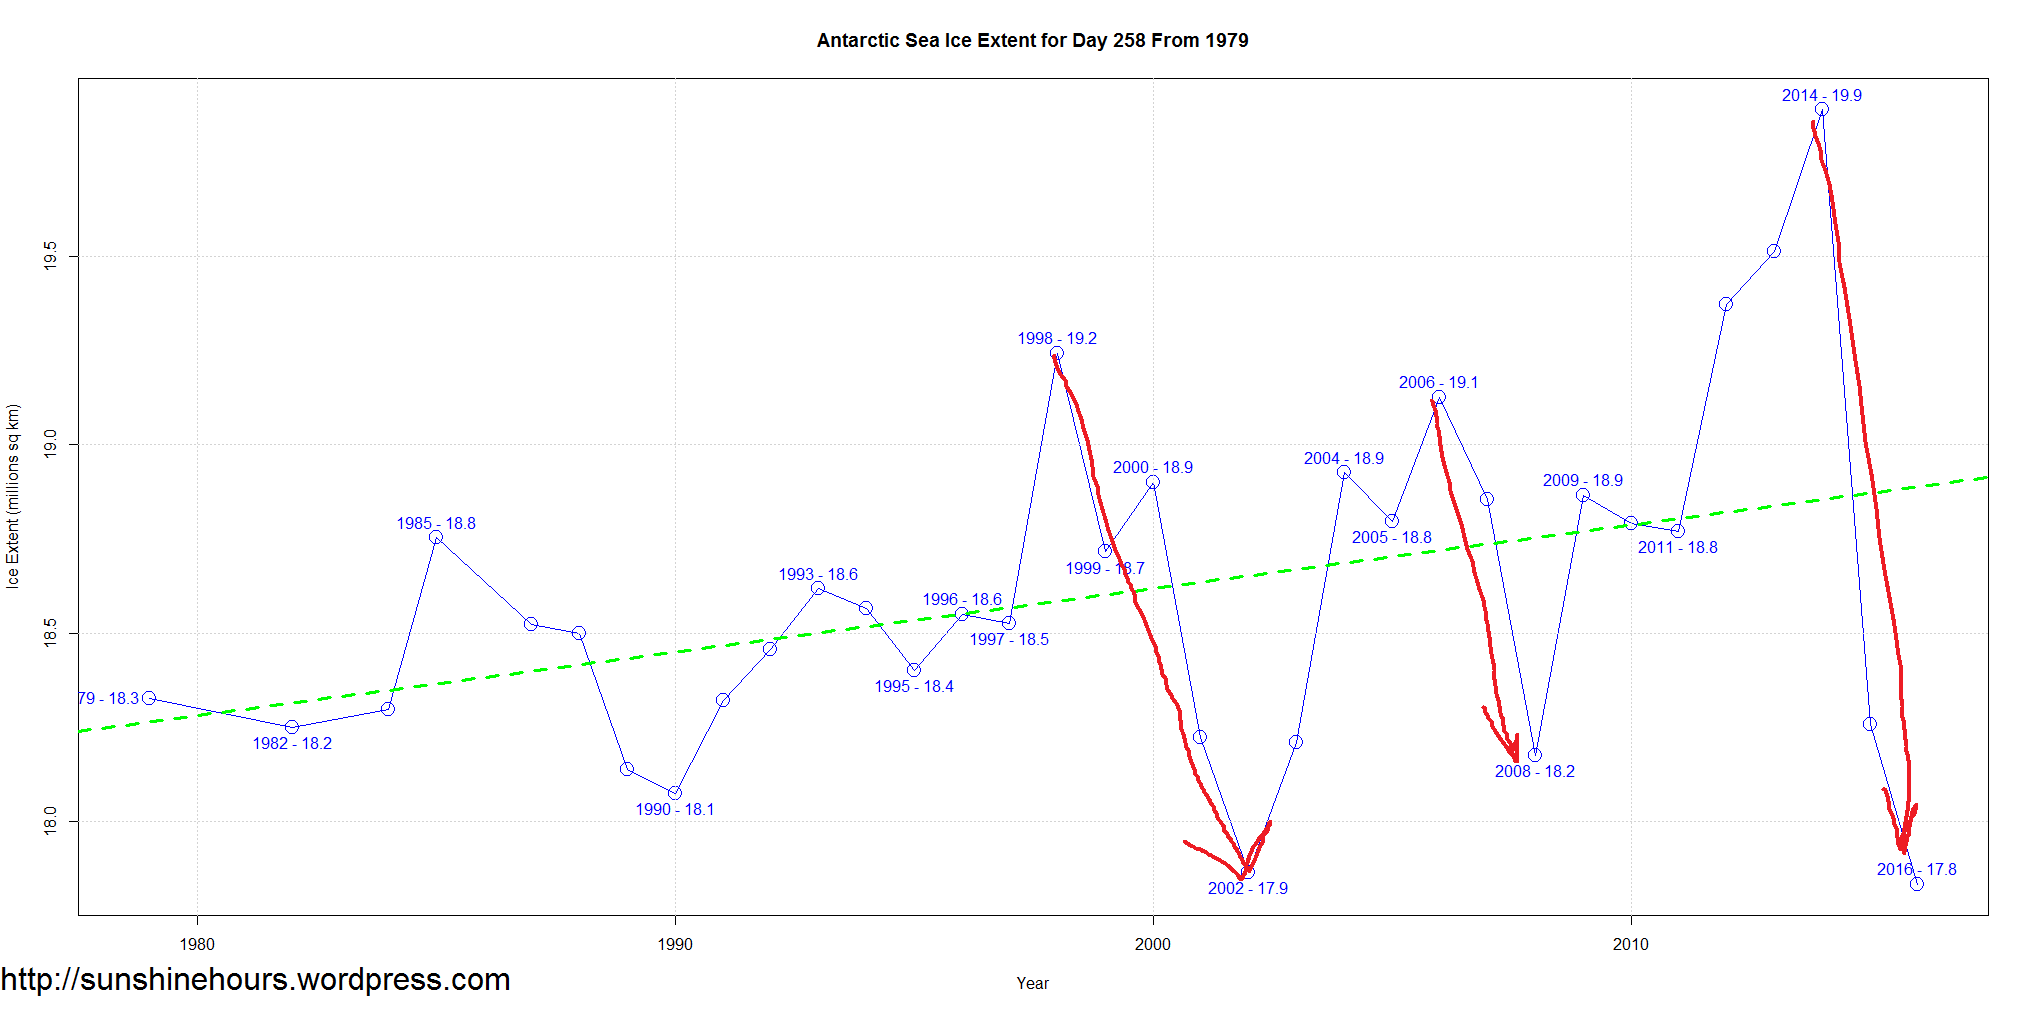
But if the Arctic is all they’ve got, then they have to use the Arctic. Either that, or admit their DAGW hypothesis has been falsified…
The topic is sea ice.
Umm-m… the topic is Arctic sea ice. They began to ignore the other end of the world when the Antarctic wouldn’t cooperate.
So why did you try to change it to include all polar ice?
You are confusing the issue.
The article above (and all of the CAGW community’s hype and propaganda) discusses Arctic sea ice.
Antarctic sea ice from 1992 through mid-2015 is “not obeying” the CAGW script by increasing steadily, increasing to record high levels in 2013 and 2014. 2015-2016 Antarctic sea ice levels continue to confound the record by staying right at the established long-term norm. Lower than the most recent five years, but right at the long-term average level through the record-setting El Nino of 2015-2016.
dbstealey is merely and quite properly pointing this out.
Total (global) sea ice is a meaningless and useless value. He didn’t talk about total global sea ice. Total antarctic ice IS an appropriate number, since the edge of the antarctic sea ice lies at the latitude of Antarctic land ice (a fixed value) + Antarctic shelf ice (a fixed value) + Antarctic sea ice (a variable quantity).
Unlike the arctic sea ice
RACook,
The disappearing polar ice scare was just one of many such false alarms which generated predictions that never came true (vanishing polar bears, runaway global warming, accelerating sea level rise, etc). The reason the alarmist contingent still clings to “Arctic” ice scare is because it’s the only part of their original prediction that was even minimally correct.
But half right is still wrong.
We’re observing natural climate variability, which remains well within Holocene parameters. Any other conclusion requires data-based evidence — verifiable, testable, accurate measurements — which the alarmist clique has never produced. If they had measurements that demonstrate X amount of global warming (or vanishing sea ice) would be caused by X rise in CO2, then making accurate predictions would be a piece o’ cake.
But every scary, alarming prediction they ever made has failed to come true. At some point, you gotta wonder what they’ve been smoking…