I almost called this yesterday, but I needed more data to be sure. All of the data I’ve looked at agrees, Arctic sea ice is now on the upswing, and in a big way.
Here is the plot from NSIDC:

This graph from Wipneus shows the abruptness of the change:

And the physics of ice is also a dead giveaway. Here, the Arctic temperature shows a dramatic upswing.

This is why: when water freezes it releases its specific latent heat.
The specific latent heat is the amount of energy required to convert 1 kg (or 1 lb) of a substance from solid to liquid (or vice-versa) without a change in the temperature of the surroundings — all absorbed energy goes into the phase change — is known as the specific latent heat of fusion.
Source: https://en.wikipedia.org/wiki/Latent_heat#Specific_latent_heat
For water, that’s about 334 KiloJoules of energy per kilogram.
Added: Note that in the record low year 2012, the date of the turning point was September 16th, this year was just a little bit earlier, but didn’t come close to a record, nor did it come close to predictions made for an ice free Arctic or less than 1 million square kilometers.
The value this year looks to be about 4.139 million square kilometers according to NSIDC data on September 11th of 2016.
Yep.
And as I pointed out yesterday, data collected by polar bear researchers since 2007 has shown that contrary to predictions, summer ice minimums between 3 and 5 mkm2 have not resulted in a >30% decline in polar bear numbers
https://wattsupwiththat.com/2016/09/13/expert-recent-studies-show-september-ice-extent-of-3-5-mkm2-did-not-kill-polar-bears-off-as-predicted/
@ur momisugly Susan, and then you read this, I am skeptical of the claims ice will be gone , In the article it shows and they mention bears eating kelp, the http://www.cbc.ca/news/canada/north/polar-bears-sea-ice-hunting-1.3760554, The bear looks fat and ice every where and I think the bears eat other foods such as kelp to add minerals to their diets.
Ditto!
Toby,
Polar bears eat lots of thing on land during the summer (grass, berries, kelp, garbage, bird eggs) but they are primarily living off their stored fat.
The fat comes from eating lots of baby seals in the spring. A few eggs may help them retain a pound or two but not much more than that (except for the exceptional few who specialize on raiding bird rookeries).
So far, declining ice has not impacted the spring feeding period and sea ice predictions suggest that will not change.
Hence, the focus of doom on summer ice changes.
Susan
“””””……
This is why: when water freezes it releases its specific latent heat. …..”””””
Nope !
……. When water releases its specific latent heat, it freezes. ……
The latent “heat” (noun) still in the water, is what is keeping it in the liquid phase. The molecules are moving too fast to become a solid.
So the Temperature (of water) does not go up when water freezes.
Something else might cause the Temperature of some thermometer somewhere to go up, but it has nothing to do with the ocean freezing.
G
george e. smith said…..Something else might cause the Temperature….. to go up, but it has nothing to do with the ocean freezing.//////Some latent energy could be releasing to the atmosphere, but generally, abrupt leaps of High Arctic temperatures in late summer, fall, winter & early spring are caused by excess AGW energy fronts from the south, thrusting into the High Arctic. That why High Arctic average temps during fall, winter & early spring have been leaping up since 1958 & before(?).
I don’t think the “Slayer” comment works. The ice is freezing at 0 deg C (or maybe slightly lower due to the unknown salinity of the ice) and releasing heat to a COLDER atmosphere by a degree or two.
[it was a joke, but I forget that these people are humorless, so I’ve removed it. – Anthony]
Is the data already smoothed or is there a chance, however slight, that there might be a late down-tick?
well below freezing temperature the “melt” is finished for this year……
You can move over to the Antarctic where the melt season is just starting. The wonders of a bi-polar planet.
That temperature is for parellel 80 and above. There is also some ice in lower latitudes that could possibly melt with warmer temps but I doubt it.
It’s been on the up for 6 days, and is now higher than the 1st Sep, so it now looks locked in
@ur momisugly D. J. Hawkins…NSIDC smooths by 5 days, if I am remembering right. Take a look at what DMI shows. There you can see the sharp upward movement. They have yet to post today’s update…http://ocean.dmi.dk/arctic/icecover.uk.php
Admittedly, I had noticed over the years the abrupt up and downs in the Arctic air temperature but had not thought about the cause. Storms, winds, open water, and “specific latent heat of fusion.”
You just answered the question.
Thanks very much.
John
John, I think you already had it essentially nailed with ‘wind.’
Just to put the fine point on it: Higher Arctic air temperatures are the effect of more open water giving up energy to the colder atmosphere, and not the cause of less ice coverage.
I called it on Monday in this thread: https://wattsupwiththat.com/2016/09/12/joe-romm-bombs-again-fails-to-check-history-on-arctic-icebreaker-claims/
I was eyeing it Monday as well, but experience has told me to wait, because compaction is a tricky thing, and sometimes reverses with the vagaries of wind and weather a couple of days later. I had to be sure before calling it because there’s a whole flock of irrational haters that follow WUWT looking for just such an opportunity to find some claim to beat me over the head with. It’s what gives them joy in life, since they have little else.
Anthony, I applaud and appreciate your efforts with WUWT, and providing this venue for all of us to express conflicting views. You deserve positive feedback. While I too, have made contrarian comments, I am truly trying to bend the arc of our intellectual pursuits towards the truth. And you have provided me the opportunity to do so.
Thomas
Plus a lot.
I try, in my (very) small way, too.
Auto – a very appreciative reader/submitter of comment.
Note – the oceans are huge, and deserve appropriate understanding . . . . . .
Anthony,
When the ice melt turns the corner, it is like the 4th of July all over again.
We look forward to your formal announcement each year.
And we like tweaking those arctic Kayakers anyway; it’s nearly as much fun as cow tipping.
G
“experience has told me to wait”
yes I remember in 2007 you were predicting a recovering of Arctic sea ice. According to you prediction, now it should be back to the 80s…
It was so stupid, isn’t it ?
Looks like one of our old Australian
friendstrolls under a fake name/email again.See Dave Burton’s reply.
toncul troll wrote, “yes I remember in 2007 you were predicting a recovering of Arctic sea ice. According to you prediction, now it should be back to the 80s… It was so stupid, isn’t it ?”
Actually, seven of the eight subsequent years have had higher Arctic sea ice September minima than 2007’s. So who do you think is stupid?
Yeah, well I called it on Sunday, as per:
” See – owe to Rich
September 11, 2016 at 1:02 am
Yep, 10 hours before ptolemy2 I wrote “JAXA data at https://ads.nipr.ac.jp/vishop/#/extent show two days of increases by 7000 sq.km. from the 7th to 9th of September. It is possible that minimum, at 4.017M sq.km, has been achieved on the 7th, slightly earlier than average (which I’ve seen quoted as being the 11th).”
And today, JAXA records a 45000 sq. km increase for the 10th, which will take some reversing. I’m calling it.”
which was at https://wattsupwiththat.com/2016/09/09/nsidc-two-very-strong-storms-failed-to-make-a-repeat-of-2012-record-low-arctic-sea-ice-extent/#comment-2297270
However, I can understand Anthony being a little more conservative, given what he says about the consequences in his case of being wrong.
Rich.
Yes you did, a couple of us were later pondering the same after seeing the Nansen graphs on the 10th.
So you did not call it, you hedged your bets. So if you want to play “I said it first”, you didn’t. Saying “I may call you” does not count.
Anthony has been silent until he felt he could make a clear statement.
Whoa Greg, I think you’ve mis-parsed my quotes, or deliberately igonred my:
“And today, JAXA records a 45000 sq. km increase for the 10th, which will take some reversing. I’m calling it.”
That was written on the 11th, at the comment I referenced with a URL to make it easy for you to find, and the bit you quoted was written on the 10th. So, I didn’t call it on the 10th, but I did on the 11th.
Not that it really matters a hill of beans…
Rich.
MASIE also shows ice extent persisting since Sept. 2 at ~4.2M km2, with a 1-day dip to 4.1M on Sept. 10 that looks to be the annual minimum.
https://rclutz.wordpress.com/2016/09/12/arctic-ice-minimum/
I don’t really care who calls it. It’s something that will be obvious in retrospect, and knowing that date a day or two sooner doesn’t seem to improve my quality of life.
Now, catching up with http://arcticnorthwestpassage.blogspot.com/ – that’s worth ignoring the graphs for a few days.
And I’ve been busy with the XKCD temperature trace…. http://xkcd.com/1732/ That’s more important too!
Well I think that Anthony may have been late in calling when the arctic sea ice reached its annual average level for 2016 also, but it’s pretty darn hard to call the average before half the data is in the bag.
g
On to another ice season.
nor did it come close to predictions made for an ice free Arctic or less than 1 million square kilometers.
This cries out for a link to a page with at least some of those predictions. There must be such a page somewhere and it deserves to be in the Climate Fail menu.
I guess you mean this (9/17/2012) sort of stuff:
Arctic waters will be completely ice free within four years, according to leading Arctic ice expert Professor Peter Wadhams of Cambridge University.
This “final collapse” of Arctic sea ice in summer months could occur by 2015, solidifying a “global disaster,” which has arrived faster than previous predictions suggested.
http://www.commondreams.org/news/2012/09/17/arctic-sea-ice-will-reach-final-collapse-within-four-years-expert
John F
Despite Peter Wadhams visiting the Arctic region 50 times, he appears not to understand the mechanisms that control the timing or volume of ice loss. Thus his predictions are not reliable.
In what universe does “completely ice free” equate to 1m sq km of ice? The one where the impression is more important than the facts?
– 2007 Nobel prize laureate Al Gore predicts North Polar ice cap falling off a cliff seven years from now by 2014 based on scientific studies.
Al Gore Nobel lecture.
– 2007 Prof. Wieslaw Maslowski from Dept. Oceanography of the US Navy predicts an ice-free Arctic Ocean in summer by 2013, and says that prediction is conservative.
Arctic summers ice-free ‘by 2013’
– 2007 NASA climate scientist Jay Zwally predicts that the Arctic Ocean could be nearly ice-free at the end of summer by 2012.
Arctic Sea Ice Gone in Summer Within Five Years?
– 2010 Mark Serreze, director of the NSIDC predicts summer ice free Arctic by 2030.
Arctic ice could be gone by 2030
– 2012 Prof. Wieslaw Maslowski from Dept. Oceanography of the US Navy predicts a nearly ice-free Arctic Ocean in summer by 2016 ± 3 years.
US Navy predicts summer ice free Arctic by 2016.
Scientific article: The Future of Arctic Sea Ice
– 2012 Prof. Peter Wadhams, head of the polar ocean physics group at the University of Cambridge, predicts a collapse of the Arctic ice sheet by 2015-2016.
Arctic expert predicts final collapse of sea ice within four years
Peter Wadhams impressive Arctic scientific CV
You can see the pattern that when the time arrives they just move the prediction a little farther, while not recognizing the failure.
Javier
This sounds like the predictions on the recovery of the ozone hole – sometime about 2050 to 2060. All (most) of the actors making the predictions will have passed on by then, so what does it matter. What they are really saying is I dont have a clue. In the mean time we get meaningless reports.
Ozonebust, I agree. The hole has (likely) been around for centuries as a natural phenomena.
Macha
The ozone hole responds to certain northern hemisphere conditions, and like those NH conditions it is cyclical. It holds many secrets. Mother nature is a master (mistress) of disguise, however she is not complicated, it is humans that complicate the signals.
“nor did it come close to predictions made for an ice free Arctic or less than 1 million square kilometers.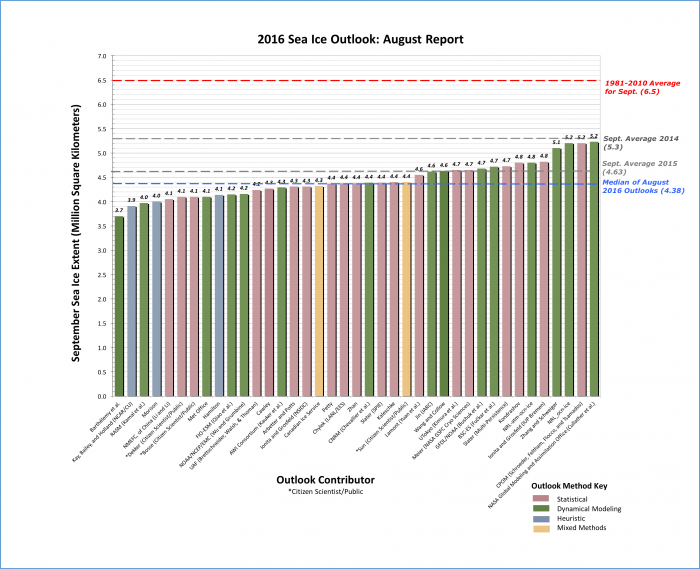
This cries out for a link to a page with at least some of those predictions. There must be such a page somewhere and it deserves to be in the Climate Fail menu.”
Ice free predictions?
Typical skeptic cherry pick.
Here are some predictions
OR look at the Official consensus prediction. Its entirely different than the random shit you will read in the Press. You wont find science in the Press. Period.
Dont get your summary of the science from the Press or from INDIVIDUAL scientists who talk to the press.
IF you are not an ice expert, and you want to minimize the stupid things you could say,
Then you best bet is just to read Ar5.
1. the Metric of interest is 5 CONSECUTIVE years of seasonal ice falling below 1m sqkm
2. There is a good chance of that before 2050.
Mosher
There appears to be no ice experts, and Ar5 does not provide any clarity. When someone can stipulate with a high degree of certainty what actually controls the polar sea ice volumes and reason for area movements, we will see the emergence of an “expert”. An annual signature of repeatable predictability.
Personally I make up my own mind after looking at ALL the available evidence.
From my observations there is a unique signal / link between the Antarctic and Arctic activity. I will write it down when time permits.
Yawn,
according to you,1 million square kilometers can be the same as ZERO.Here you post a chart with a large range listed,showing that they have a long way to go to be making credibly precise prediction. You call it a, he he he…. he,consensus prediction. Should I have to explain why this is a truly dumb statement?
Last of all, IF Wadhams,Beckwith,Box,Gore,Serrezze and others, would stop making ludicrous statements and predictions ,TO the media,the media would have little to work with.
Please take your silly stuff elsewhere.
no, there is not a good chance of it falling below 1m sqkm before 2050.
“There is a good chance of that before 2050.”
So how do you quantify “a good chance”? Is that consistent with “there’s a good chance it won’t”?
If you are going to be that fluffy you can say just about anything. And when extrapolating 35y hence, based on 35y of data, it’s probalby best to stay nice and fluffy.
zero = 10^6 ? Whooosh , was that the sound of passing goalposts again?
It seems most alarmists are now accepting that the arctic will not be ice free now, so have to redefine what that means in order to give a little chance of being right far enough into the future that everyone will have forgotten about all this climate crap by then anyway.
Al Gore may be an idiot but he’s the CAGWers’ idiot. Gore made the stupid prediction and he is a major spokesman for the CAGW cause, whether you like it or not. People like him are serially wrong, and they do great damage to the CAGW cause.
I’ve read enough of what you’ve written to know that you don’t subscribe to the catastrophism, and that you enjoy giving unprepared skeptics a hard time. I have no problem at all with that since it sharpens the issues. Also, no one should be able to get away with cherry-picking and unsupported comments.
Too many here and elsewhere regard Steve Mosher as the enemy. He should be engaged – not dismissed and dissed.
“IF you are not an ice expert, and you want to minimize the stupid things you could say,
Then you best bet is just to read Ar5.”
How condescending of you. An ad hominem. Whodathunkit?
“There is a good chance of that before 2050” means what, exactly, in scientific terms? After all, turnabout is fair play! I would love definitive language on “good chance”.
Based on what?
Extrapolation?
Models?
Even IPCC doesn’t see that before 2080, unless you are a big fan of the bonkers RCP 8.5
I think you are just making that up and pulling probabilities from your hat.
Mosh – perhaps you would be so kind as to provide the links to where you said the same to the Alarmists who embraced these individual scientists predictions? (what a lovely sound those crickets make). You’ve had tens of thousands of opportunities to do so… yet you only post that here. Perhaps being consistent in your response would minimize the stupid things you could say.
And just for comparison, the size of Texas is 700000 Km² (0.7 million)
Since the 2012 prediction failed, now they are changing the popular definition of “ice free arctic”
We are still cooling
from the top of the latitudes downward.
Really? All the data show that temperatures are increasing more rapidly in the arctic than the rest of the planet.
http://earthobservatory.nasa.gov/IOTD/view.php?id=81214
Bring on the increased reflectivity with those ocean cooling cycles, or should I say fossil solar effects that no one has figured out.
There’s also Al Gore, who said in 2009 that some climate models were predicting that there was a 75% chance that ALL the Arctic ice would be gone, not just momentarily, at the annual minimum, but for MONTHs (plural) at a time, during the summers, by 2014, 2015 or 2016. Here are his exact words:
“Some of the models suggest that there is a 75 percent chance that the entire north polar ice cap, during some of the summer months, could be completely ice-free within the next five to seven years.”
Hear him say it here:
In the words of Buffy the Vampire Slayer:
Don’t mean to quibble, but is what he said literally true?: i.e. that some models said there was a 75% chance of an ice-free arctic within 5-7 years? If so, then the models are at fault, right?
By 2009 Gore could not have known that the predictive failures of many climate models were so extreme that to continue to make those claims was an outright fabrication. There’s no rational excuse for his statements.
If you don’t mean to quintal, then don’t.
Just don’t.
I may be quibblin’ but I ain’t quintalin’.
Only idiots get their science from Gore, or think that proving Gore wrong is a meaningful excercise.
Dont get your science via hearsay and check your calendar
It really is amazing how quickly you get thrown under the bus once your usefulness is up.
Steven,
Thanks for your honesty concerning Gore’s science.
The movement would have more credibility if more scientists would have the integrity of Gore rather than being afraid to expose his wild claims.
So where were all those scientists that we should get our science from correcting Gore’s errors?
Gore got his Arctic ice prediction from Prof. Wieslaw Maslowski from Dept. Oceanography of the US Navy.
So we could say that only idiots get their Arctic sea ice predictions from expert cryologists. Projecting an AMO graph is probably much more accurate.
“Only idiots get their science from Gore”
http://www.nobelprize.org/nobel_prizes/peace/laureates/2007/
“The Nobel Peace Prize 2007 was awarded jointly to Intergovernmental Panel on Climate Change (IPCC) and Albert Arnold (Al) Gore Jr. “for their efforts to build up and disseminate greater knowledge about man-made climate change, and to lay the foundations for the measures that are needed to counteract such change”
“during some of the summer months”
Note the use of the plural form “months”. Not ONE day per year but MONTHS.
Why does his head sweat so much?
Global Warming! Or maybe a shred of appropriate conscience.
I was thinking it’s his second chakra playing up again. But it might just be his habit of turning off the aircon and opening the windows in summer when he speaks.
Another reason for the spike in temperatures may be a plume of Atlantic air heading north, as a sort of feeder-band for yet another arctic storm. Likely not a gale this time, but still the persistence of low pressure over the Pole seems new and interesting to me.
https://sunriseswansong.wordpress.com/2016/09/14/arctic-sea-ice-the-2016-minimum/
As the “Death Spiral” was suppose to be an accelerating ice-loss, can we declare the “Death Sporal dead yet?
You’re obviously a fungi. link
And a good spore (t).
Fungi is plural. Fungus is singular.
It was deliberate, Gabro. A pun. Fungi = fun guy
I don’t think the release of latent heat (heat of crystallization) can actually cause temperature to spike upward. Rather, as temperature falls, the rate of water freezing into ice increases, which increases the release of latent heat, which reduces the rate of temperature decline. Conversely, if temperature spikes upward, it reduces the rate at which water freezes into ice, reducing that heat source, and thus moderating the temperature spike.
I was thinking the exact same thing.
I was trying to get my head around that too. Remember that General Science experiment you probably did in school? Heat mothballs (Naphthalene) in a test tube to about 100 deg C. Remove heat, and plot temperature as it cools down. You will get rapid cooling to down to 80 deg where it will sit for the rest of the class period.
It doesn’t go back up. As I write this I’m realizing that this is a lot like the back radiation from CO2 that doesn’t warm anything, but does impede the rate of cooling.
Were you also thinking about where that heat goes, and how it may feed convective processes?
The experiment of refreezing of molten mothballs shows how latent heat of fusion causes a pause of a temperature drop when the heat source used for the melting is removed.
As for increased CO2 reducing cooling: The analogy is different here, because the heat source (the sun) is not removed. When a cooling mechanism has a decrease of its cooling ability while a source of heat flux (the sun) is unchanged, then the temperature of the object in question increases.
Sea ice acts as an insulator between the sea and the atmosphere. As heat moves from the sea to the air, sea ice warms the sea and cools the air. But the amount of latent heat released by all those million square kilometers of ice is not negligible.
Polar sea ice is like an insurance against excessive planetary cooling. It sets a limit to the amount of heat that the planet polar oceans can lose. It is therefore another negative feedback that works against cooling through more ice and against warming through less ice.
The temperature profiles record the transport in of heat from lower latitudes that along with the wind are responsible for ice reduction. It appears that the removal of latent heat is transported by air also. Working with refrigeration gives a good practical understanding of heat removal during freezing applications
Changing state is generally an isothermal process. It resists temperature change. A convective parcel rising to the lower condensation level and cooling in the process, then finds itself in a near isothermal layer up to the cloudtop, as the latent heat resists and counters the cooling. The energy is still released but resists the cooling process without it. If it did warm when water became ice then the water wouldn’t condense or freeze.
If you placed a large body of liquid water in your freezer, would the temperature rise suddenly as the water changed state? Or would the compressor run relentlessly for some time as the water changed state isothermally until all the water was ice?
Home experiment there.
It can raise the air temperature up to the freezing point of water. If it could go any higher, then the freezing process would have to stop and melting begin.
Joe Romm needs a huge volcanic eruption soon or in just 4 years more he will lose the bet that I accepted him back in 2009 or 2008 regarding ice disappearing by 2020. A huge volcanic eruption would save him (he said it would be gone *unless* this happened).
There have been and continue to be more than plenty smaller eruptions, which would add up to a big one. Romm will hedge the bet.
Pardon, I meant to say that Romm will renege, he’s already hedged his bet with the volcano disclaimer.
Japan’s Sakurajima volcano due for major eruption within 30 years, say scientists.
http://www.bbc.com/news/world-asia-37358316
This
seems to be the source of acute Danish meteorological worries. But the Danes are pretty bad in seeing the context.
85% of Greenland is covered with ice, that comes down to roughly 1.850.000 km². The area that has just decided to separate is <100 km² in size.
It makes little difference if from a 18.5 litre bucket of water 1 cm^3 is missing. I wouldn't even be able to notice it. But the Danes are kicking up a fuss about it, without realizing -as Anthony wrote here- that the arctic ice is growing again and, more important, this incriminated small portion of ice hasn't melted away. Chances are, as reported, that this won't happen.
Seems that such ice shelf can only get to a certain size before detaching. Is it detaching because it has pushed so far out (it glacier is actually “growing”) or for some other reason?
“Because of the warming…” according to Jason Box. The Danish Meteorological Institute stated that the average temperature had been 2.5° C higher than during the past 35 years. Hmmm…
Previously ‘fast’ ice is detaching all along the NE coast of Greenland this season.
It is warming that’s doing it…
So, this ice “peninsula” was static for “X” years, not growing, not shrinking, and this year it separates because of recent warming? I don’t know….
I am more inclined to believe it was Eldir & the spirit of Fimafing – if you look really close at the photo you can see their faces in the water on each side of the peninsula. Eldir is on the right, with the big nose and the pointy hat; Fim’s white nose is just above the water (Since his death there hasn’t been a lot of substance to him).
Prayer to Aegir (and mebbe eben moreso Ran), and a good night of drinking, might just keep the ice from separating.
Griff
September 15, 2016 at 1:01 am
Wrong again. At least you’re consistent.
The Greenland Ice Sheet is gaining mass, hence its glaciers run faster and calve more.
Gabro wrote, “The Greenland Ice Sheet is gaining mass…”
I doubt that. All the studies I’ve seen indicate that Greenland is losing net ice mass. Not rapidly, but not zero, either. It’s apparently gaining mass in the middle, but losing mass faster at the edges.
Based on the sea-level record, there’s been a slow, steady, ongoing loss of grounded ice in the world for at least eighty years, probably longer. Much of it is thought to be coming from Greenland.
http://www.sealevel.info/120-022_Wismar_2016-06b_50pct.jpg
http://www.sealevel.info/1612340_Honolulu_2016-09_50pct.png
(Note the obvious lack of correlation with CO2 levels.)
Antarctica might be gaining mass, but not much. Ice accumulation and loss are very, very close to being in balance there.
Based on GRACE, Shepherd 2012 concluded that Antarctica ice mass change since 1992 has averaged – 71 +/- 83 Gt/yr, which means they couldn’t tell whether it’s actually gaining or losing ice mass.
Based on ICESat, Zwally 2012 found that Antarctica is gaining ice mass: +27 to +59 Gt/yr (averaged over five years), or +70 to +170 Gt/yr (averaged over 19 years).
Based on CryoSat, McMillan (2014) found Antarctica is losing 79 to 241 Gt/yr of ice, though that’s based on only 3 years of data.
More recently, this 2015 NASA study reported that Antarctica is gaining 82 Gt of ice per year:
http://www.nasa.gov/feature/goddard/nasa-study-mass-gains-of-antarctic-ice-sheet-greater-than-losses
Calving more/faster because of more ice accumulation in the interior doesn’t necessarily mean more or less total ice mass today (instataneus measure). The two are obviously related, but there is a lag time associated with the interior accumulation and the calving at the shelf.
Griff, keying in on one variable and ignoring all others certainly does eliminate annoying distractions … the guy that first developed and used blinders on his horse realized this a long long time ago.
..and more ice makes more ice…..faster
There’s a lot of old ice up there this time………
But there is still a lot of anomalous warm water around the North Pole: https://earth.nullschool.net/#current/ocean/primary/waves/overlay=sea_surface_temp_anomaly/orthographic=-179.70,89.20,466/loc=-147.688,45.864
The seas around the Pole have the highest decadal UAH trend 60N-90N: 0.26 vs. 0.12 global. And vs. global ocean 0.10. Source: //www.nsstc.uah.edu/data/msu/v6.0beta/tlt/uahncdc_lt_6.0beta5.txt
The decadal trend for the Antarctic region 60S-90S is the reverse from the North: cooling down -0.05.
What is happening? It doesn’t look very ‘global’, but more ‘regional’.
UAH above = UAH Lower Troposphere
the arctic iris effect might be at work….
The +AMO is probably the largest single factor in the loss of Arctic ice which makes is regional. In addition, more melting of Arctic ice could lead to more upwelling of cold water around Antarctica through the MOC. This has been hypothesized as the reason for the bipolar nature of the ice.
While Earth.nullschool.net is a masterpiece, and to me, groundbreaking global simulation; many of the things simulated are not reality! Not yet, at least.
On the Earth.nullschool.net page, down at the bottom left, click on the ‘About’ page! This little notice is there:
A little further down the ‘about’ page and one finds this:
With a link that takes us to:
Prediction and modeling, not observations, nor satellite Passovers, or even oak sailors with thermometers and buckets. ?dl=0
?dl=0 ?dl=0
?dl=0
The prediction may even be accurate, sometimes. Then again, I assume that weather predictions, even SST, are just as vulnerable to inaccuracy as my local weather predictions, which makes accuracy rare.
Following the NCEP links to where their prediction originates, there are these graphs:
Neither of which use the same Earth.nullschool base period 1981-2011. Nor do the graphics exactly resemble each other. Pay attention to the Arctic near shore temperatures. No, I am not color-blind.
Searching for more information from the NCEP modeling group:
Approximately the temperature seen by buoys and some ships… In the Arctic. Modeled!
Nor have we reached a source for the models, yet.
Still not the source, but self explanatory as to the quality.
http://www.cpc.ncep.noaa.gov/products/predictions/90day/tools/briefing/sstaa.gif
http://www.cpc.ncep.noaa.gov/products/predictions/90day/tools/briefing/sstsa.gif
http://www.cpc.ncep.noaa.gov/products/predictions/90day/tools/briefing/ssttt.gif
The estimated monthly progression of SST temperature profiles from several weather forecasting models.
I expect that the Earth.nullschool data is sourced from one of the favored NOAA models (CFSv2?) and the daily SST buoy imitation temperatures start from the one observation point, (still unknown), and are extrapolated from there. I believe the initial prediction ‘analysis’ is run every sixteen days
thanks for that atheok,for a long time i have suspected stated sst is nothing of the sort due to local experience . personally i think the error bars in the charts you provide should be a lot wider.
bit chilly:
I agree with you on the error bars.
NOAA and most major temperature collecting centers, completely ignore basic engineering/physics practices for calculating error bars.
This is a topic that has been explored before on WUWT.
Any group that assumes increasing the magnitude of data collection points allows them to ignore individual collection point errors, is specious, at best.
Nor is it possible that worldwide distributed thermistors have any chance of meeting maximum accuracy levels based on theoretical or laboratory derivations of accuracy.
Nor are any of the individual data collection point maintenance discovered temperature errors caused by wildlife or debris.
http://www.nws.noaa.gov/om/coop/newsletters/09spring-coop.pdf
Has a description by one of the maintenance people for surface stations.
There are similar accounts by buoy maintenance staff about the having to scrape barnacles, seaweed, algae, mussels, etc from the sensors.
Here is their recent recover/deploy schedule.
http://www.ndbc.noaa.gov/ops.shtml
Bluntly stated; there are no analysis of potential errors or potential error introduction points from the atmosphere, location, thermistor, recording, transmission, storage, recovery, adjustments, etc., in existence for NOAA/MetO,/BOM/etc. data collection profiles and usage.
There is no such thing as adjusting a data point without identifying/quantifying an error range! That should then be tracked and represented by error ranges.
The UAH/RSS satellite sensor sweeps give a good indication of expected surface temperature, perhaps the best, and should not be discounted; but even they are fallible when attributing explicitly accurate temperature at a specific position.
Arctic summer ice disappearance by anout now is one of the few BIG warmunist statements that will eventually end the CAGW scare without folks needing to understand all the problems in the underlying climate science. Al Gore indelibly said it in his Nobel acceptance speech. All the evidence pre-satellite suggests about a 60-65 year full Arctic ice cycle. DMI August ice maps. Whaling records. Larsen completed the first ever single season NWP transit in 1944. Around a minimum. Sat coverage started 1979, around a maximum. Somewhere around 2010 would have been another ‘natural’ minimum. There has been mutiyear ice recovery since 2012.
Other fatal BIGs include accelerating SLR when it isn’t (Obama’s disappearing Miami), demise of polar bears which depend on spring ice to hunt seals, not late summer ice when they come ashore in a state of walking hibernation (WaPo was on this canard again today),and ECS of 3 when all the recent observational methods suggest ~1.65. And with growing penetration, renewable intermittency is beginning to show the folly of that mitigation solution.
The pollys seem to be having a good year.
Susan Crockford writes a novel (Eaten) about them.
Now they are entertaining Russian researchers:
http://www.bbc.com/news/world-europe-37359430
Thanks for that (short) list!
Those Russians are lucky the bears are fat from spring feeding and thus not *really* hungry (although always looking for food). If they were really hungry, they would be EATEN, just like the folks in my novel.
Breaking a window or busting down a cabin door would be an easy feat for a big male, if he *really* wanted in.
Just saying…
Susan Crockford, Novelist as well as zoologist
Yes, laughable statement from some russian “scientist” quoted in the Guardian today, saying the bears are agressvie due to global warming.
No, bears are aggressive because they are bears.
I certainly would not accept a job like that in a remote location frequented by large aggressive carnivores unless they gave me a gun and box of bullets and promised not to prosecute me if I needed to use it.
Now I have some field experience of Polar Bears, and n,o they are rarely or ever aggressive except occasionally to other Polar Bears (particularly females defending their cubs).
Dangerous, yes quite, but not aggressive like e. g. a Grizzly defending his territory. A Polar Bear may kill and eat you, but he will do it quite calmly and dispassionately, simply because he is hungry.
Seems to me that the polar bears are thinkers … they don’t need to get excited (call it emotion) to do their killing. Grizzlies seem like they need to get pissed off.
Susan (if you are still watching) … is this a completely goofy statement?
While more omnivorous, usually, than their polar bear kin, grizzlies can also kill quite dispassionately and matter of factly.
Males surely kill the cubs of other males apparently as instinctively as do lions.
And here’s a griz sow hounding an elk:
I caught myself rooting for the elk … jump over the big logs … jump over the big logs to create more space … oops.
A bigger elk could have made it. Whether the attempt was a tactic or simply desperation, I don’t know. But it might have worked.
This article introduces the recent research collecting all available ice extent data back to 1850… all of it, submarines, soviets, whalers, the lot.
https://www.carbonbrief.org/guest-post-piecing-together-arctic-sea-ice-history-1850
It summarises the research conclusions:
“the new dataset allows us to answer the three questions we posed at the beginning of this article.
First, there is no point in the past 150 years where sea ice extent is as small as it has been in recent years. Second, the rate of sea ice retreat in recent years is also unprecedented in the historical record. And, third, the natural fluctuations in sea ice over multiple decades are generally smaller than the year-to-year variability.”
and it has a handy couple of charts, showing extent is now much lower than last century.
If this is the low point of a cycle, it is lower than the last one and going lower…
Griff,
That construct is literally incredible, as to be expected from a NOAA product.
It shows way too much ice for the 1920s, ’30s and ’40s. Arctic travelers noticed and commented on the pronounced decline from the oughts and ‘teens to ’20s.
Also, note that the year chosen to represent this century was 2012, whose alleged record low owed to a big August cyclone, same as in 2007 and this year (in which there were two, but the thicker ice was better able to resist their effects). Sea ice has been gaining since 2012.
And if the claimed cause of Arctic sea ice decline is air temperature, why then has the Antarctic gained over the same period?
Can NOAA bureaucrats really be so multiyear dense, as it were, seriously to imagine that air temperature matters more than water temperature and winds?
I think that you are correct Anthony
http://www.intellicast.com/Global/Temperature/Current.aspx
Some weird stuff happening in the Antarctic…
http://nsidc.org/data/seaice_index/images/daily_images/S_stddev_timeseries.png
The extent is increasing, what about the thickness?
The last group that asked that and actually tried to go measure it got stuck and had to be rescued at great expense.
Simon
I think your charts is out of date. However when looking at the current Antarctic sea ice you will notice that is taking a second downward movement this month. It looks like a poor peak area season, but there are very good reasons, and it aint CO2 related.
He likely meant to show today’s graph which depicts a sharp drop over the last 4 days or so. …http://nsidc.org/data/seaice_index/
I think that surface winds which start at mid latitudes and then plunge down to the edge of the Antarctic continent explain much of the changes in the sea ice down there…https://earth.nullschool.net/#current/wind/surface/level/orthographic=13.14,-84.46,497
it’s not out of date, just requires clicking on. it’s a wordpress issue that appears to have been a problem for a while.
but only for the antarctic.
Arctic sea ice volume also took a tick upward, too,
Ice extent decreases as the pressure rises above the Arctic Circle. It is evident that the polar circle circulation in the stratosphere and troposphere are connected.
http://www.cpc.ncep.noaa.gov/products/stratosphere/strat-trop/gif_files/time_pres_HGT_ANOM_JAS_NH_2016.png
This can also be due to the reduction of the solar wind speed (increase GCR).
Currently a very strong ionizing radiation GCR at an altitude of 15 km above the polar circle.
http://oi63.tinypic.com/14lnjiv.jpg
Re: Simon September 14, 2016 at 12:17 pm
“Area of ocean with at lest 15% sea ice” ?? Now that’s what I call a rough glance. Ships still get trapped down there due to the unpredictable nature of sea ice flow dynamics. Statisticians would have a field day with this. Margin or error?
How much ice is here?
http://news.nationalgeographic.com/content/dam/news/2015/11/03/antarctica/01antarctica.adapt.590.1.jpg
The Antarctic continental ice (land ice) is 14.0 Mkm^2. (million sq kilometers).
It is surrounded by 1.5 Mkm^2 of shelf ice (an area NOT included in the daily “sea ice” reports!)
That total area is surrounded by an oscillating amount of Antarctic sea ice, that varies from a minimum of 3.0 to 4.0 Mkm^2 in late February each year, to a maximum of 16 to 20 Mkm^2 in mid-September.
Note that Antarctic sea ice has been setting record HIGH anomalies recently; in June 2014 just the “excess” sea ice around Antarctica was greater than the entire area of Greenland. This year’s Antarctic sea ice anomaly has been oscillating above and below 0.0 since Sept 2015 – the start of the record high El Nino. The last time Antarctic sea ice anomaly was at 0.0 was during the 2010-2011 El Nino. Does the Antarctic sea ice anomaly lead the El Nino conditions closer to the equator (since the cold Antarctic currents flow from the Antarctic past the Chilean and Peruvian coasts towards the warm “region” of hot water that characterizes an El Nino?) Or does the warmer equatorial waters remain warm all around their South Pacific cycle and subsequently cause greater melting of the sea ice when it arrives off the Antarctic coast?
Both are good questions. Both conditions are possible, but both, either, or neither may be absolutely correct in this world of feedbacks and months-long current cycles. I do not have a specific answer yet.
So the total Antarctic ice area = 14.0 + 1.5 + 3 mkm^2 (at minimum) = 18.5 Mkm^2.
14.0 + 1.5 + 20 Mkm^2 (at maximum) = 35.5 Mkm^2 .. Larger than all of the other land areas combined south of the equator.
Sea ice min. has been getting earlier since about 2004, looks like we just got the next dot. Alternating annual change and long term downward drift.
Remind me what year N. Atl SST peaked.
ftp://sidads.colorado.edu/DATASETS/NOAA/G02186/plots/1km/r00_Northern_Hemisphere_ts_1km.png
I’m not sure that this is not still bouncing around. I was expecting this to run for a few more days yet.
It’s logical that low ice minima should have earlier turning points, because the mean edge of the ice is nearer to the North Pole, so is expected to get colder earlier, so start to re-freeze earlier.
Rich.
S-otR wrote, “low ice minima should have earlier turning points, because the mean edge of the ice is nearer to the North Pole, so is expected to get colder earlier…”
Huh? How does latitude affect the timing of the seasonal temperature changes?
Anyone know if we can get the ‘unsmoothed’ version? I prefer to chose my own filters if needed.