Guest essay by Christopher Monckton of Brenchley
Roger Taguchi, who often circulates fascinating emails on climatological physics, has sent me a beautifully simple and elegant demonstration that IPCC has at least doubled true climate sensitivity, turning a non-problem into a wolf-criers’ crisis. To assist in grasping the beauty of his brief but devastating argument, Fig. 1 shows the official climate-sensitivity equation:

Fig. 1 The official climate-sensitivity equation. Equilibrium or post-feedback sensitivity ΔTeq is the product of pre-feedback sensitivity ΔT0 and the post-feedback gain factor G.
Global temperature rose by 0.83 K from 1850-2016 (HadCRUT4: Fig. 2), while CO2 concentration rose from 280 to 400 ppmv. Officially-predicted pre-feedback sensitivity ΔT0 to this increase in CO2 concentration is thus 0.312 [5.35 ln (400/280)] = 0.60 K.
Even if CO2 were the sole cause of all the warming, the post-feedback gain factor G would be 0.83/0.60 = 1.38. Then, at doubled CO2 concentration and after all feedbacks had acted, equilibrium sensitivity ΔTeq would be only 0.312 x 5.35 ln (2) x 1.38 = 1.6 K.
Yet the AR4, CMIP3 and CMIP5 central equilibrium-sensitivity predictions are of order 3.2 K.
Not all feedbacks have acted yet. On the other side of the ledger, much of the global warming since 1850 is attributable either to natural causes or to other anthropogenic forcings than CO2. Netting off these two considerations, it is virtually certain that IPCC and the general-circulation models are overestimating Man’s influence on climate by well over double.

Fig. 2 The curve and least-squares trend of global mean surface temperature since 1850 (HadCRUT4).
“Officially-predicted pre-feedback sensitivity ΔT0 to this increase in CO2 concentration is thus 0.312 [5.35 ln (400/280)] = 0.60 K.”
Elementary error. The “official” equation is clearly stated “Equilibrium climate sensitivity”. We haven’t reached equilibrium. There are various concepts like transient climate sensitivity that express this situation. They have different (lower) numbers.
If this is the ‘offical’ equation where is the reference for this forumla?
My guess is that this is not IPCC but CoB’s handiwork.
You need to learn more about sensitivity. It is the base from doubling CO2 by itself (1.1-1.3C, here 1.16) and some feedback multiplier. And if you don’t recognize lambda sub 0 then you for sure have not read the sensitivity literature. Is and always has been ~0.3, as here.
Greg has, as usual, allowed prejudice to cloud his judgment. The references are plainly shown on the diagram for each element in the official climate-sensitivity equation. Try following up the references before pronouncing an opinion in future.
“And if you don’t recognize lambda sub 0 then you for sure have not read the sensitivity literature.”
What I do recognise is the LHS – T_eq. Equilibrium temperature is what you have to input to get equilibrium sensitivity. And we don’t have it. Certainly not here.
Actually, it is just a conclusion that follows from the definition of feedback. That can be seen more easily if we use less-arcane symbols. ,
,  ,
,  , and
, and  , you get the equation above.
Suppose that you have a simple open-loop linear system defined by the following equilibrium relationship between stimulus x and response y: y = gx, where g is the open-loop-gain coefficient. Feedback means that some proportion f of the response y is added to the stimulus x, so x in the open-loop equation is replaced with x + fg in the closed-loop, so the closed-loop equation becomes y = g(x + fy). Isolating the response y gives you y = gx/(1-fg).
If you then replace x, y, f, and g with
The problem with Lord Monckton’s logic is that without a lot of interpretation the equation applies only to the equilibrium case unless the system is memoryless, and he applied it to a non-equilibrium case.
Joe,
But is not ECS assumed to be > TCR? And isn’t TCR (being less than ECS) is the carbon-pricing policy relevant value for the COP venues?
Thus, the policy-relevant value of climate sensitivity is even lower than what Lord Monckton has shown?
Mr Born is Insufficiently educated in the response time curve. Equilibrium response to the initial forcing occurs quite quickly. And I had explicitly mentioned in the head posting, which as usual Mr Born has not read, that not all feedbacks have acted. On the other side of the ledger, much of the warming since 1850 was natural, and some of it was from other anthropogenic forcings.
The caption reads “The official climate-sensitivity equation. ” You do not provide a reference to where you get this “official equation” so the we can check whether the various terms you are applying in it are the right ones for the context. Even when I raise the question you do not provide a reference for but divert attention by replying about something that I did not ask.
Like I said, this seems to be your own work. You then disingenuously say I’m ignoring the refs for the individual terms you have used when I was not asking for refs of individual terms but your claim that this EQUATION was “official” .
As usual Monckton of Brenchley thinks he can pull the wool over wool over everyone’s eyes and use misdirection rather than addressing issues raised or admitting an error. Just as he did when erroneously attributing Phil Jones’ graph to M.E. Mann.
This seems to stem from his conviction that he is infinitely superior to the plebs he is talking to and he imagines his condescending manner is not transparent to those he is addressing.
This is unfortunate because I think he is not far from the mark with his conclusion of IPCC estimates being highly exaggerated.
He would be more convincing if he replied honestly and scientifically to questions and did try to bluster through to cover up mistakes and incorrect claims.
So again, if that is the “official equation” let’s have a ref. to where you got it from. If it is you own formulation to synthesise a basic linear system with feedbacks then just say so honestly instead falsely claiming it is “the official equation”.
I believe the lord in favour of the larder .
You do not provide a reference to where you get this “official equation”
It is never ever written down anywhere.
Unlike – say – E=mc^2.
One conjectures that this is because its too embarrassingly simple and to open to question. It must therefore be obfuscated.
In general the official equations is (neglecting non CO2 derived effects) ΔT=λ x k.Δlog(CO2)
Where k is a physics derived constant that gives the (unamplified) temperature change per doubling if CO2 as about IIRC, one and a bit degrees C.
This is then multiplied by lambda, which has no physical correlation at all.
So WTF is lambda doing there?
Quite simply, lambda is a fudge factor put in to make the proposition “all late 20th century global warming is due to [man made] CO2 increase” fit the late 20th century data.
I.e it is the famous positive feedback that amplifies the direct effects of CO2 increase.
The famous positive feedback that, if it existed, would result in such an unstable climate, that the paleological record would be junk.
The famous positive feedback that would result in atmospheric hotspots, that have been shown not to exist.
The famous positive feedback, that cannot account for the ‘pause’.
The irony is that in order to ‘save’ the AGW theory in the face of the Pause., they have had to introduce other ‘factors’. Additional terms in the equation that provide effects capable of stopping the purported AGW dead in its tracks for 20 years. Unfortunately any additional terms able to have that large an effect, also would have the effect, if of reverse sign, of causing all the late 20th century warming in the first place!
In my youth as an apprentice, we have a saying: “Bullshit Baffles Brains” – which meant roughly that any explanation that was sufficiently technical and complex would in general cause someone who reckoned themselves to be smart but couldn’t actually follow the argument, to nod sagely and agree…for fear of being thought too stupid to follow it.
This didn’t work with the plebs on the shop floor. Who used it mercilessly against the management and were wise to it.
It works marvellously in AGW. The actual AGW proposition is, stripped of complex computer models and reduced to the basic physics, dead simple, and patently wrong in its assumptions. But by wrapping it in more flummery than a sub prime loan, its actual nature is, like a sub prime loan, obfuscated to the point where lesser academics can’t see the BS. And the rest of the AGW brigade don’t want to see it.
Mark Twain’s description of the ‘Royal Nonsesuch’ shows the psychology. No one likes to admit being ‘had’ or ‘practised upon’.
joelobrian:
Yes, it is. But the conclusion to be drawn is the opposite of what you stated. If you plug too low a value for (because you have not waited for the system to reach equilibrium) into the equation
  , the value you infer for
  will also be too low: you will infer too low a sensitivity.
 is too high, because it should have been only the response component that results from CO2-caused forcing exclusively.
I hasten to add that I’m pointing out the error only in that aspect of Lord Monckton’s logic, not necessarily in the conclusion. Actually, it is quite possible that the inferred sensitivity is too low rather than too high, because, as Lord Monckton (in this case, correctly) observed, “Not all feedbacks have acted yet. On the other side of the ledger, much of the global warming since 1850 is attributable either to natural causes or to other anthropogenic forcings than CO2.” Potentially, then, the value he plugged in for
But he has given us no adequate basis for making the the logical leap from that observation to the conclusion that “it is virtually certain that IPCC and the general-circulation models are overestimating Man’s influence on climate by well over double.” They very well may be overestimating sensitivity by that much. But Lord Monckton doesn’t help us reach that conclusion.
His illustration is pretty, though.
Thanks Leo, that is the case and is why I was questioning CoB’s claim that this was “the official equation”.
I recall a similar looking eqn in a Foster & Gregory paper IIRC but that was in the context of a specific study and not supposed to resume the whole of climate in oen neat line. Neither am I sure that would make it the “official” equation. Clearly this is CoB’s own formulation which he is mis-representing as being some kind of ‘official’ equation and which his mis-applying anyway.
No, this is another falsehood propagated by the propagandists at the IPCC to give the false idea that will be “tipping points” and climate will into a cataclysmic spiral.
The climate is dominated by the Planck feedback and will always be solidly negative. As you correctly point out the last 4.3 billion years is proof that climate is fundamentally stable.
When the IPCC and climate activist-scientists talk of “positive feedbacks” they are debating positive or negative relative to Planck , ie. do other feedbacks increase the magnitude of the negative Planck f/b or reduce it.
This means is the sigma term in CoB’s equation positive or negative.
This is why I do not like CoB’s treatment of the f/b model, an objection I made when he first presented it. His “open circuit gain” is the Planck response. The main problem is that it masks the fact that there is no suggestion, even from alarmists, that the climate could truly have a net positive feedback because it would go into run-away warming OR cooling at the first minor perturbations. However, the talk of whether feedbacks are positive or negative gives the impression that this is possible.
This allows the wolf-criers and bed-wetters to pretend that run away warming is a possibility if we don’t bow down and do exactly what they say.
There are at least 94 possible meanings of CoB (http://www.acronymfinder.com/COB.html). Which of those did you have in mind?
Based on CS to solar forcing, for the extra tropics it’s measurably less than 0.02F/Whr
https://micro6500blog.wordpress.com/2016/05/18/measuring-surface-climate-sensitivity/
Greg continues to combine confusion and malevolence. First, he has twice complained that the official sensitivity equation is not backed by references, when it is in fact backed by several references. He has failed t look up those references, and would not understand them if he did.
For instance, he talks of the Planck “feedback” being negative, but he would learn from Roe (2009), and indeed from thinking about the simple equation n the head posting, that the Planck parameter is not a feedback but a part of the referenc frame, and is better expressed in Kelvin per Watt per square meter, since it is not, and is not treated in the same way as, one of the individual feedbacks c(i).
He then falsely states that the alarmists do not suggest that temperature feedbacks are net-positive, when in fact they all do suggest that.
Finally, he falsely states that net-positive feedback would be runaway feedback, when, as Roe states, that is a common misconception.
Mr Stokes is, as usual, allowing prejudice to cloud his judgment. Pre-feedback sensitivity to the stated forcing is indeed 0.6 K. However, the measured warming is 0.83 K, suggesting a system gain factor 1.38, giving a climate sensitivity 1.6 K per CO2 doubling.
As the head posting points out, not all feedbacks have acted. But much of the warming was probably natural, and some of it arose from other anthropogenic forcings. IPCC does appear to have ever stared climate sensitivity by well over double.
And the warming from changing the radiative forcing is also not instantaneous. The loss of the northern summer sea ice will take a couple or few decades. Of the Greenland ice sheet, a couple or few centuries. Of the Antarctic ice sheet a couple or few millennia.
The lag between an increase in radaitve forcing and 60% of the consequent warming to have occurred is 25 to 50 years. The head post incorrectly assumes an insignificant value.
Up to the middle of last century, you’re probably right. Since then the response of the climate to natural forcing has probably been a slight cooling. Because of the lag between forcing and warming, that is the part that is relevant to this sort of very-rough calculation.
I am always trying to make sense of the data.
Only recently new H4 data became available and I have analyzed it already which includes a contribution from CO2. Essentially the procedure tries to fit a number of sinusoids with a contribution from CO2 that minimizes the sum of the squares
Here is my latest.
https://1drv.ms/i/s!AkPliAI0REKh_T3hNB24tGmnYgDI
Here is a close-up of more recent data.
https://1drv.ms/i/s!AkPliAI0REKh_T7Am0L78U9DAkNV
I used this for CO2.
https://1drv.ms/i/s!AkPliAI0REKh_UBRLVgEbvHxqpha
All that is below is in a function sheet.
The first part gives you the sinusoids.
kp=pk-3
kk=kp/3
e=1
for j=1 to kk
e=’H[j]
for i=1 to n
‘aaa[j][i]=b[e]*sin(2*pi()*b[e+1]*x[i]+b[e+2])
next i
next j
kk would be the number of sinusoids.
For the CO2 part of the function sheet I have this.
For i=1 to n
co21=co2(‘x[1])
co22=co2(‘x[i])
T20=b[pk]+b[pk-1]*ln(co22/co21)/ln(2)
‘aaa[kk+1][i]=T20
next i
x values give you the time values. b[pk] is nothing more than an initial value and b[pk-1] is the ECS value. All b values are guesses.
In the last portion I am only adding in a DC offset value which too is a guess.
for i = 1 to n
T = 0
for j = 1 to kk+1
T = T + ‘aaa[j][i]
next j
y[i]=T+b[pk-2]
next i
y are the anomaly values.
BTW, the ECS value for this came out to be 0.259.
I don’t think anyone would choose to argue with me that I don’t have a good fit for the data.
Of the Greenland ice sheet, a couple or few centuries
=====================
It has been warmer in the past than now, for periods much longer than a couple of centuries. 6-8 k years ago it was warmer than at present for more than 1000 years. the Arctic was largely ice free, but the Greenland ice sheet didn’t disappear.
And why only consider ice? The ocean depths contain enough cold water to cool the surface to near freezing for thousands of centuries. The difference between an interglacial and the depths of the ice age is a few percentage change in the overturning rate of the deep oceans.
Build a fleet of OTEC power stations, using the temperature difference between the surface and the ocean depths to drive massive Stirling engines. Tons of “green” energy. The effect would be to pump the cold out of the deep ocean up to the surface and plunge the earth back into an ice age. People would dream of the good old days of Global Warming, before it became Climate Change.
You’re quite right of course. I wrote carelessly wanting only to establish that ice-albedo feedback from warming has a long way to grow.
But yes, the GIS will last millennia.
Yes. Monkton mentions that “[n]ot all feedbacks have acted yet”, which is why I discuss ice. But even once the feedbacks are all on, there is considerable heat required to bring the earth’s temperature to its equilibrium. Both reasons why his calculations underestimate the ECS.
You might want to build a prototype to prove the concept. A problem with “massive” stirling engines is the decreased rate of heat transfer from the decreased surface area to volume ration with increased cylinder bore.
Monckton of Brenchley
A value (such as 1.6) cannot be assigned to “the climate sensitivity” by measurement for it is the ratio of two numbers, the numerator of which is the change in the equilibrium temperature but the equilibrium temperature is not a feature of the concrete Earth. It is only a feature of the abstract Earth. Long ago climatologists made the mistake of treating the abstract Earth as if it were the concrete Earth in making an argument. The argument was.anthrogenic global warming. The mistake created the physically bogus phenomenon called “radiative forcing.” AGW and radiative forcing were applications of the reification fallacy. Under this fallacy an abstract object was treated as if it were a concrete object. Reification violates the logical principle called “entropy maximization” (Edwin Jaynes, “Information Theory and Statistical Mechanic” circa 1958).
Hear
hear
But it is a concrete property at every surface station we are taking measurements at, and that CS can be used to examine surface temperate response to solar forcing.
https://micro6500blog.wordpress.com/2016/05/18/measuring-surface-climate-sensitivity/
Monckton of Brenchley
A premise to your argument is that “the climate sensitivity” is a logically meaningful concept. It is, however, the ratio of two numbers the numerator of which is the change in the equilibrium temperature. As Nick Stokes correctly points out this number is not observable. Thus “the climate sensitivity” is scientifically nonsensical.
Nonsense, daily the planet receives a variable amount of energy, you measure or calculate that and measure the surface response in temperatures.
https://micro6500blog.wordpress.com/2016/05/18/measuring-surface-climate-sensitivity/
This time Mr. Stokes has said something that enjoys that rare combination of truth and relevance. Indeed, it’s the heart of the matter. has remained essentially constant for a while before you know what the equilibrium response value
  is, and we’ve certainly had recent changes in
  : the CO2 concentration has been increasing steadily. So we’re not close to equilibrium–at least, as I said, if the system isn’t essentially memoryless at the time scale of interest.
Unless at the time resolution under discussion the system can be considered memoryless, you have to wait until the stimulus
Now, I have some sympathy for the argument some have made that the system lag is indeed very short. If that had been established, it would have supported the conclusion that “Even if CO2 were the sole cause of all the warming, the post-feedback gain factor G would be 0.83/0.60 = 1.38.” But a short lag is inconsistent with the darker-blue curve in Fig. 6 of Roe 2009. And, since that paper’s Eqn. 10 is the source of the head post’s illuminated equation, I’m afraid that without establishing the lag’s length the head post’s argument is not as compelling as it may at first appear.
I agree with you on the truth part, Not on the relevance. Since Delta F has never been “essentially constant” during the instrumental record of the Earth’s climate, and never will be for the foreseeable future, we will never be able to measure the equilibrium climate response, or lambda 0, or the sum of the feedbacks. What point is there in defining a metric of the response of a system that can never be measured? Or perhaps for the cynical ones of us, that’s the entire point of “equilibrium climate sensitivity” – you get to pick whatever you want it to be and you’ll never be proven wrong because the “equilibrium state” is always just a fantasy somewhere off in the future. .
Thanks Joe. That is the point I was trying to clarify in asking where this “official” equation is supposed to come from and which the CoB tries to evade by refusing to answer and replying about everything else EXCEPT the equation.
In using 150 y of data ending in a period where the CO2 forcing it at a max and supposedly still rising significantly what he is estimating is more like ‘transient’ sensitivity TCS. This is known to be considerably less that ECS.
Of course the whole idea of ‘averaging’ land and sea temps is bullshit physics in the first place but I see his idea is to play them at their own game and prove that they are wrong even by their own methods.
I thought the TCR and ECS were supposed to be grounded mainly in radiative physics (CO2 and atmos H20 making up the bulk of the effect) according to alarmist clisci. Other lesser effects like AEROSOLS were the tweak factors used to fit the instrumental record. If this isn’t so, then the factors in the equation are unnecessarily detailed. Im not encouraged much by the need to have guesses (rather than “estimates”) as a factor to put it all together.
Also, are physicists happy that CO2 radiative effects are logarithmic with increasing ppmv but apparently H2O’s are not? Surely, the content of H2O in the atmosphere is such that incremental feedbacks in response to CO2 increases must be small. Doesn’t a 0.6C increase over a century virtually fit a CO2 increase alone?
I won’t get into the negative feedbacks which have to in fact be the elephant in the room on a planet with a climate stability that has had a 1+billion year unbroken stretch of ambient conditions for macro life.
I’ve seen the ECS-to-TCR ratio variously estimated between 1.4:1 and 1.65:1. I’ve never seen it estimated as high as 2:1.
This head post makes no distinction between ECS and TCR.
If it is NONEQUILIBRIUM then why does anyone expect the climate system to behave in a linear fashion characterised by single sensitivity values? NONEQUILIBRIUM means NONLINEAR-chaotic.
No, non equilibrium does NOT mean non linear chaotic.
A linear system can be in a non equilibrium state.
But it can. Far from equilibrium condition frequently leads to Hopf bifurcation and development of chaos. In climate this is probably normal.
Greg
Do really believe the climate ever reaches “equilibrium”?
Nick
Why do you assume ECS is even higher, if all the long term feedbacks are negative the ECS would be even lower. You are just wishing, we have had an 19 year long pause which is likely to reaper in the next year when all the “experts” said that 15-17 years would be enough to disprove the theory. We have clear evidence that the warming is no where near what was predicted and no one ever said we had to wait to see the results when all the catastrophes were predicted to happen “in the next 10 years” by the “experts” now all of the sudden we have to wait for centuries to see where ECS is, centuries of funding, centuries of wealth distribution, centuries elitist BS.
As you stated, long term feedbacks HAVE to be negative. Our sun started out about 5 billion years ago with only about 70% of it’s current luminosity, and has been warming at a roughly constant rate.
In spite of that, there has been liquid water, and life, on earth for just about 4 billion years.
Clive Best addressed the negative feedback here
http://clivebest.com/blog/?p=3659
http://clivebest.com/blog/?p=3258
Alan
No I am not saying that they are all negative, nick is saying they are positive.
I surprised after seeing the comments: The basic question is do the two parameters that are involved in global warming, namely energy availability and CO2. The commentaters are taking it granted that the energy factor is infinity. It is not so, in nature it is limited and thus as CO2 increases the conversion of energy in to temperature rise flattens off. So, there is no way the temperature curve grow non-linearly. Also, the temperature curve consists of several other components. Scientists must concentrate on setting right the satellite and balloon data series to give the people right direction on global warming.
Dr. S. Jeevananda Reddy
Also faulty is the usage of the term “predict.” Under this usage the term is polysemic and changes meaning in the midst of the argument. Thus rather than being a syllogism this argument is an equivocation.
Two years ago for this blog (https://wattsupwiththat.com/2014/06/16/nature-abhors-a-positive-feedback/) I calculated a feedback of 0.70 K using the Modtran computer code.
Climate sensitivity of temperature to increased man-made CO2, that can be proved with actual data. is zero, plus or minus some really unknown amount. Most, on the different sides, support a larger number than zero, but none of them have actual data to support a number different from zero. Bill Grey supported a max of .2 to .4, I think he would have moved that closer to zero, if he had lived longer.
Wow. I strongly recommend you publish a paper with this actual proof. This overturning of current optics or thermodynamics will certainly put you in consideration for a Nobel prize.
He needs no proof of that. It’s obvious. Unless you think that we are going to spend the next millennium tightly controlling our emissions to stop spitting C02 in the atmosphere for 40 years, then pumping CO2 into the air for another 40 years, then stopping, and repeating the process for say 50 cycles to actually measure climate sensitivity. That’s what it would take to prove climate sensitivity with actual data.
Perhaps you need to remove the extraneous full-stop (period),after “data” and re-read.
Sigh. We don’t have fossil fuel resources to put CO2 into the atmosphere at current rates until the end of the century. An educated guess would be a peak of roughly 630 ppm in the late 21st century.
Seth
Can you show it?
Seth, the hypotheses derived from ‘The Science’ of CO2-Climate Change from “current optics or thermodynamics”, haven’t got a Real World Prediction right yet. None of the Predicted effects of CO2 or the “sensitivity” of Temp to it have occurred/is zero. The two Pauses from ~1945-1979 and ~1998-2016 speak directly to CO2’s lack of an alleged effect on Temp. CO2 is not even significantly correlated with Temp except in Ice Cores where it follows Temperature moves. Therefore these hypotheses are also Scientifically Falsified, by actual empirical data.
Send the Methodology and Practice of Real Science in the Real World a Nobel Prize. And just to give credit where it’s due, give the IPCC another one too, for disproving its own hypotheses, aka CO2-Climate Change.
On time scales relevant to climate, CO2 follows temperature. For example, the little ice age on the century scale, or ice ages over millenial time scales. That is observed fact.
CO2 level in the atmosphere lags surface temperature.
CO2 benefits biological photosynthesis, aka all life on Earth.
I like this simple exposition a lot. The no feedbacks doubled CO2 sensitivity is about 1.1C (AR3) to 1.2C (accepted by Lindzen in his 2012 talk to Parliament). Grey earth assumptions dependent. Energy budget observational TCR is on the order of 1.3, and effective observational sensitivity (eCS) is on the order of 1.5-1.8 depending on aerosol assumptions. Otto et. al. 2013, Lweis nd Curry 2014, Lewis (using Bjorn Smith aerosols) 2015.
Model sensitivities about double observational estimates is, IMO, correct within uncertainties. Hence the AR5 copout on a central estimate.
There is another different way to reach the same general observational conclusion using Lord Monckton’s irreducible simple equation, or the simpler reducible permutations thereof. Posted here and at Judith’s Climate Etc. then. Involves taking observational estimates for water vapor and cloud feedback through their Bode feedback model equivalents. Results in Bode f~1.25-1.3, and the same climate sensitivity result on order of 1.5-1.8.
“The no feedbacks doubled CO2 sensitivity is about 1.1C “
Equilibrium sensitivity. A lot of numbers are being fudged here.
Race horse, not this time. ECS depends on time frame. Hansen 2011 argued thousand years. Model is maybe 200-400. Effective is observational time frame, maybe 140. TCR is IPCC defined as 1% per year increase, so doubling in 70 years, model estimates therefore 70 plus/minus ten year temp average– the IPCC official definition.
This post is about ECS compared to eCS. No fudges allowed. No feedback 1.1 was AR3. 1.2 was Famous skeptic Lindzen. Read my essays then go to footnotes, or google Lindzen.
The whole CAGW issue is NOT CO2, it is the net feedback multiplier. This guest post coming out 1.6 is smack dab in the observational estimate range given aerosol uncertainty.
You have no factual refutation, because there is none. The models are wrong; they run hot because of the intrinsic parameterization/ attribution problem posted previously here and elsewhere. Three examples of model falsification: pause discrepancy, projection to sat/baloon discrepancy (related), lack of model predicted tropical troposphere hotspot.
Mr Stokes is, as usual, allowing prejudice to cloud his judgment. The time delay to equilibrium applies chiefly to the post-feedback side of the equation. Pre-feedback response is quite quick.
“The time delay to equilibrium applies chiefly to the post-feedback side of the equation. Pre-feedback response is quite quick.”
Not at all. The basic requirement of the equation is that you enter ΔTeq , the difference between equilibrium temperatures, as the left side. You are using 0.83°C, which is certainly not the difference between equilibrium temperatures. The time issue has nothing to do with “the post-feedback side of the equation”. It simply reflects the fact that it takes time to heat a large mass (oceans), regardless of feedback. ristvan says that the post is about the difference between ECS and eCS. I don’t know where he gets that from, but there is nothing about eCS here. Effective CS requires that you estimate the flux into the ocean.
Transient CS, which tries to emulate a likely real (not instant as in ECS) doubling scenario, spreads the doubling over 70 years, in 1% pa intervals. That gives an idea of the real time scale. After 70 years, they are not much more than halfway to equilibrium.
Ristvan,
“This post is about ECS compared to eCS.”
You don’t know what your are speaking about. Here the calculation is that for TCR and NOT ECS as claimed by the autor. Read the paper that you cite yourself (Otto et al)…
Toncul, you know not of which you speak. Equilibrium Climate Sensitivity (IPCC ECS) is always a bit more ( thnks for time frames expressly cited and defined above) more thae effective climate sensitivity, eCS. Your website is multiform discredited, a priori. Please provide a detailing parsing from credible sources to support your delusions. Include precise definitions.
” more thae effective climate sensitivity, eCS.”
There is no information about eCS in this post. eCS requires an estimate of heat flux into the ocean – there is nothing like that here.
Mr Stokes continues to be wrong. One of the many useful qualities of Roe (2009), a superb pedagogical paper on feedbacks in the climate, is that he presents a diagram showing the temperature response curve over time. The curve shows a rapid initial response, driven chiefly by the direct forcing. Roe also demonstrates that, where the feedbacks are less than IPCC assumes, a greater fraction of the response will occur early.
One can verify that models over-predict even short-term warming by recalling that IPCC had predicted 1 K warming relative to 1990 by 2025, yet only a third of a degree has occurred to date, with less than a decade of the 36-year period remaining.
” he presents a diagram showing the temperature response curve over time. The curve shows a rapid initial response, driven chiefly by the direct forcing.”
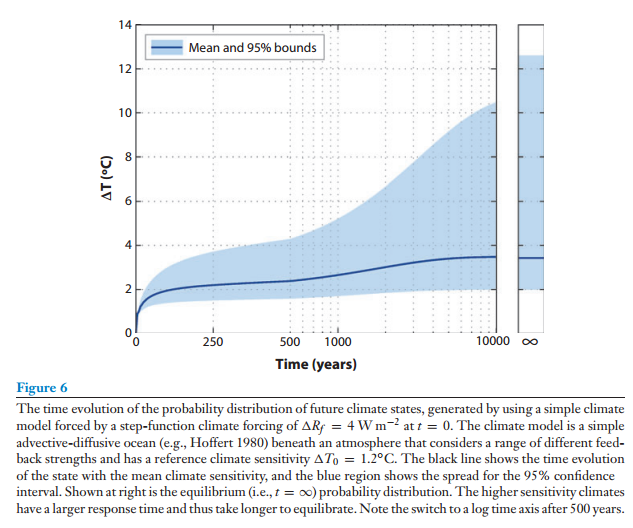
I presume this is the diagram (from here):
Yes, it shows a rapid initial rise. But even after a century, it’s still only 2/3 the way to the limit. And the Equilibrium CS is based on the limit. The point is that the “simple model” is just wrong. It uses the numbers wrongly. ECS is a well-defined concept, but you can’t get it directly from short term observations. People have been studying it for a long time – if it was this simple, someone would have noticed.
Monckton of Brenchley
“One of the many useful qualities of Roe (2009), a superb pedagogical paper on feedbacks in the climate”
A paper (with nothing new in it) that you didn’t understand at all : the equation you applied is for equilibrium temperature only and you apply it to the actual temperature change that is not an equilibrium one, to get ECS.
It’s crazy that not only you don’t understand your mistake, but also write a post on a topic you don’t get at all on a blog…
ristvan
what is done here is DeltaT x F2xCO2 / Factual.
This is the equation for TCR (to be exact, an very simple approximation of TCR) NOT ECS (equilibrium temp change for 2xCO2).
TCR : you gave the definition above. It is lower than ECS.
“effective climate sensitivity” can refer to a lot of things but mistakes are not related to that.
This is Eq 2 in Otto et al :
http://www.nature.com/ngeo/journal/v6/n6/full/ngeo1836.html
Climate sensitivity is not a constant. The repeated changing of its value is an indication they have missed other important climate variables in their models.
You may be right. But to a first order apporximation it probably is on timescales of a few centuries. So, is a useful skeptical arguement against warmunists, who assume it is.
This is correct, and the reason for the difference between Monkton’s and the scientific community’s calculation of climate sensitivity. ?w=620&q=55&auto=format&usm=12&fit=max&s=e88f068b34a63cc9ef83969051e228aa
[snip – pointless and stupid rant unrelated to the article -mod]
As has long been noted, climate models have been reproducing global mean surface temperature very well. Better than would be expected from the estimated confidence:
(for instance)
So it follows that the observed warming is compatible with the ECS of models. They might also be wrong, if they are compensatingly wrong about the time that it takes to get to equilibrium. However it is clear that you can’t just look at the CO2 increase and the temperature increase and correctly calculate that the ECS of models is out.
Seth is, as usual, allowing prejudice to cloud his judgment. We know that the observed warming is not compatible with the models because they made medium-term predictions that have not come to pass.
You mean you’re not going along with the burden of proof switcheroo the alarmists are trying to pull off, Mr. Monckton? Meaning their models are to be assumed realistic, and any lack of alarming warming yet, is to be chalked up to natural variation dampening it in the short term?
How positively scientific minded of you, rebel ; )
Ad hominem? I would have expected far more rationality from you, Monkton.
The main point is that you are underestimating the time constant very badly. That is the point you should most address. Can I humbly recommend a rational argument?
The global mean surface temperature has been bang on the nose from models three and four generations ago.
There are problems with them … The double inter-tropical convergence zone, is probably the most important, as it leads to a very large overestimation of the wind and rain in the southern hemisphere tropics.
But with respect to global mean surface temperature which is relevant to this post, I am not aware of these “medium-term predictions that have not come to pass”. Can you outline a few of the most significant and relevant?
Back in 2000, when HadCM3 was young, they ran one of their hindcasts forward:
http://www3.nd.edu/~mjm/carbon-energy-model/Images/carbon-energy_gr_2.gif
Even that showed pretty much the warming we have seen, and even had a 15 year period without any significant warming at a similar time to the one we recently observed. Current models are much better, and include a biosphere component, but we’ve been remarkably accurate at global mean surface temperature modelling.
Seth,
“Back in 2000, when HadCM3 was young, they ran one of their hindcasts forward: …
Even that showed pretty much the warming we have seen, and even had a 15 year period without any significant warming at a similar time to the one we recently observed.”
Why do you say “even that showed …”, Rather than *at least that showed*, or something of that sort? It appears to me you are saying that a single model, in a single run, showed something like what has since unfolded, using suspiciously sloppy lingo . .
I’m pretty sure most everyone here realizes it is not possible to PROVE beyond a doubt the modelers screwed up, and the question of whether those projection generators have demonstrated it’s time to start ravaging our economies and stifling many in the developing world, seems most relevant now . . The burden of proof is not on the “skeptic” side, and with such massive stakes involved, you’re (apparent) claim that one model run has not (yet) been shown way off base seems . . pathetically anemic, in terms of (you yourself even) not being justified in at least being somewhat skeptical about assumptions the modelers have made, frankly.
Monkton’s conclusion was that it is virtually certain that IPCC and the general-circulation models are overestimating Man’s influence on climate by well over double.
So he is of the opinion that he has proved something, to within a very high confidence.
Your point seems to be that it is not proven, and we are in agreement.
Your further point is that The burden of proof is not on the “skeptic” side, I would disagree with if you want someone to believe your arguments.
But with respect to the current discussion, I think we are in agreement. Looking at the temperature rise and CO2 concentration does not show that climate models overestimate climate sensitivity.
(You’re either insane or immoral, Seth, that’s what I’m pretty confident of ; )
(You’re either insane or immoral, Seth, that’s what I’m pretty confident of ; )
You seem uncomfortable about something.
We seem to be in agreement that Monkton has not proven that models overestimate the climate sensitivity.
What’s the matter, mate?
He can’t prove little green frogs won’t fly out your butt twenty years from today either, slick, but that don’t make it settled science that they will . .
Seth, on this you are theortetically and practically wrong. Read my stuff for simple illustrated examples even you can understand. As for your assertion thst models have been reproducing temps, see Christy’s model/balloon plus sat comparisons. They have factually not.
I humbly yield to your superior understanding. Do you have a link to this “Stuff”? I have no idea who you are.
I believe I said surface temperatures. Humble apologies if this was not sufficiently clear. Certainly parts of the atmosphere are not modelled well, especially the tropics, probably due to the double ITCZ problem, at least in part.
However, for calculations of a global climate sensitivity, the global mean surface temperature, which is modelled very accurately is the relevant statistic.
Google is your friend. Don’t pretend to be so lazy or ignorant. Those searches are trivial. Direct links multiple ways. A typical warmunist try but fail.
Google is your friend. Don’t pretend to be so lazy or ignorant. Those searches are trivial. Direct links multiple ways. A typical warmunist try but fail.
Alas, because of my previous search history, when I google, I get science-based output.
Hence the standard in many forums of the burden of supplying evidence for claims falling on the person who makes the claims.
It’s not pretending to be lazy, it’s that it really is your responsibility. Making it mine doesn’t work. It only finds the evidence I already believe.
Given that you want me to mother you and back up your claims, and you think that backing up your claims yourself makes me lazy, I think we’ll have to agree to disagree at this point.
I, for my part, will maintain the opinion that your claims cannot be backed up, and you, for your part, can believe that that is laziness if you wish.
Given your use of the term “warmunist” I think that you are arguing politics and not science anyway, so I doubt this thread of the conversation will yield much value for my time anyway.
Do have a good day.
seth, your problem is your assertions fail fact tests. Even your own above cited.
ristvan, given that you can’t describe or link to these fact tests, I have no choice by to continue to assume that you are mistaken.
Part of the reason I am satisfied to do this is that I do get the sense that you are taking a political rather than scientific stand on this, and people who do that are resistant to facts.
If Seth does not want ad-hom arguments, he should not have opened his contribution to this thread with a large one himself. Pot calls kettle black.
He appears unfamiliar with IPCC’s predictions. In 1990 its central medium-term prediction was that by 2030, less than a decade from now, there would be 1 K global warming. So far, there has been a third of a degree in 26.5 years, with less than a decade remaining. If the rate of warming since 1990 continues, warming to 2025 will have been less than half of IPCC’s then prediction, made on the basis that CO2 emissions would be less than they have been, and on the basis of “substantial confidence” that the models had captured all essential features of the climate, demonstrating Mr Taguchi’s point in spades.
Furthermore, IPCC’s interval of equilibrium sensitivity predictions in 1990 was exactly as it is now. Since its medium-term prediction has failed, we may expect its long-term prediction also to fail, and by the same margin. For otherwise IPCC would be duty bound to explain why it has all but halved its medium-term predictions since 1990, while leaving the equilibrium interval unchanged since 1990 at the values stated by Charney in 1969. I do not recall any discussion by IPCC of this suspicious alteration in the evolutionary profile of global warming, but am open to being directed to the appropriate passage.
I don’t see “accurate model results” in the work done to date. Please do remember I’m just an educated person who had a career running dynamic models. By my standards and experience those climate models are not delivering the quality needed to justify radical changes to energy technology. I worry more about the looming oil scarcity and high price environment, which will be followed by similar shortfalls of gas and coal resources over the next 50 years.
Have I overestimated your evidence-based standpoint, Monkton?
Well I’d hate for the primitive models and computing power of the 1980s to stand for climate models, but if I’m not mistaken, that was based on a stronger CH4 forcing stopped increasing as fast about 1990:
http://www.windows2universe.org/earth/Atmosphere/images/methane_atmosph_concentr_1984_2004_big.gif
So a lot of that overestimate is due to overestimate of the CH4 forcing and not a problem with the climate sensitivity of the model to CO2.
A few corrections are necessary:
1) This is the business as usual scenario, which as shown above, uses a too high a value for CH4 forcing.
2) There has been about 0.45°C warming since 1990.
3) The lower bound of the BAU estimate was nearer 2060 for the 1°C increase in temperature.
Only if you’re ignorant of both the changes in forcing pointed out above, and refuse to look at what more recent models have predicted. But we’re not so obtuse as to demand that are we, Chris?
Total cop-out argument. If you want to be free of google’s echo chamber effect , connect through a proxy server.
Since most of the “science” on this subject is political activism, not science any way, I’m not sure that your claim to have a ‘science based” history is anything more than an admission that you believe that 97% of climate scientists agree ….. something ill-defined.
It sounds a lot like: I’m a climate realist, therefore I am right.
the-art-and-science-of-climate-model-tuning
https://judithcurry.com/2016/08/01/the-art-and-science-of-climate-model-tuning/
Every climate model manages to accurately reproduce the 20th century global warming, in spite of the fact that that the climate sensitivity to CO2 among these models varies by a factor of two. How is this accomplished? Does model tuning have anything to do with this?
After reading this paper regarding the ‘uncertainty monster hiding’ that is going on regarding climate models, not to mention their structural uncertainties, how is it possible to defend highly confident conclusions regarding attribution of 20th century warming, large values of ECS, and alarming projections of 20th century warming?
Models are not the only way to constrain estimates of climate sensitivity.
Looking at the past climate sensitivity from climate reconstructions, looking at observational evidence from response to volcanic forcing, bypassing the climate model, and feeding the inputs and outputs into a neural net yield similar estimates.
Some examples:
Climate sensitivity constrained by temperature reconstructions over the past seven centuries
A new method for diagnosing radiative forcing and climate sensitivity
High Earth-system climate sensitivity determined from Pliocene carbon dioxide concentrations
An Observationally Based Estimate of the Climate Sensitivity
Climate sensitivity constrained by CO2 concentrations over the past 420 million years
Constraining Climate Sensitivity from the Seasonal Cycle in Surface Temperature
Probabilistic climate change projections using neural networks
Effect of climate sensitivity on the response to volcanic forcing
John, climate models can be tuned to reproduce global surface temperature anomaly. This is actually really easy to do. However, a model is expected to reproduce much more than a single parameter. My understanding is that most models can’t even reproduce temperature within 0.2 degrees C (I’m willing to be corrected on this point).
Seth,
read the paper:
http://journals.ametsoc.org/doi/abs/10.1175/BAMS-D-15-00135.1
even Gavin approves:
https://twitter.com/ClimateOfGavin/status/760112894939766785
Through sad experience, I learned that fitting models to past data is not very productive. Years ago, I pored over racing forms and devised a system that produced a 40% + return on investment based on past performance. It was FUTURE performance that counted. My actual results were better than picking at random, but no better than blindly flat betting favorites.
Alan, a simple model can be very accurate as long as the timing and value assumptions for model inputs are picked correctly. As the model complexity increases its probably better to acknowledge we simply have too many fishy numbers, and run the same basic model dozens or hundreds of times to get some sort of distribution. As far as I can see the climate models are way too rough to have a single run cone close to delivering an answer. But we could get an idea if they ran them say 500 times.
Perhaps Seth, you mean that the models are doing a fine job,
since it is the data that is incorrect?
If the data is adjusted properly it will match the models almost perfectly.
Thank you John, I was beginning to wonder if the precision by which the global mean surface temperature has been modelled these past two decades was genuinely in question in this forum.
I do think that the accuracy of the data is another conversation, but suffice it to say for now that the inaccuracies of the data a smaller than the margin of error in the modelling. The error 95% on GISTEMP temperature data is ± about 0.03°C, with other data similary, whereas the range of model outputs, given slightly different starting conditions rapidly start ranging over about ten times that error.
“As has long been noted, climate models have been reproducing global mean surface temperature very well …”.
================================
I think it’s more accurate to say that the surface temperatures have been trying very hard to reproduce the climate models.
Note to Seth , if I make 10 predictions of future events I’m sure I can fluke at least one and that’s all you have ( predictions) from people playing computer games .
“As has long been noted, climate models have been reproducing global mean surface temperature very well.”
No they haven’t. First, the charts you show are in temperature anomalies, which are a convenient way of hiding the absolute differences in temperatures. Second, even the correlation between historical temperature anomalies and modeled historical anomalies is only possible after tweaking the models’ parameters to make the curves generally look the same. About a week ago, I just read an old post by a climate modeler that admitted that the only published models are those that match the historical record, and in particular the observed upward tick in temperatures in the last few decades. If a model doesn’t match the historical temperature curve it just dies a lonely death, and the modelers start over with different parameters etc. until they get something they like. Whatever correspondence you see between models and past temperatures is a result of cherry picking the models.
What I do know is that the track record of models at forecasting future changes in raw temperature data – the only data that counts for verification purposes – is abysmal.
Yes they have. In fact “[c]limate models reproduce the observed surface
warming better than one would expect given the
uncertainties in radiative forcing, climate sensitivity and
ocean heat uptake”.
Why are climate models reproducing the observed global surface
warming so well?
Writing them as anomalies doesn’t change how much the differences are.
Certainly models are tuned. The point is that they can produce the current warming, and not have tuned away the climate sensitivity. Which shows that the observed warming and CO2 concentration do not imply that the climate sensitivity is less than model’s climate sensitivity.
“Cherry picking models”? Do you mean model set ups? Or model runs? Or are you actually claiming that HadCM3 is used because it works, and if it didn’t the Hadley Centre would just not have a climate model for use in papers?
I suspect that you’re mistaken about that. What’s the evidence and reasoning you used to “know” that?
Given the paper above questioning how climate models are better than they should be, how are you fitting this apparent contradiction into your world-view?
I thought it was only Nutticellifruiti, whatever, that religiously believed and argues the models are allegedly so accurate?
Not even the climate modelers, who have spoken or written, claim so.
“Cherry picking models? Do you mean model set ups? Or model runs? Or are you actually claiming that HadCM3 is used because it works, and if it didn’t the Hadley Centre would just not have a climate model for use in papers?”
I mean that the process of tuning models in a way that mimics the 20th century warming, at the expense of other climate features is cherry picking the trend you want to emphasize and carry forward into the future. That’s why all the IPCC models as of date X always miss temperatures after that date. Then they re-tune their models to account for the previously wrong forecast, say that the models are now better, miss again against future temperatures, and repeat the process.
When you say the models are accurate, and the paper you cite, you are referring to models tuned to reproduce the 20th century warming after the data is already known. I’m referring to the ability to accurately predict what happens in the future (and no adjusting the data as it comes in – make your prediction be for the raw data).
As far as anomalies vs. absolute temperatures, it seems to me that if your model can be tuned to reproduce the trend of the temperatures (and I’d love to know the sum of squared differences apart from the trend) while missing on the absolute temperatures, the model has something seriously wrong with it. Also, comparing anomalies only lets you pick the parts of the two curves you want to bring together, by arbitrarily picking your base period to measure the anomalies.Then you get to truncate the part that’s off and make it look like your model is better than it is.
Seth: “As has long been noted, climate models have been reproducing global mean surface temperature very well.”
A typical appeal to the false precision that is both rife all across consensus climatology and is pretty much a defining characteristic of the field.
Why Gavin Schmidt of NASA GISS tried so hard to discredit Christy’s simple chart from 2/2016. Why McIntyre then took Schmidt apart in two posts. A CAGW dragon slayer chart.
Models wrong three ways. SLR not accelerating except via ‘Nature tricks’. Oceans not acidifying due to ignored buffering. Coral bleaching just natural symbiont exchange. Polar bears thriving. Tough going for CAGW warmunist believers. Ma Nature not cooperating.
Indeed, 37 digits in the answer make it righter.
I couldn’t find the linked phrase in the linked document. Is the link correct?
It is likely that some of the past accuracy of climate models is due to tuning. However I note that HadGEM3 did also get predict current global mean surface temperatures very well.
Which I think is sufficient to discard Monkton’s claim of climate sensitivity being out by a factor of 2.
Seth continues to be wrong. We are told there is a “consensus”, and that IPCC reflects it. Yet IPCC, on the basis of “substantial confidence” in models, has made predictions that are at least double the outturn. The fact that a single model run not relied upon by the “consensus” disagrees with thar “consensus” but endorses the skeptical opinion and the observed data is hardly a validation of the models on which the “consensus” and IPCC rely.
Hi again Chris.
I see you’re ignoring my response in the other branch of this thread. You will find the response to your claim that the predictions are wrong are addressed there.
I’ll repeat it here again for convenience:
1) The late 1980s model used in the 1990 AR1 had a sensitivity that was fine. The greater mean warming than observed is attributable to a too high value for CH4 forcing post 1990. CH4 simply stopped increasing at the rate it had been:
http://www.windows2universe.org/earth/Atmosphere/images/methane_atmosph_concentr_1984_2004_big.gif
2) Having said that, I think that the HadCM3 generation of models stands on much more solid ground than previous models as it does not need flux adjustment. It is these models that have been bang on the nose with respect to reproducing the global mean surface temperature, and does so with a climate sensitivity in the range of 3 to 4 K for a doubling of CO2.
Seth, that entire post is about false precision and climate models. If you understood the meaning of the phrase and the post, you’d know exactly why HadGEM3 (or any other climate model) is unable to make any predictions at all.
Deriving a conclusion merely by comparing calculated and measured trends is hopelessly naïve.
What in blazes does posting a chart tracking methane in parts per billion, (ppb), accomplish?
Are you also arguing that an 8% increase in methane concentrations measured in ppb has such an overwhelming effect?
Such a powerful atmospheric response to methane, must make areas immediately around oil/gas wells and coal mine opening incredibly hot.
It shows that CH4 stopped increasing about 1990.
No that it stopped increasing at 10 ppb/year.
The heat spreads out. But CH4 will cause about 72 times the warming that the same amount of CO2 does over 20 years.
Hi Seth
I have to challenge you on this assertion on methane.
You must try and understand this report.
http://w.astro.berkeley.edu/~kalas/disksite/library/turnbull06a.pdf
What we are looking at is the earth’s radiation as it is reflected by the [dark] surface of the moon. This is radiation coming from the sun-to earth-to the moon-back to earth again.
Fig. 6 bottom shows the components which exhibit deflection. As you can see, CO2 shows deflection in the 1-2 um range and CH4 shows deflection in the 2.2.-2.4 um range.
It follows that these GH gases are cooling the atmosphere by bouncing off certain radiation off from earth to space.
the basic mistake by Arrhenius and Tyndall is that they only looked at the closed box experiments – in the 5-15 um range where earth emits – but nobody looked in the 0-5 um range where the sun emits, for possible cooling effects.
So what I am asking is: how do you know for certain that net effect of these two gases is that of warming, rather than cooling?
Good discussion of a basic point. But what if the net feedback is negative?
TH, the preponderance of evidence says sensitivity is a bit positive. Lindzen and Choi 2011 has significant problems. Observational eCS suggests slight positive. I think hewing to the most likely, most sound observational science is the best way to defeat wamunists. Alleging GHE does not exist, or that feedback is so negative there is net none, is not a political winning strategy. Remove the C from CAGW. Then remove ~half the A from AGW thanks to natural variation (arctic stuff, for example). Then the CAGW meme collapses without refutable claims.
As a time-invariant-linear approximation, Lord Monckton’s equation is essentially right for the equilibrium case, and the feedback term can indeed be negative. In answer to your question, that is, the equation is general enough to cover either positive or negative net feedback.
The problem with the post is that the response value from which Lord Monckton has inferred what he calls G is a decidedly non-equilibrium quantity.
Now, I’ve talked to guys who know this stuff, and they do use an equation of the same form to obtain non-equilibrium behavior. But the parameters they use are functions of a complex frequency, not scalar constants, and the stimulus and response terms are not the time-domain quantities themselves but rather their Laplace transforms.
In short, the equation above is fine if you know its limits of applicability and take care in interpreting it. Lord Monckton merely made a fundamental logical mistake in its application.
Mr Bore, as usual, allows prejudice to cloud his judgment. IPCC (2013), at Fig. 9.43a, shows the CMIP3/AR4 feedback sum as falling on the interval [1.53, 2.35] Watts per square meter per Kelvin. Plugging those values into the climate sensitivity equation gives equilibrium Charney sensitivity as [2.3, 4.3] K, and the CMIP3 predicted sensitivity interval is [2.2, 4.4] K, serving as a useful reminder that when considering an equilibrium rather than a transient response there is no need to visit phase-space by the use of Fourier transforms via Suns of sinusoids, which is the usual method. And, even then, the evolution of distinct feedbacks over time is so uncertain that one gains little by such methods. The simple equation shown is quite good enough to illustrate the simple point made in the head posting, a point confirmed by the wide discrepancy between prediction and reality in the temperature record, that IPCC has at least doubled climate sensitivity. The logical error, as usual, is Mr Bor’s.
The careful reader will note that the logorrhea preceding that sentence does nothing to establish its truth. This is a Monckton hallmark: he buries his answer in a lot of impressive-sounding irrelevance, apparently in the knowledge that most readers will assume it demonstrates his conclusion although they can’t quite follow the logic themselves. states the equilibrium relationship between a stimulus
  and the resultant response
  . You can therefore infer the (equilibrium) closed-loop gain
  from
from  and
and  if you know those quantities. From the closed-loop gain
  you can then infer the sensitivity
  , where
  is the forcing caused by a doubling of CO2 concentration. I.e.,
  .
. if the value you use for
  is too low. And, everything else being equal, the current
  value (which, inferred from the temperature trend, is what Lord Monckton used) will always be less than
  in a regime of monotonically increasing
  .
. is close enough to the current forcing value’s
  that the sensitivity inferred from it is pretty good. And perhaps a good argument can be made that
  is indeed close enough to
  . I wouldn’t find the conclusion implausible, particularly since natural variation has probably added to the CO2-concentration responsive component of
  , i.e., because everything else is not equal.
Here’s the point. Lord Monckton’s simple equation
The head post’s problem is that you’ll infer too low a value of sensitivity
The sum total of Lord Monckton’s argument is that the current
As others have observed, though, Lord Monckton has not made such an argument. He has made only a bald assertion.
CoB is a bald asserter who allows his prejudice to cloud his opinions.
He seems to have learnt much of his f/b theory from David Evans and now thinks he knows it all. Despite there being a broad range commenters here who studied science and engineering, not classics, and actually understand this kind of stuff, he will never have the humility to admit when he has made an error.
That strategy may well work in a political context where facts do not matter. Just don’t bring that attitude to a scientific discussion.
Right up there with the Scholes Black formula!
CN, BS works and won a Nobel prize. Good enough?
When Barak Obama won a Nobel PEACE prize, I understood that we had in fact disappeared down the rabbit hole!
Nobel peace prizes are a hole rabbit warren. The always have been.
Do not confuse the “peace” prise with a real Nobel prize for a real subject of research.
not all feedbacks have acted….
A 1 degree increase…has increased tornadoes, hurricanes, droughts, floods, snow/no snow, el ninos and la ninas, erosion, fires and earthquakes…
What feedback could possibly be missing…..
Indictments?
LOL….we have a winner!
Latitude,
“not all feedbacks have acted….
A 1 degree increase…has increased tornadoes, hurricanes, droughts, floods, snow/no snow, el ninos and la ninas, erosion, fires and earthquakes…
What feedback could possibly be missing…..”
Are you serious. Tell me you are joking or intend this as sarcasm.
Fred…earthquakes should give it away
[snip -wildly off-topic .mod]
[snip -wildly off-topic .mod]
No fun, but ok
That’s not the only double accounting. The 15 C, 288 K, 390 W/m^2 S-B BB calculation used for “upwelling” radiation in addition to the convection (17 W/m^2), evapo-trans (80 W/m^2), and LWIR (63 W/m^2) essentially double counts the surface power flux. Reference Trenberth figure 10 and numerous copy cat power flux balances. (These are NOT “heat” balances.)
BTW the S-B ideal BB radiation equation applies only to a surface in a vacuum. For an object to radiate 100% of its energy from its surface per S-B there can be no conduction or convection, i.e. no adjacent molecules aka a vacuum. The upwelling calculation of 15 C, 288 K, 390 W/m^2 only applies/works in vacuum.
You forgot a lot of things in your calculation (aerosols) and the fact that the system is not in equilibirum.
Hence your calculation is completely wrong. In fact you estimate a transient response because: what you are doing is forcing 2xCO2 divided by forcing actual (CO2 only) multiplied by actual temp change, that is not the equilibirum one. Equilibrium sensitivity would be larger and you need heat uptake to get it.
You are so bad.
Also you should be we aware that we cannot get an accurate estimate of climate sensitivity from present warming.
That’s say, you find a number in the Charney range with your stupid wrong calculation : welcome in the group of people who support that sensitivity is in this range and who believe that human activities cause a global warming.
The whole point is to ignore the specific physical phenomena and treat the whole system as a black box. It provides a crude first approximation. As many other posters have pointed out, using different words, it assumes the system is LTI (which it most assuredly is not).
Notwithstanding what I said above, the equation is about as good as we can get given our current understanding of the climate system.
In any event, your aerosols are off the point and are something of a red herring because we are talking about a black box.
commieBob
“the equation is about as good as we can get given our current understanding of the climate system. ”
The whole point is that neither you neither ‘Christopher Monckton of Brenchley’ knows what they are speaking about.
Yep the Eq used is not so bad, when used properly, for an approximation of … TCR (which denote a transient temp change) and NOT ECS, the equilibrium one.
See Eq, 2 in Otto et al 2013. this is the one use here. The one for TCR. The one for ECS is Eq 1.
http://www.nature.com/ngeo/journal/v6/n6/full/ngeo1836.html
I think you don’t know how bad you are.
By ignoring the time constant, it’s too crude. Too crude to assume “it is virtually certain that IPCC and the general-circulation models are overestimating Man’s influence on climate by well over double.”
All that has been shown is that the order of magnitude is correctish.
If we accept the equation as a rough first approximation, the difference between the two cases is handled by the value of i in the equation.
Can you, in your own words, tell us the meaning of the i in the equation? If you just come back with another ad hominem then everyone will know that you are just a garden variety troll.
commieBob,
if you speak about the equation that Christopher Monckton of Brenchley is showing and using not correctly, the i denote the various feedbacks (temperature lapse rate, water vapor, surface albedo and clouds for the Charney sensitivity). But you can write the whole block after the forcing as a single parameter (the details are not useful here, just do the calculation yourself). Difference between ECS and TCR formulations has nothing to do with the i in the equation.
The equation assume a balance between forcing and radiative restoring that is formulated as a linear function of surface temperature change. This balance is valid only for an equilibrium temperature change. However, Christopher Monckton of Brenchley applies the equation to the present warming that is not in equilibrium (ocean accumulates energy, which contributes to its rise). When the system is not in equilibrium, you need to take into account the rate of energy that is accumulated in the climate system (mainly ocean heat uptake) (see Eq 1 in Otto et al). Christopher Monckton of Brenchley didn’t do that.
What is he is calculating (with others errors (aerosols) / approximations) is a transient temperature change, not the equilibirum one.
He is wrong.
[this looks like “seth” under a new fake persona – held in que .mod]
commieBob;
if you speak about the equation that Christopher Monckton of Brenchley is not using correctly, the i in the equation denote the various feedbacks (temp lapse rate, water vapor, surface albedo, clouds). This is the equation for ECS not TCR. The i have nothing to do with a distinction between ECS and TCR.
You can write the whole block after the forcing as a single parameter. We don’t care about the details here (do the calculation yourself and you will see).
The equation comes from a balance between the forcing and radiative restoring that is written as a linear function of temperature change. When the system is not in equilibrium, this is the case for the present warming, this balance is not verified and you need to take into account the rate of energy accumulated in the climate system (mainly the ocean). It’s equation 1 in Otto et al. The one used here is equation 2.
Christopher Monckton of Brenchley does not take into account this term. He is not calculating ECS as he claims, but the TCR (with other errors, e.g. aerosols, and approximatons). TCR is lower than ECS.
He is wrong.
to the guy who wrote that :
[this looks like “seth” under a new fake persona – held in que .mod]
Instead of trying to guess who I am, just explain me where I am wrong.
Just try.
What you are saying is reasonable. The oceans will act as a heat sink and this probably means that ECS is larger than TCS. The problems are magnitude and time.
Some of the ocean processes are measured in thousands of years. There’s a good chance that, in the next thousand years, we will see that we are on our way to the next glaciation. We can talk of equilibrium climate sensitivity only if we can weed out the influence of all the variables that aren’t CO2. Milankovitch cycles and plate tectonics immediately come to mind.
CM’s equation is of the form of an IIR filter. As such, the various coefficients behind the sigma would be written in terms of magnitude and delay. Given enough coefficients and delays, the equation would thus be valid for any time frame, as long as the system is LTI, which it isn’t. It’s a crude first approximation.
I get the impression that most scientists agree on the approximate value for TCS. Ah, but what does ‘transient’ mean? There’s the rub. Are we talking about a month, a year, a decade, a century, a millenium? Given that the system is not LTI, can we really talk about equilibrium on any reasonable time scale? It’s a wicked problem.
My experience with control systems leads me to believe that climate sensitivity to CO2 is not dominated by any kind of positive feedback*. I thus agree with CM that his equation is a rough model of ECS. You, obviously, don’t agree. That’s fine. The science is changing and we should not cling too hard to our current understandings.
*Given the way we slam into and out of glaciations, it seems likely that some kind of positive feedback is at work under some circumstances.
You are wrong in your reasonning.
Earth is necesary in radiative equilibrium with its environment. You could argue that you need to cover a long period of time to get this equilibrium. It would be a non ending discussion. But if you perturb the radiation, then the system is necessary disequilibrated.
The amount of water in the ocean tells you that you will need centuries to millenia to reach the new equilibrium because ocean needs a lot of energy to warm. Accumulating this energy takes time. Christopher Monckton of Brenchley set the amount of energy accumulated in the ocean to 0 whereas it is not neglectable and there are estimations of that.
He assumes that equilibrium is instantaneously reached. When Christopher Monckton of Brenchley put on his heating in winter, its house warms instantaneously. When he put warm tea in a thermos, the tea cools instantaneously. Christopher Monckton of Brenchley leaves in a parallel universe.
There is no such thing as climate equilibrium beyond a constant roller coaster. Ongoing changes result in continual adjustment, i.e. changes, that continue the roller coaster.
Calculating an eventual ‘maximum’ for atmospheric changes is an assumption that ignores yesterday’s or tomorrow’s changes. Accumulating change overwhelm past or historical changes; especially as centuries of change accumulate.
Claiming a need to calculate ‘maximum’ equilibrium for a very short term temperature estimate is pure bafflegab, meant to obfuscate today’s temperature ranges.
Today’s temperatures are no different than temperatures experienced in the past, i.e. human recorded history; e.g. 1880s, 1930s.
That’s about the only thing we can rely on. 🙂 You would think that would produce some kind of weather/climate stability … but no … the planet’s weather/climate is constantly changing over time and space. You really can’t use the radiative equilibrium to deduce anything about the conditions on the surface of the planet.
A chicken and egg question. A little off topic.
Is past temperature data being continuously changed to fit the changing climate models or are the models being continuously changed to fit the continuously changing past temperature data? Which is tuning which?
Or do I credit synergy to greatly? Could it be the right and left hands have no idea what the other is doing? Is coordination an illusion?
No matter. The well known Soviet joke was — “The future is certain, it is only the past that is unpredictable.” Certainly something similar can be said of “climate science” — the science is settled, only the data is uncertain.
Eugene WR Gallun
Richard Lindzen made that point in his presentation to the UK Houses of Parliament. Here is what he said:
“We may not be able to predict the future, but in climate ‘science,’ we also can’t predict the past.”
Here is the full presentation:
http://junkscience.com/wp-content/uploads/2012/02/rsl-houseofcommons_2148505a.pdf
“Here is what he said:”
Yes. The context was a gross misrepresentation from Lindzen, in which he subtracted 2008 GISS land temp from 2012 GISS land/ocean and said “look how the past is changing!” Then he blamed the guy whose web page he had cribbed from without attribution for the bungle. “Apology” here.
Nick Stokes —
The science is settled, only the data is uncertain.
Now you are not disagreeing with that assessment of climate science are you????
Eugene WR Gallun
Nick Stokes neglects that portion of Lindzen’s statement that doesn’t suit Nick’s world view:
Prof. Lindzen also stated:
“This doesn’t alter the primary point of the discussion that a few tenths of a degree one way or another is not of primary importance to the science. The public interest in this quantity, however, does make it a matter subject to confirmation bias.
That comment is perennially pertinent.
Evaluating the integrity of official climate records, Tony Heller’s recent presentation:
http://realclimatescience.com/wp-content/uploads/2016/07/Evaluating-The-Integrity-Of-Official-Climate-Records-4.pdf
Also his somewhat droll delivery of it is on on YouTube:
If you increase the amount of CO2 in the atmosphere, how can the other gasses in the atmosphere remain constant?
Dalton’s law tells us that increasing CO2 will increase atmospheric pressure, making it harder for water to evaporate, reducing water vapor and thus reducing atmospheric pressure, which may well result in a negative water feedback.
Thermal inertia says this will happen faster than CO2 can warm the surface. If CO2 drives water out of the atmosphere before the atmosphere can warm, then the loss of water vapor may prevent warming in the first place.
1) CO2 from the combustion of fossil fuels reduces the atmospheric O2, by approximately the same number of molecules.
2) The anthropogenic increase in partial pressure of CO2 in the atmosphere is pretty small. A little over 100ppm(V), at 1000 HPa is about 10Pa, assuming ideal gas.
The climate’s been triggered? Better check your carbon privilege.
While I greatly respect Christopher Moncton and Richard Lindzen they are both guilty of a fundamental error.
Discussing the “Sensitivity Constant” means they believe this equation in an 1896 paper by Arrhenius:
ΔT = A* log(2) (P2/P1)
Where “Delta T” is the temperature change caused by a change in partial pressure of CO2 (P1 & P2). “A” is the sensitivity constant.
The Arrhenius hypothesis is false so it is futile to discuss the “Sensitivity Constant”.
I think it is you that doesn’t understand Monckton and Linzten. Arrhenius is discussing the effect of CO2. There is no dispute about the effect of CO2. None!
What is being discussed, and modeled by the equation Monckton presents here is essentially the effect of the dominant greenhouse gas, water vapor. Water vapor is so dominant that a 2% change in water vapor has approximately the same effect on global temperatures as doubling CO2.
What is seen observed is that water vapor is positive and negative effects (depending altitude, convection etc) with possibly a slight positive residual effect.
But the thrust of this article is that the climate models overestimate the net effect by a very large factor. Their parameters can be adjusted to match the past, but since the models are not properly weighting water vapor and related processes it means they predict far too much warming in the future.
If you want to condemn Billions of people in the Third World to energy poverty, starvation and disease (as a result of increased energy costs that affect everything from food, medicine and transport) then you sure as hell need to be certain of your science. Lord Monckton and Linzten are providing valuable exposes of the failures in the models – which the CAGW proponents want to keep hidden.
Moa you say: “There is no dispute about the effect of CO2. None!”
I full agree CO2 has no effect, none, on atmospheric temperature.
There is little dispute about the potential actions of CO2 in small laboratory conditions.
There are substantial disagreements about the effect of CO2 in the atmosphere, where H2O overwhelms or masks CO2 throughout the majority of light emission spectrum.
There is also disagreement regarding lapse rates exactly how CO2 absorption/emissions significantly warm atmospheric, water and land molecules
The top of this post includes this:
“Global temperature rose by 0.83 K from 1850-2016 (HadCRUT4: Fig. 2), while CO2 concentration rose from 280 to 400 ppmv. Officially-predicted pre-feedback sensitivity ΔT0 to this increase in CO2 concentration is thus 0.312 [5.35 ln (400/280)] = 0.60 K.
Even if CO2 were the sole cause of all the warming, the post-feedback gain factor G would be 0.83/0.60 = 1.38. Then, at doubled CO2 concentration and after all feedbacks had acted, equilibrium sensitivity ΔTeq would be only 0.312 x 5.35 ln (2) x 1.38 = 1.6 K.”
Thus it is the sensitivity to CO2 that is being discussed. Please read the post more carefully.
Al Gore in his movie “An Inconvenient Truth” used the stunning correlation between [CO2] and temperature to “Prove” that CO2 is the major driver of global temperature. If Al Gore was a scientist he might have noticed that the reverse hypothesis is more plausible (temperature drives CO2):
https://diggingintheclay.wordpress.com/2013/05/04/the-dog-that-did-not-bark/
J. R. Bates, 2015, in Earth and Space Science, doi:10.1002/2015EA000154, calculated an ECS climate sensitivity of about 1.0 °C, which is 2/3 of the low end of the IPCC’s 1.5-4.5 °C range, and is 1/3 of the IPCC’s central figure of 3.0 °C.
Another “data point” is a 2014 paper by MIT’s Ben Santer, and many coauthors:
http://dspace.mit.edu/handle/1721.1/89054
They sought to subtract out the effects of ENSO and the Pinatubo (1991) & El Chichón (1982) volcanic aerosols, from measured (satellite) temperature data, to find the underlying temperature trends. This graph is “Fig. 1c” from that paper; the black line is averaged CMIP5 models, the blue & red are measured temperatures:
http://sealevel.info/Santer_2014-02_fig2_graphC_1_100pct.png
Two things stand out:
1. The models run hot. The CMIP5 models (the black line) show a lot more warming than the satellites. The models show about 0.65°C warming over the 35-year period, and the satellites show only about half that. And,
2. The “pause” in global warming began around 1993. The measured warming is all in the first 14 years (1979-1993). Their graph (with corrections to compensate for both ENSO and volcanic forcings) shows no noticeable warming since then.
Note, too, that although the Santer graph still shows an average of almost 0.1°C/decade of warming, that’s partially because it starts in 1979. The late 1970s were the frigid end of an extended cooling period in the northern hemisphere. Here’s a graph of U.S. temperatures, from a 1999 Hansen/NASA paper:
http://www.sealevel.info/fig1x_1999_highres_fig6_from_paper4_27pct_1979circled.png
The fact that when volcanic aerosols & ENSO are accounted for the models run hot by about a factor of two is evidence that the IPCC’s estimates of climate sensitivity are high by about a factor of two, and it suggests that a substantial part, perhaps half, of the global warming since the mid-1800s was natural, rather than anthropogenic.
Seth, when you say the models reflect the surface temps reasonably well, do you mean the ensemble mean of the models, or all of the models, or just a few ‘lucky’ models. From what I’ve seen of the various runs, they are all over the place, and I would be very curious to hear you say why you think the ensemble mean has any physical reality as a measure of model skill.
Both.
Individual runs are useful for showing things such as the apparently slow increase of global mean surface temperature from the mid 2000s to the mid 2010s are within model predictions. Ensembles are useful for giving an overall mean warming, which the overall observed warming can be compared to.
But these models have a climate sensitivity and hit the current warming from the atmospheric concentration of the gasses, so the claim that they are proven to overestimate ECS doesn’t seem to hold water.
-Seth
Taylor offered up three options so it’s actually disingenuous to answer “both”. It seems to many, in fact, that the models are all over that place and can say anything, except where we are headed or where we came from or why we aren’t where we’re supposed to be. Your comment suggests that like a loving mother, all your models are special and perfect in their own way, including the fire starters, nose pickers and ones that keep walking into walls.
There is no Tropospheric hot spot, no ocean acidification, no problematic sea level rise, no loss of Antarctic ice mass, no significant ice loss in Greenland, fewer hurricanes, no more frequent droughts outside of el nino years and no benefit to spending trillions for reduction or remediation.
Even the IPCC says that warming up to 1.8C is beneficial.
You seem to be confusing a global climate model with a navigation system.
My point is that models are very good at modelling the global mean surface temperature. I make that point because it is relevant to the article.
I don’t think many of your comments are even relevant to global climate models, and you’ve have made a lot of claims I don’t believe about the sea level rise, ocean acidification, Greenland ice sheet mass loss, and the IPCC’s position on the cost/benefit of 1.8°C of warming.
However, these are also irrelevant to the discussion.
Useful graph there Seth. What you will see is that the adjustments primarily remove the EARLY 20th c. warming. You know, the awkward one which the models can not produce and which was just as strong as the later warming we are all supposed to destroy the world economy for because it is caused by “dirty ” fossil fuels emitting colourless, odourless yet “dirty” CO2.
So in reducing the early warming the make it appear more like models.
Actually, I think Bill was more thinking of Karlisation of the recent record where they rigged the data to turn the pause they could not reproduce into the warming which they had predicted.
In short there has been wholesale manipulation of the climate record to massage into looking more like the models predicted.
Thanks for the link. Proved the point nicely.
That Santer paper is interesting in it’s failureto remove volcanic forcing.
You will see that a few years after both El Chichon and Pinatubo, there is residual warming surge. This is a result of the fact the Santer’s method was a naive linear regression against the time series of the volcanic forcing. This does not allow for the climate reaction ( the feedbacks ! ).
To his credit, he did point out this defect in the SI but obviously does not understand enough about physics, climate or linear systems to realise where he was going wrong and why he got these residual pulses.
In failing to remove the positive excursion of the response to volcanoes this will necessarily get attributed to something else …. guess what that may be.
My article estimating tropical feebacks shows how to account for both the direct forcing and lagged response of the climate system.
It shows that the tropics are very insensitive to radiative forcing and that volcanic forcing has been artificially played down in order to maintain higher CS.
https://judithcurry.com/2015/02/06/on-determination-of-tropical-feedbacks/
Here’s a link for you Seth.
https://www.bing.com/search?q=%22by+Rud+Istvan%22+site%3Ajudithcurry.com&pc=MOZI&form=MOZSBR
Thanks Charles,
Does he have anything in the peer reviewed scholarly literature?
Or is he the R Istvan with a background in Management and Law?
“I don’t believe about the sea level rise, ocean acidification, Greenland ice sheet mass loss, and the IPCC’s position on the cost/benefit of 1.8°C of warming.”
Belief is not required. Science uses evidence. Perhaps you should look up the sea level rise rate, which is the same rate for a long time. Perhaps you should read the IPCC;s position instead of “believing” what you want.
Sorry, you just blew away any credibility you had. You’re more interested in “belief” than in objectively applying the Scientific Method to the CAGW Hypothesis and examining ALL the data – especially data that could falsify the hypothesis (which is particularly interesting for those that actually follow the Scientific Method).
“Belief” has no place in science. Only empirical evidence does. Oh, and if you haven’t worked it out yet (and it appears you have not), climate models are not data, they are on the “hypothesis” side of the Scientific Method.
Okay. I was letting it slide because it was irrelevant to the discussion, but if this red herring is personally important to you, lets tick them off.
The claim is that there is “no problematic sea level rise”, and there hasn’t been any evidence presented for this claim.
On the other hand, there has been significant erosion from sea level rise, displacing thousands already in Bangladesh, and the erosion from the highest sea level ever in Sydney washed away tens on metres of beach in places.
People are displaced now in Louisiana and Alaska from similar erosion.
What’s your evidence that there is “no problematic sea level rise”?
Seth,
“On the other hand, there has been significant erosion from sea level rise, displacing thousands already in Bangladesh, and the erosion from the highest sea level ever in Sydney washed away tens on metres of beach in places.”
Do you think such local sea level problems never occurred anywhere in the world before industrial times? Or, are you just pretending you think that?
No. However, the rise in mean sea level is however increasing the problem to areas that are not sinking.
And it is exacerbating the problem where the land is sinking.
I’m not pretending I think that. I’m saying that the sea level rise from anthropongenic climate change: currently a few centimetres, is problematic.
Seth,
“I’m not pretending I think that. I’m saying that the sea level rise from anthropongenic climate change: currently a few centimetres, is problematic.”
Oh, yeah, the didn’t happen projected warming, that got canceled out by natural variation . . resulting in a few centimeters rise over what would have happened if the natural variation cooling had not been cancelled out by the virtual AGW . . Problematic is good term for that sort of sea level rise, I’ll give you that ; )
Seth August 3, 2016 at 11:22 pm
Thanks Charles,Does he have anything in the peer reviewed scholarly literature?
Seth in Real Science, Peer Reviewed Papers have never been held out to deliver the given truth! Your view to the contrary is an Anti-Real Science approach and method. The Real Scientific Review starts after a Paper is Published, as we can now do with anything Published or said on the Internet, such as everything you’ve said above!
But since you hold to the Anti-Real Science methods and principles of “CO2-Climate Science”, where are your Peer Reviewed Papers, are they “scholarly”, and are you a bona fide “Climate Scientist”?
That’s called hoisting you on your own Petard aka “beating you at your own game”. That is, unless you are appealing to the “The Consensus”, the Consensus about The Consensus, etc., and the self-assigned “Expertise” given by those who “all agree”, to those who “all agree” essentially with the PNAS’ “Tenets” that “CO2 is a greenhouse gas, and a Warming Armageddon will occur if we don’t force the world to go back to the Stone Age, or commit some other form of suicide or homicide, ‘before it’s too late’!”
At which point you fall prey to the same thing I noted in the above paragraph! Because you don’t even have a “Scientific” Consensus comparable to that defined by ~30,000 specific Scientists signing specific statements about CO2 and its net positive effects in the real world, as presented in the Oregon “Petition Project”! Where are the signatures of your “Climate Scientists” upon your tenets?
That is, unless you again retreat to the Anti-Real Science Precept that “Only those who agree with me are right!” Whereas the Principles of Real Science were developed during the Enlightenment to avoid exactly such things as Consensus, Regal,Theocratic and any other Totalitarian Proclamations, and anything else involving a Priesthood, Oracle, Vestal Virgins, Ougi Board, Casting of the Bones, etc..
Or are you perhaps a Solopsist who believes that only You exist? I sure can’t see any difference! How do you know that your “Climate Scientists” even exist?
But Seth, the defect you manifest overall is that you don’t know or think Real Science can exist. Why do you want to live your whole life thinking like this? Is Reality too daunting or is it that you simply don’t have the capacity to separate Reality from your own subjective thought process? Being fooled by the mere use of words standing all alone, is a well known and very severe defect or pit-fall. [I also Majored in Pre-Post Modern Philosophy, which ended up to be studying and dealing with the use of Words!]
‘ and the erosion from the highest sea level ever in Sydney washed away tens on metres of beach in places.’
Surely even you has heard of Storm Surge.
Amen lee, and so the real Mystery for Sea Level Armageddonists is also how sea-shore sand ever got at or above tide level and stayed there! The nearly “Human CO2 molecules also fix their sights on and return beach sand to the Sea at unprecedented rates! Rising Sea Levels mean no more Beaches and Girls Gone Wild!” Lets apply for our Grant and write it up tonight!
Temperatures to date are not keeping up with the climate models and the theory.
In response to this, climate scientists:
—> adjusted the historical temperature trends up;
—> built in unrealistically high aerosol offsets;
—> made-up manufactured temperature reconstructions based on strip bark trees from white mountain;
—> obfuscated wherever possible;
—> tried to shut down all debate;
—> got dissenting scientists fired wherever possible;
—> discounted the natural cycles of the ENSO and the AMO/60 year cycle;
—> tried to move the thimble by focusing on individual weather events;
—> wrote study after study imagining the potential impacts of global warming including even the end of space-time in the universe; and,
—> have never seriously investigated why their theory is so far off;
It is not a track record that should inspire faith.
In conclusion, one must assume that the true ECS is lower than the theologically dogmatic and peer pressure-enforced 3.0C per doubling.
Every objective investigation finds a value between 1.2C to 1.8C per doubling. That is where the REAL number is. Every objective scientist should be permitted to present this evidence and not get fired for doing so.
Its not the END of the world if global warming is wrong. Why do so many people go to such lengths to avoid facing up to this. It is just time to move on to real causes and forget about these wrong on their face ones..
What’s your best evidence of this?
The opposite. The adjustments move the historical temperature trends down;
https://www.theguardian.com/environment/climate-consensus-97-per-cent/2016/feb/08/no-climate-conspiracy-noaa-temperature-adjustments-bring-data-closer-to-pristine#img-2
You’re kidding me right?
You think that temps are keeping up with the climate models? [I have a big database of all of them].
You think the adjustments move the trends down? Only the sea surface temperature bucket adjustment pre-1944 did that and that was very carefully studied, measured and documented by the UK Met Office. Every other adjustment was made (by the NCDC/NCEI) to increase the temperature record.
The “graudian” and dana nuttercitelli are not the best sources of factual information you know.
Nice encapsulation of the state of affairs Bill.
What you need to understand is that ‘climate science’ is not about science. The ‘science’ is used as a camouflage for the real agenda – for the United Nations to obtain a permanent source of revenue so it does not have to depend on the United States (because the US moderates or blocks all the crazy Collectivist and globalist plans that the unelected UN bureaucrats dream on imposing around the globe). Senator Jim Inhofe explained this in his speech at the 10th ICCC, as he was dealing with the UN
Climate science is not about science at all, it is about money and power for bureaucrats, and global wealth redistribution to be administered by Collectivist ideologues. Look at the words from their own mouths, they don’t care about the science at all, only that it can be used as a justification for their agenda when it suits them:
http://green-agenda.com
The confusion from scientists is they cannot understand why political activists can simply ignore the observational evidence and use dirty tricks. The truth is, they don’t actually care about the science except where is supports their political ambitions. Once you understand this then their behavior is perfectly understandable and consistent with their goals – but against the methodology of science (which is why honest and objective people are confused by their behavior).
This time I agree with you.
Where does this climate sensitivity equation come from? Is it based on some verifiable observation? In any case, everything seems to have been spit out of a computer. Eventually the discussion dissolves into an argument about calculations. So, would someone please build a gizmo that tells me how many degrees of any measured temp. are man made.
I agree that not all feedbacks have occurred. After all, how many volcanoes are left to blow?
That machine has been built. The output must be “adjusted” for public consumption however. Any idiot can do that, though. That’s been proved.
The climate sensitivity equation is to be found in the references cited in the diagram. For a fuller explanation, see Monckton of Brenchley et al., 2015, in vol. 60 no. 1 of the Science Bulletin of the Chinese Academy of Sciences.
The definition of equilibrium climate sensitivity ECS can be found on wikipedia.
The conceptual model that use use tells us that any equilibrium temperature change is a linear function of the forcing. So if we know a forcing and its associated equilibrium temperature change, we can get ECS with a simple cross multiplication. This is what you made. Great !
Except that the present temperature change is not an equilibrium one and the equation not valid anymore…
Get it ?
I don’t have a problem with the sensitivity equation but it is not relevant. The Arrhenius theory (1896 paper) is false.
For a better understanding of the effect of trace gases on temperature I would recommend this NatGeo letter:
http://faculty.washington.edu/dcatling/Robinson2014_0.1bar_Tropopause.pdf
The appendices include a detailed radiative-convective model that works in impressive fashion for all seven bodies in our solar system with significant atmospheres. I was able to reproduce the Robinson & Catling model for Titan.
https://diggingintheclay.wordpress.com/2014/04/27/robinson-and-catling-model-closely-matches-data-for-titans-atmosphere/
The climate science equation comes from basic physics. Which then has unjustified rubbish added to it to create a scary equation that did fir the facts for a few years 30 years ago…
It a fools errand to try to model climate. You cannot model the future, if computer models were any good no one would need to ask for money to but a better computer to increase the accuracy of the model because if you can model the temperature you could model the stock market, if you could model the stock market you would be rich beyond you wildest dreams, well no one can model the stock market the same is for climate to much information that is known and far more information that is unknown. I find the entire debate much like the old nineteenth-century debate among theologians on how man angels can exist on the head of a pin. I certain future generation will find the climate model debate to be just as absurd.
It might be a good idea to know how the climate responds to different forcings, especially such as increases in greenhouse gasses. Since that’s what is happening.
Think of it is modelling a system.
I think that those are quite different problems.
Maybe so Seth but predictions are just that and nothing more , faith is required which means you have lots of faith in the whole CAGW fraud , people make and lose large amounts of money playing both .
It might be a good idea to know how the climate responds to different forcings, especially such as increases in greenhouse gasses. Since that’s not what is happening.
2105 was among the 10 hottest years on record. If temperature has risen 0.83C since 1850 then that would average 0.083 C for each hottest year.
Can anyone point me to where I would find the actual temperature for each of these hottest years please?
You can get the GISS annualt temps here
Seth, thanks.
“2105 was among the 10 hottest years on record”
Blimey, these warmist have invented Time Travel as well! Respect!
As always with that math hyperventilating soap box races there is to consider:
– as Christopher Monckton of Brenchley said when presenting his ‘pocket calculator’:
here’s the shortest algorithm programmed, with all variables and constants, to MIMIC all the ‘climate models’ on the market.
turn the knobs and you simulate any IPPC virtual forecaster.
– none of that data extruders represents the real world.
_________________________________________
– and they NEVER were intended to:
they all are to prolong a ever threatening meme to support political aims.
“To assist in grasping the beauty of his brief but devastating argument,” I am scared when I hear this from Monckton’s mouth – it reminds me of his ‘climate model that you can run on your pocket calculator’… what happened to that piece of Chinese magazine peer reviewed ingenuity? How many model runs does anybody perform with it, including Monckton? I bet he has totally forgotten about it and rather not be reminded of it.
Yes,
Matt on August 3, 2016 at 11:40 pm
“To assist in grasping the beauty of his brief but devastating argument,” I am scared when I hear this from Monckton’s mouth – it reminds me of his ‘climate model that you can run on your pocket calculator’
that’s the sobering reality – ’til you present the perfect world solution.
The simple model in Monckton of Brenchley et al. (2015) is in widespread use. Indeed, the paper or its abstract have been downloaded more times than any other in the 61-year history of that distinguished journal, by a factor of 12. The equation presented in the head posting is the equilibrium form of that equation for CO2 doubling, as Matt would have known if he had ever read our paper before presuming to criticise it.
And from Google Scholar’s count the paper has already accumulated zero citations.
And with such “widespread use”, we could see that trend continuing for some time.
Google Scholar is wrong.
Perhaps they’re using citations and not pageviews as the metric?
The childishly prejudiced Seth appears unaware that Google Scholar does not pick up all citations. Our paper has indeed been cited by a few papers, and is increasingly being used pedagogically to provide a simple and accessible method of determining climate sensitivity. The equation comfortably outperforms the general-circulation models in this respect, as the second of our two papers in the Science Bulletin well establishes. It is of value to independent thinkers not to be compelled to rely upon a Party Line handed down by politicized “scientists”, but to be able to verify for themselves by a simple model that the more complex models contain biases – whether inadvertent or wilful – that lead to the considerable overstatement of climate sensitivity that is the subject of the head posting.