Guest Post by Ira Glickstein

“Seriously,” he continued, “we should watch the alarming melting of glaciers and polar sea ice rather than the ‘Pause’ in Global Warming according to thermometer readings.”
When I give talks about climate science to intelligent audiences, my general theme is that Global Warming is REAL, and partly due to human activities, but it is NOT a big DEAL.,
- Yes, the Atmospheric “Greenhouse” effect is real. It is responsible for the Earth being about 33⁰C (60⁰F) warmer than it would be absent “Greenhouse” gasses in the Atmosphere.
- Yes Carbon Dioxide (CO2) is a key “Greenhouse” gas, second only to Water Vapor (H2O).
- Yes CO2 has increased by about a third during the past century (from 300 to 400 parts per million), mostly due to unprecedented burning of large quantities of coal, oil, and natural gas.
- Yes, temperatures have gone up by about 0.8⁰C (1.5⁰F) over the past century.
- HOWEVER, warming is mostly natural and due to Earth’s recovery from the depths of the last ice age, some 18,000 years ago.
- No matter what we do, the Earth will warm for hundreds or thousands of years, then plunge into the next ice age. Of course this will not happen monotonically. There will be multi-decade periods of warming and of cooling, just as the Medieval Warm Period (1000-1200s) was considerably warmer than today, and the Little Ice Age (1600-1700s) was colder.
- IPCC climate theory and computer models have failed to match actual satellite temperature data. Alarming predictions have not come to pass. They totally missed the statistical warming “Pause” of the early 2000s. [The IPCC is the Intergovernmental Panel on Climate Change]
- [See the lower right section of the figure] For several periods, even the lowest edge of the Yellow error band is warmer than the highest edge of the Blue band! [These error bands are 5%-95% statistical confidence limits, which means there is less than 1 chance in 20 any point outside a band is due to random error. Thus, there is less than 1 chance in 20 x 20 = 400 that any point in the White space between the Yellow and Blue bands is due to random error. Either the NASA satellite sensor systems are badly out of order or the IPCC climate models are terribly wrong!]
- The gross failure of the IPCC models to correctly predict warming, despite a significant increase in CO2, proves that the models, and the underlying IPCC climate theories, are wrong.
- The most generous explanation is that the IPCC climate scientists simply over-estimated the sensitivity of climate to CO2 increase by a factor of two to three.
- The most likely explanation is that their climate theory is either incomplete or totally wrong, so their models failed. Either that, or, for political purposes, they purposely jiggered the model parameters to create alarming projections and keep research funding coming from we taxpayers to their organizations.
Rationalizations for what happened to the excess heat due to human-made CO2:
- The Oceans absorbed it!
- The melting Ice Caps absorbed it!
How can the world’s leading climate theorists and modelers still be considered competent if they did not know about the heat capacity of the oceans? (Or, apparently, even the Ice Water Experiment! :^)
The Abstract for the recently published study by Michael “Nature Trick – Hockey Stick” Mann, et. al admits the reality of the “Pause” “temporary slowdown”. Guess what he blames it on?:
The temporary slowdown in large-scale surface warming during the early 2000s has been attributed to both external and internal sources of climate variability. Using semiempirical estimates of the internal low-frequency variability component in Northern Hemisphere, Atlantic, and Pacific surface temperatures in concert with statistical hindcast experiments, we investigate whether the slowdown and its recent recovery were predictable. We conclude that the internal variability of the North Pacific, which played a critical role in the slowdown, does not appear to have been predictable using statistical forecast methods… [emphasis mine]
In other words, the unpredictable “internal variability of the North Pacific” ate my alarming projection! (A variation on the old “dog ate my homework” excuse :^)
Why was it not predictable by the IPCC’s leading climate scientists?
- Because statistical forecast methods are weak?
- Because the catastrophic warming climate theory is wrong?
- Because they knew better but did not dare to reign in their alarming predictions for fear of losing research grants?
I find it amazing that so many of my friends (who are otherwise intelligent and reasonable) cling to their firm belief in a coming human-caused climate catastrophe. Their confidence is based on the alarming predictions rooted in IPCC climate theory and computer models.
Yet, like the confident questioner I mentioned in the first paragraph, they seem to acknowledge that the IPCC theorists did not know about the relatively simple concepts of ocean heat capacity, or even the temperature profile of ice water due to the Heat of Fusion!
If these models could not correctly predict a near-term event, such as the “Pause”, why put any credence in their catastrophic predictions for 50 or 100 years hence?
How Does the Ice Water Experiment Relate to Earth’s Proportion of Ice to Liquid Water?
To satisfy my own curiosity, I decided to do some research and figure out how much the melting of glaciers, sea ice, and ice sheets might have reduced Global Warming since 1979. This period includes the statistical “Pause” (or “temporary slowdown in large-scale surface warming during the early 2000s” as Mann refers to it).
The Ice Water Temperature Pause Experiment works for two reasons:
- It takes nearly 80 times as much energy to melt a given mass of ice as it does to raise an equivalent mass of water 1⁰C (1.8⁰F). (This is called the heat of fusion associated with the state transition of water from solid to liquid form.)
- The Ice Cubes make up a substantial percentage of the total mass of the ice water mixture. (When the ice cubes melt down to a small proportion of the water, the temperature does rise.)
So, what is the percentage of ice to liquid water on Earth, and has enough of it melted to account for the failure of the IPCC models since 1979, or during the “Pause”?
According to Debenedetti, Pablo G. & H. Eugene Stanley. “Supercooled and Glassy Water.”Physics Today. Vol. 56, No. 6 (June 2003): 40 (quoted by http://hypertextbook.com/facts/2000/HannaBerenblit.shtml) here is what we need to know about the Earth’s Ice and Water:
- 1,300 x 106 km3 of water in the oceans [106 km3 = millions of cubic kilometers]
- 33 x 106 km3 of ice in the polar ice caps
- 3 x 10⁶ km3 in the Greenland ice shelf and
- 30 x 106 km3 in the Antarctic ice shelf
- 0.2 x 10⁶ km3 of ice in glaciers
- 0.1 x 10⁶ km3 of water in lakes
- 0.0012 x 10⁶ km3 of water in rivers
- 0.22 x 10⁶ km3 of water in annual precipitation
However, actual ice melt rates are much, much, much less, according to
https://nsidc.org/cryosphere/sotc/ice_sheets.html
… best estimates of mass balance changes per year for 1992 through 2011: Greenland: lost 142 ± 49 gigatons; East Antarctica: gained 14 ± 43 gigatons; West Antarctica: lost 65 ± 26 gigatons; Antarctic Peninsula: lost 20 ± 14 gigatons. [net annual melt loss 213 gigatons]
Conveniently, 1 gigaton is the weight of one cubic kilometer (km3) of fresh water. So, 213 gigatons is equal to 213 km3 of ice (momentarily ignoring the fact that 1 km3 of ice weighs a bit less than 1 km3 of sea water). Lacking more specifics, let us assume an average annual melt rate of 213 km3 is at least roughly representative of average annual melt rates from 1979 to 2015. Thus, the total melt for 1979-2015 would be 213 x 36 = 7688 km3, which we will round up to 8000 km3 to more than make up for the difference in weight of ice and sea water.
So how much does all that melting amount to in terms of delayed temperature increase? 80 x 8000 / 1,300,000,000 = 0.000492⁰C, which we may round up to 0.0005⁰C (0.0009⁰F) of the warming since 1979, and even less of the missing warming during the “Pause”.
So, total Earth ice melt accounts for less than 0.09% of the warming missing from the IPCC’s alarming projection. Not so impressive, is it?
- Heat of Fusion is the energy to change the state of a gram of a given substance from solid to liquid.
- Specific Heat is the energy to raise the temperature of a gram of a given substance 1⁰C.
- Water (in calories per gram) Heat of Fusion = 79.7 Specific Heat = 1.0
- So, it takes ~80 times more energy to melt 1 gram of ice than to heat 1 gram of water 1⁰C.
- Therefore it takes lots of heat energy to melt glaciers and polar ice caps.
- Does Ice melt explain the IPCC climate model failure to predict the “Pause”?
- How much Global Ice is there, and how much Global Ice has melted?
- How much Global Ice has melted compared to the volume of the oceans?
- Global Ice is only 1/50th of Global Water mass. Less than 1/20,000th of it has melted since 1979.
- So, the temperature effect of Global Ice melt during this time period is insignificant, only 0.0005⁰C (0.0009⁰F).
For me it looks like that skeptics admit that the AGW theory has already failed. The error of the IPCC’s model is now about 50 % mainly because of the pause. At the same time the majority of skeptics do not know, what is wrong with the IPCC’s theory. TCS according to IPCC is 0.5 K/(W/m2) * 3.71 W/m2 = 1.85 K. Is this the correct scientific basis or is there something wrong? The skeptics should find the answer. Another option is that IPCC’s formula is correct but there are other forces, which are unknown to IPCC and they are so strong that they can eliminate CO2 forcing and even to cause cooling like during the period from 1945 to 1975 (roughly). So far I have seen only the sun theory as explanation. It is a very good option for the long term fluctuations from hundred to thousand years but is it capable to explain the quicker changes of the temperature?
You can know what is wrong with IPCC theory, yet still not know how the climate works. IOW, it is sufficient to show that IPCC theory has fatal errors. For some of the things that we and the IPCC don’t know, see:
https://wattsupwiththat.com/2015/09/17/how-reliable-are-the-climate-models/
In this article I explain one of the major errors in the IPCC report, and touch on some of the climate factors that are not understood.
(The footnotes in this article are actually pretty important)
Mike, very nice piece… needs to be circulated as it’s rare to find all this info in one place. (as an example, F. E. once mentioned that they got clouds wrong; i’ve never happened across an explanation till now)
Mike,
After reading your article, I understood that you accept that the CO2 forcing according to IPCC (RF = 5.35*ln(C/280) is correct. You propose that the problem is that many other things are missing or wrongly combined. Did I get it right?
@Mike Jonas,
I was in the hospital when your article was published last September and missed it. It’s great.
“is it capable to explain the quicker changes of the temperature?”
Yes
“At the same time the majority of skeptics do not know, what is wrong with the IPCC’s theory”
This is because there is so much wrong with IPCC theory that if you throw a dart at it the chance of hitting something wrong is nearly 100%. This contributes to the perception that skeptics are not all on the same page, while all of consensus climate science is, albeit the wrong page.
What most have not come to grips with, including many skeptics, is the foundation error that has led to the many other errors that followed. I can say what this is with 100% certainty, and surprise, surprise, Hansen was at the nexus of this error, which got canonized in AR1 and has never been corrected. It has to do with misapplying Bode’s control theory to the climate in order to support the possibility of impossibly large positive feedback.
co2isnotevil wrote: “To calculate the actual net warming of the planet, you need to start with a planet with no ice and clouds which will receive more solar power and be intrinsically warmer.”
To follow up with another observation about your entangling of feedbacks with discussion about the net greenhouse effect. You assert the total greenhouse effect is less in practice because of total cloud effect on albedo. But if you are going to open that can of worms you have to also include ice albedo. Yes, dropping all GHGs out of the atmosphere presumably means *no* clouds and thus less reflectivity which would mean some conceptual warming (how you argue the 33K should be smaller), but the dramatic drop in temperature will mean ice covering most of the world (compare to the last glacial at just ~4.5°C cooler) which will radically ramp up albedo, leading to cooling feedback and permanent snowball earth. You don’t need clouds for reflectivity when you have ice.
The larger point is that the GHE “absent other effects” is purely a theoretical concept, but 33°C is the right figure for that conceptual effect looked at theoretically and in isolation. You have not successfully identified any flaws in how feedbacks are handled in climate science.
Geoff,
How can you justify separating the GHG effect of evaporation from the other effects of water? Is it because the GHG effect is the only influence that causes warming, while all other effects result in cooling?
Yes, ice albedo has an effect on the sensitivity, but only along the thin line of latitude where the average temperature is close to 0C. This is such a small part of the surface that the effect is largely negligible planet wide, although consensus climate science doesn’t recognize this as they try and extrapolate this minor influence as a planet wide phenomenon.
You have not paid attention if you think I have not identified serious flaws in how feedback is characterized. This was first done by Hansen (who confused feedback and gain), ‘corrected’ by Schlesinger and committed to doctrine in AR1. IN addition to numerous other errors, neither accounted for the fact that Bode’s amplifier measures input and feedback to determine how much to deliver from an implicit, infinite source of power. The climate system is passive and has no such implicit power supply and instead consumes input and feedback to generate its output. This COE constraint has never been accommodated by consensus climate science because to do so undermines the narrative.
How else do you think the consensus can justify amplifying 3.7 W/m^2 of incremental input into the more than 16 W/m^2 of surface emissions required to sustain a 3C average temperature increase? Every time some ignorant fool says ‘its the feedback’, it reminds me of the line in the film Idiocracy, ‘It’s the electrolytes’.
“How can you justify separating the GHG effect of evaporation from the other effects of water? Is it because the GHG effect is the only influence that causes warming, while all other effects result in cooling?”
While they are all loosely related to water (this is earth, after all), the radiative effects of water vapor in the atmosphere, cloud feedback, and ice albedo feedback are all “separated” and discussed separately because they are actually different things and it is more useful to talk about them separately. They are not “unfairly” separated where only the warming influences are counted, as you repeatedly assert, but cannot support.
Ice albedo does not result in cooling, it is absolutely a positive feedback, as already discussed – per paleoclimate, per modern observations.
The prevailing evidence on clouds also happens to indicate that it is “likely” positive, i.e. amplifies some warming, again as already discussed. However, there is low confidence in this result and it could be negative.
You are neither supporting your points, nor accurately reflecting (much less addressing) mine.
“Yes, ice albedo has an effect on the sensitivity, but only along the thin line of latitude where the average temperature is close to 0C”
Ice albedo has an effect wherever ice cover changes, which is not a trivial process to summarize and doesn’t really have to do with any “thin line of latitude where the average temperature is close to 0C”. You can’t just say things.
“This is such a small part of the surface that the effect is largely negligible planet wide”
During the last glacial maximum ice sheets advanced quite far in North America, Europe and Asia and the ice caps were much larger. This is an enormous change in terms of albedo and the amount of solar energy reflected by the planet. That you acknowledge the role of cloud feedback but reject ice cover as “negligible”(!) is not remotely logical.
“How else do you think the consensus can justify amplifying 3.7 W/m^2 of incremental input into the more than 16 W/m^2 of surface emissions required to sustain a 3C average temperature increase? Every time some ignorant fool says ‘its the feedback’, it reminds me of the line in the film Idiocracy, ‘It’s the electrolytes’.”
Well I’m not an expert, I see an article that says ECS of 3 translates to ~0.75 ºC/(W/m2). You saying “16 W/m^2 of surface emissions required to sustain a 3C” then seems to imply you are assuming ECS is closer to 0.75(!), far below even the broad consensus uncertainty range of 1.5-4.5 for this value, which comes from looking at the totality of paleoclimate, modern instrumental and model-based ECS estimates which universally find a range for ECS that is far from this value (generally entirely in the positive (>~1.1) feedback range):
http://www.climatechange2013.org/images/figures/WGI_AR5_FigTS_TFE.6-1.jpg
So this is all just another way of saying you are assuming a negative feedback, super stable climate (based on nothing solid that you are able to present – just what appears to be some vague misapplication of electrical engineering analogies.)
Basically, your view flies in the face of a lot of empirical evidence:
* we directly observe things like the strong positive WV radiative feedback
* we do not directly observe dramatic negative feedbacks that would overwhelm this in the other direction. Even cloud feedback (while very uncertain) appears likely positive based on available evidence.
* when we look at paleoclimate we do not see evidence that the climate is extremely resistant to change as you assert. The climate is able to shift into glacial / ice age states and back out based on what appear to be non-dramatic changes in energy input (e.g. orbital shifts in insolation).
Geoff,
Much of what you say are tired old talking points that have been beat to death elsewhere and I see no point to address all of them, but I will address the major points of misinformation.
You fail to see how ice ages are the combined effect of several different orbital factors reinforcing or cancelling the effects of each other. There’s the roughly 20K year cycle as perihelion shifts through the seasons and the roughly 40K cycle as the Earth tilts from minimum to maximum and the 100K year cycle as the eccentricity of out orbit varies over a relatively wide range. A simple Fourier analysis of the temperature clearly shows these cycles. You are also misinformed about the magnitude of these effects. While the yearly average solar input does not change over a very wide range, the effects are amplified by the asymmetry between hemispheres (S has a larger fraction of water and land at the pole) combined with the precession of perihelion which is what Milankovitch discovered a long time ago. There is also a lot of uncertainty about just how constant the output of the Sun really is. After all, most of the stars we observe in the Universe are variable over a very wide range of periods and magnitudes. And of course, the paleo data is absolutely clear that CO2 concentrations respond to temperature changes and not the other way around.
You claim that I am assuming negative feedback and data suggests positive feedback, but that is incorrect. I assume nothing and go by what the data tells me. The data strongly infers something that looks like negative feedback, but as I keep saying, Bode’s analysis, which climate feedback theory is based on, does not apply to the climate system because the climate is a passive system (like an RC circuit), while Bode’s analysis applies only to systems with active gain like transistor amplifiers (actually Bode dates back to vacuum tubes) with an implicit power supply that provides all output. Why is it so hard to understand the difference between active gain and a passive system?
You also don’t seem to understand that the Stefan-Boltzmann LAW dictates that if the surface temperature rises by 3C, its emissions must increase by about 16 W/m^2. At 287K, the surface emits 384.7 W/m^2 and at 290K (3C warmer) it emits 401 W/m^2. This difference is 16.3 W/m^2. For the surface to emit 16.3 W/m^2 more, it must be receiving 16.3 W/m^2 more, otherwise it will cool until input == output. Each of the 239 W/m^2 of input from the Sun results in about 1.6 W/m^2 of emissions by the surface. If the next W/m^2 resulted in 1.6 W/m^2 more emissions by the surface, it would emit 386.3 W/m^2 which corresponds to a temperature of 297.3K or about 0.3C per W/m^2. The 0.8C +/- 0.4C per W/m^2 claimed by the IPCC is so far away from reality it’s absurd. For this to be true, the next W/m^2 of input needs to result in 4.3 W/m^2 more surface emissions. How is it possible that the next W/m^2 of input from the Sun is 2.7 times more powerful at warming the surface than any of the W/m^2 that preceded?
Are you a Bernie Sanders fan? He has trouble with simple arithmetic too.
“You fail to see how ice ages are the combined effect of several different orbital factors reinforcing or cancelling the effects of each other.”
I’m well aware. Your comment is fairly non sequitur; I haven’t commented on this, nor is it particularly relevant to the discussion. Your arguments are a bit of a mess in general.
I see you are handwaving about solar and orbital in order to justify your basically blind assertions about the climate being inherently stable / negative-feedback based. Great. If what we are doing is making up stories, yes anyone can make up stories they like. I like yours fine – I agree it would be more convenient if we imagine a world where global warming isn’t a problem because the climate inherently resists change. On the objective, external earth the planet is warming in defiance of your beliefs about it, however.
“the paleo data is absolutely clear that CO2 concentrations respond to temperature changes and not the other way around.”
So striking how seemingly capable individuals continually repeat these elementary logical fallacies, year after year, despite endless corrections. The paleo data obviously does not tell you that temperature does not respond to CO2 increases. The fallacy is assuming causality can only flow in one direction (fairly basic). It does, in this case, tell you that CO2 does not appear to have been the trigger of the climate change being observed in cases like the most recent glacial.
“You claim that I am assuming negative feedback and data suggests positive feedback, but that is incorrect. I assume nothing and go by what the data tells me.”
Yet strikingly unable to cite data that supports your views or logically support your assertions about such data. For someone who claims to understand climate science better than the worldwide disciplines of climate scientists, geophysicists, atmospheric physicists, geologists and oceanographers, your tendency to argue by assertion and handwave paints a picture that I don’t think you are very self-aware about.
E.g. you may not be aware that people misapplying electrical engineering concepts to climate science is an eye-rolling internet cliche at this point. It is rather preposterous that you think there is a glaring fundamental flaw in the climate concept of feedbacks that over decades thousands of climate scientists and top scientists in every country reviewing climate science (national academies etc.) have overlooked. Perhaps if I have time I’ll try to understand the specifics so I can help you understand your error there. My understanding is that climate scientists use a widely and well understood concept of DC or static feedback per documents like:
http://earthweb.ess.washington.edu/roe/Publications/Roe_FeedbacksRev_08.pdf
“The 0.8C +/- 0.4C per W/m^2 claimed by the IPCC is so far away from reality it’s absurd.”
We are probably both somewhat wrong here – easy to confuse surface vs. TOA fluxes etc. If you would like to highlight exactly what IPCC claim you are talking about here (what WG1 section?) I am willing to try to help debug what you think you have identified here.
It gets tedious reading the constant barrage of the ‘appeal to corrupted authorities’ logical fallacy that regularly appears here. For example, in these comments:
geoffmprice says that co2isnotevil is…
…strikingly unable to cite data that supports your views or logically support your assertions about such data. For someone who claims to understand climate science better than the worldwide disciplines of climate scientists, geophysicists, atmospheric physicists, geologists and oceanographers… &etc.
And:
…over decades thousands of climate scientists and top scientists in every country reviewing climate science (national academies etc.)… &etc.
See? That logical fallacy is posted here regularly. But that’s another logical fallacy: the fallacy of endless repetition.
Constant repetition doesn’t make something true. But constant repetition sure is convincing to a certain small clique here. They believe it, because they want to believe it.
Next, geoffmprice says:
If what we are doing is making up stories, yes anyone can make up stories they like.
Regarding the fabricating of ‘stories’, if I may contribute a (true) story about how the IPCC does their ‘science’ behind closed doors:
Each of the statements here were originally ‘expert reviewed and approved’ for Chapter 8 of the 1996 IPCC Asessment Report. But the following committee statements were deleted prior to publication by the Chapter 8 lead author, Ben Santer (of Climategate infamy):
1. “None of the studies cited above has shown clear evidence that we can attribute the observed changes to the specific cause of increases in greenhouse gases.”
2. “While some of the pattern-based studies discussed here have claimed detection of a significant climate change, no study to date has positively attributed all or part (of the observed changes) to antropogenic causes. Nor has any study quantified the magnitude of a greenhouse gas effect or aerosol effect in the observed data – an issue of primary relevance to policy makers.”
3. ”Any claims of positive detection and attribution of significant climate change are likely to remain controversial until uncertainties in the total natural variability of the climate system are reduced.”
4. ”While none of these studies has specifically considered the attribution issue, they often draw some attribution conclusions, for which there is little justification.”
5. ”When will an anthropogenic effect on climate be identified? It is not surprising that the best answer to this question is, `We do not know.’ ”
But Santer deleted those comments, and replaced them with his own comment:
“The body of statistical evidence in chapter 8, when examined in the context of our physical understanding of the climate system, now points to a discernible human influence on the global climate.” [emphasis added]
Twenty years later Santer’s personal view has become a central talking point of the alarmist crowd. Anyone who still believes that the UN/IPCC is primarily interested in science either hasn’t followed years of discussions here, or they’re doing their part to cover for Santer’s wholesale rewriting of the IPCC scientists’ conclusions.
The skeptics know many things that are wrong with the AGW theory. The proponents do not seem to know what is wrong with it. They refuse to listen to any of the arguments of the skeptics and continue to patch on “adjustments” such as this latest one by Michael Mann, that completely lack any scientific rationale or justification. The Mann is a liar and is not a scientist!
To: aveollila. For one skeptic’s calculations showing that climate sensitivity is about 0.54 K, including positive water vapor feedback, but not including net cloud feedbacks which are negative, see https://wattsupwiththat.com/2016/05/12/negative-climate-feedbacks-are-real-and-large/comment-page-1/#comment-2218029 .
Warmth is measured by thermometer. Warmth is measured in degrees. The claim was global warming; not global ice melting.
Warmth is measured by thermometer. Warmth is measured in degrees.
The property of objects that is measured by a thermometer is called temperature, an “intensive” property. It’s not the same as internal heat energy (thermodynamic enthalpy), which is an “extensive” property, and is measured in joules or calories.
The claim was global warming; not global ice melting.
Both claims are made by the alarmists. To compute how much heat energy would be necessary to melt a certain amount of ice, you need to know the heat of fusion to compute heat energy required. But if you know the heat of fusion, then you also know that the introduction of heat energy for melting is not observable as a change in temperature. So if the models are “smart” enough to predict the amount of melting, they should also show the correct temperature response caused by melting.
“So, total Earth ice melt accounts for less 0.09% of the warming missing from the IPCC’s alarming projection”.
That is an interesting calculation. Let’s accept it’s correct, but within an error of ± 0.05%. That’s still an extraordinarily stable state within what most (other than politicians and mass media hacks) will agree is a chaotic system.
I’m therefore taking bets in which year some politician will be the first to promise “I will stop the next ice-age”. Send your betting slip and stake (gold only) in a tightly closed bottle into an ocean current near you addressed to Richard C or his heirs and assigns and subsequent heirs and assigns, EU zone 17 [previously known as Hampshire, England] .
I am offering odds of x10 the number of years between now and if/when you win.
Terms and Conditions Apply
You, your heirs or assigns must
bugger .. ran out of characters
One must know that a lot of glaciers of medium altitude had disappeared by the end of the medieval optimum. The Little Ice Age beginning by the 14th century made them restored.
One of the farther south glaciers of the French Alps, the Marinet glacier stands between 2500 to 3000 meters in altitude. It is now in a shrinking phase, currently half the size it had by the mid 19th century. The lower end of the ice tongue is becoming a “rocky glacier”: The ice is buried under a thick heap of rocks and boulders that shields it from the sun’s heat.
So it is probable that a lot of glaciers currently are in a similar bad shape and will disappear again within one or two centuries unless the climate will become colder.
Nothing new under the sun except for the warmunists
Could have been watching ice cubes melt for 22,000+ years.
When water changes phase either from liquid water to steam or vice versa or liquid water both directions from ice it does so at a constant temperature, but not constant enthalpy. When water precipitates out of the air onto an ice cap it take a staggering amount of heat with it, tons in fact, 12,000 Btu/h, 3,517 W. That’s why water is the 1,000 Btu/lb gorilla in the living room, orders of magnitude larger than CO2’s puny 2 W/m^2, 6.28 Btu/h / m^2. Even a minor change in the albedo, 100 +/- W/m^2, eclipses CO2’s trivial influence.
How to quantify all that is dumb. good job! lol
Because global ice volume is rather stable the implication is the net melt is equivalent to the net freeze and so is energy neutral. Melt is not going to happen without freeze on an annual basis, and over longer periods it is, well, periodic, and we find ourselves now in a rather pleasant but temporary interglacial period. The natural forces that have maintained this short and long term stability are not understood. Lacking that understanding and with a pent up demand to do something god-like for the world, those who would be god, and they know who they are, invented thermogeddon as a consequence of humans being alive, inventive, and productive. That is why every solution for the unsupportable thermogeddon problem involves devolution of humanity except for the elites who need all the trappings so they can carry on doing the good work on behalf of Gaia.
Doesn’t the stability of the global ice volume, destroy the climate change meme?
One major flaw in the CO2 argument is that it causes no pressure difference, adding CO2 to an atmosphere causes no pressure change, where as any idiot and their uncle has shown patterns and graphs that are caused by changes in temperature in an atmosphere, see my point?
@Sparks
“… adding CO2 … causes no pressure change …”
Actually, CO2 does contribute its partial pressure to the total atmospheric pressure on Earth. It’s not much though, much less than 1mb.
On Mars, the atmospheric pressure is 6mb, and almost all of it (95%) is CO2. But CO2 is about 28 times more plentiful (by volume) on Mars than on Earth. So the CO2 partial pressure on Earth will be a small fraction of 1mb at the surface. Probably not detectable in the presence of natural pressure variability.
@me
“But CO2 is about 28 times more plentiful (by volume) on Mars than on Earth. ”
I should clarify that statement: for each unit of surface area, the mass of CO2 in a column of air reaching to TOA is 28 times greater than the CO2 mass in a column of air on Earth also reaching to TOA
This is an appropriate measure for comparison, since partial air pressure is proportional to weight of such area-normalized columns.
Here’s the proof in Python2 code:
# Compute ratio of CO2 mass per km2-column for Mars and Earth
mass_earth_co2_kg=3.0e15 # i.e 3 trillion tonnes
mass_mars_co2_kg=2.5e16 * 0.95 # fudged: mass of atmos x 95%
area_earth_km2=5.1e8
area_mars_km2=1.4e8
co2_kg_per_mars_km2=mass_mars_co2_kg/area_mars_km2
co2_kg_per_earth_km2=mass_earth_co2_kg/area_earth_km2
print co2_kg_per_mars_km2/co2_kg_per_earth_km2
#ans=28.8
Johanus,
You’re missing a valuable point, (correct me if I picked you up wrong) it is pressure difference that causes temperature, there is no major change in conditions that are caused by humans that can be attributed to atmospheric pressure, obviously atmospheric composition of a planet has a minimalistic effect on its climate.
I see comments all the time that suggest atmospheric composition is a cause of temperature, this is pure nonsense, when a gas is introduced into a planetary atmosphere it does not change the primary forces that cause pressure differences, and we’re talking about CO2, a property found here on earth (net change negligible) no matter how much we can produce of one gas and introduce it to a planetary atmosphere, it will never change the pressure of the planet and never change the pressure differences that fluctuate and change temperature on a planetary scale.
Get a grip of this one clear simple fact and have a look…
Interesting.The Alarmed Ones seem oblivious to the joys of living on a world dominated by water.
A blessing for our kind of life.
Slightly off topic, if the total warming has been a whopping 0.8C, yet the conversion from mercury in glass to electronic sensors incorporated a 0.9C bias higher, does that mean we are actually cooling?
After all this is Climatology,where trends can be created from noise and blessed with world ending confidence.
So the trend is now cooling by 0.1C.
Sarc.
On a related issue, how much energy would be really required to melt the Antarctic ice sheet?
The ice temperature varies with depth, but it is typically at –5 degrees C, that is 5 degrees below freezing point.
Any melting requires that portion of ice to be raised to zero (0 degrees C) then more heat applied (latent heat of
fusion) to convert it to melt water at 0 degrees C. This is what is required for the melting process.
For each 1 tonne (1,000kg) of ice: a. energy required to raise it to 0 degrees C is 17 MJ
b. latent heat of fusion to melt the ice is 334 MJ
Therefore the energy required to melt the ice cap from its present condition = 351 MJ/tonne
Total mass of the ice sheet = 30 million x 0.917 x 10E+9 = 27.5E+15 tonnes (the SG of ice is 0.917)
To melt the entire ice sheet would require 351 x 27.5E+15 = 965.3E+16 MJ heat energy.
But, the entire world’s proven energy reserves of oil, gas and coal in total have an energy content of only
2.87E+16 MJ and these reserves will last us for hundreds of years at current consumption rates.
What this means is that it would take 336 times the energy in all the planet’s fossil fuel reserves to melt the Antarctic ice sheet. (Check the data and do the maths yourself – it’s quite a revelation.)
Expressed another way, if we were silly enough to squander all our energy reserves right away and we focussed all that energy onto the Antarctic ice sheet it would melt only 1/336th portion of it (or 0.3%) and the sea levels would rise only 18cm (or 7 inches). And then we wouldn’t have any energy left to keep warm, or cook, or communicate, or travel, etc.
Those alarmist rising sea level claims are nonsense!
Gravity is a variable, the speed of light is the constant, are you confusing mass density to produce energy from a tiny amount, into a MOLE hill? (big joke in there somewhere) lol
“Yes Carbon Dioxide (CO2) is a key “Greenhouse” gas, second only to Water Vapor (H2O)”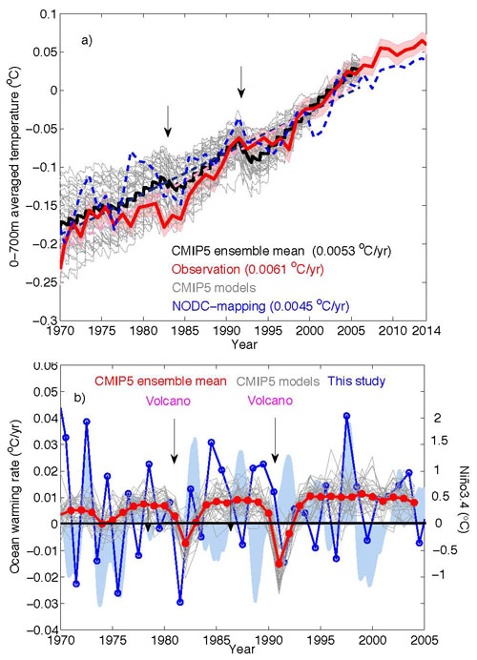
Yet more significant to climate, because it is the GHG whose concentration can change independently of temperature. Wouldn’t kill folks to reflect such basic facts. In fact, being able to do this lends credibility to other claims (credibility naturally a core challenge when going up against well-grounded science.)
“HOWEVER, warming is mostly natural and due to Earth’s recovery from the depths of the last ice age, some 18,000 years ago”
Except that global multi-proxy reconstructions of temp show a long slow cooling for the past ~6K years, prior to the sharp warming spike in modern times.
http://www.igbp.net/images/18.30566fc6142425d6c911a95/1384954096860/NL81-PAGES-fig2.gif
Not to mention the fact that this statement is plainly circular/meaningless. “Warming is natural – I can tell because it’s being caused by something since the last ice age.” In conventional science, we look for causes that are quite a bit more specific and rooted in physical rather than philosophical mechanisms, are testable claims, etc.
“No matter what we do, the Earth will warm for hundreds or thousands of years, then plunge into the next ice age”
Same criticism – this is circular. “It isn’t caused by humans because it is natural. It’s natural because it isn’t caused by humans.”
How can there be so much commentary that appears rather completely unilluminated by basic principles of logic?
A trope at this point, but naturally core statements about “all the models are wrong!” via similar rote repetition of assertion.
Total heat uptake by the climate system has been pretty much as predicted:
Tamino recently walked through models vs. surface measurements:
https://tamino.wordpress.com/2016/05/17/models/
With the requisite (desperate) appeal to satellites/MSU. Using the de facto Monckton-driven standard of RSS one presumes, latest version? No? Not just any “satellite data” then.
Does it really not seem desperate to cling to ‘pause’? How many of these statistical ‘pauses’ have there been just since 1970, like half a dozen? Yet with consistent total uptake of heat by the total system / ocean throughout? Models don’t attempt to predict when the flatter La Nina-heavy type phases in surface warming will be (ENSO/weather driven), though they all predict them to exist. What’s relevant to theory and policy is rate of warming per decade, which continues to be right on. But I suppose that dives into subtleties that don’t serve a desired ideological tack.
Such a long article on completely invented controversies. With all due respect, this seems the definition of an alternate reality internet bubble. Makes one tired just looking at the effort that goes into it, having so much text based on profoundly counter-factual premises and wild assertions.
[My comment in reply to “geoffmprice May 18, 2016 at 3:53 pm” has gone to the end instead of being in-line]
First off, the claim that the current temperatures are warmer than any temperatures over the last few thousand years has been refuted.
Secondly you are adding proxies with low resolution to modern temperature records with high resolution. An invalid joining to begin with.
Please come back when you can give an honest presentation.
MarkW: “First off, the claim that the current temperatures are warmer than any temperatures over the last few thousand years has been refuted”
Well, Pages 2K is the largest yet done global, high-resolution, multi-proxy reconstruction and it clearly shows that modern temps are warmer than anything in the past couple thousand years, where we saw a slow overall cooling. That’s enough to highlight that Ira’s claims on this are silly. Your personal rejection of evidence and data for whatever reason is likely not relevant here.
geoffmprice writes “Your personal rejection of evidence and data for whatever reason is likely not relevant here.”
Sigh; if only you were the blog owner you could enforce that claim.
But I wonder, if not relevant here, where then it is relevant?
geoffmprice May 19, 2016 at 9:55 am
Pages2K may be the “largest”, but that doesn’t stop it from also being one of the wrongest. There are links there to no less than twenty-seven articles here wherein Steve McIntyre points out a number of its many faults (click on “Older Posts” at the bottom for the rest of them).
If you believe Pages2K it is a sure sign you haven’t done your paleohomework.
w.
Heck, Geoff, I almost forgot my own analysis, called The Pages2K Goatrope. Short version? Pages2K is a joke.
w.
Thanks for the link Willis. Probably needless to say, your article is not particularly convincing. Per the norm, you sound like a non-expert picking out issues and drawing broad conclusions of incompetence without addressing or even cultivating input from the actual experts into your assessments. As these things usually go, if the Pages 2K researchers actually took the time to argue with you on methodology in depth, the discussion would likely end up where they all generally do, right? Meaning, e.g., Goddard does a good job picking out some oddball adjustment in Paraguay and arguing that the temp record is all fraud etc. to wild applause in the anti-AGW bubble, but if you take the time you find out such arguments are (at least in my experience, uniformly) embarrassingly bunk. There is a lot of weakness to operating in a bubble divorced from the actual process the dedicated experts engage in.
Willis says: ” wherein Steve McIntyre points out a number of its many faults”
and Willis also provides a link to his own article.
..
Willis, when are you going to learn that science isn’t done on BLOGS ???
….
Ever hear of “peer review?”
[Note: This “Karl” is a fake; an identity thief. Disregard. -mod]
[Deleted. Site pest/impostor. -mod]
geoffmprice May 19, 2016 at 11:31 am
In other words, you can’t find anything scientific to object to in my post, so instead you attack how I “sound” to you. Who cares how I sound to you? The only useful question is whether my claims are right or not … a question you have not begun to address.
See above. If you had found a real error in my work, you’d have jumped on it and trumpeted it from the rooftops. Since you can’t find any scientific errors, you wave your hands about Steve Goddard. What does Goddard have to do with me? That’s a pathetic puerile attempt at guilt by association.
Sorry, amigo, but you’ve just given us a classic fail, complete with the usual BS ad hominem attempt to throw mud at me and hope some sticks.
And when a man starts throwing mud, to me that’s clear evidence that he’s out of real ammunition …
I gave you my post on the hilarious variations in the data of Pages2K, along with 27 posts by Steve McIntyre pointing out any number of scientific problems with it. If you want to discuss any of the science in those 28 posts I’m happy to do so.
But you whining about how I sound to you? Sorry, but that goes nowhere.
w.
” Pages2K is a joke.”
…
Argument by assertion?
..
FAIL
…
[Note: this was not written by Mr Wundersamer. It is a fake comment posted by an identity thief/site pest. -mod]
Johann Wundersamer May 19, 2016 at 12:21 pm Edit
Johann, I gave no less that 28 citations to back up my statement that Pages2K is a joke … on what planet is a statement with 28 references mere “assertion”?
Nice try, though, it looked all reasonable … but only if you weren’t following the story.
w.
Geoff: CO2 is ghg whose concentration can change independent of temp? So increase in CO2 concentration does NOT mean increase in temp? You sound like a denier! Anyway, we see below your fealty to Pages 2k and multi proxy stuff, are those the “observations” shown on your 2d chart? If Pages 2k and the multis are not on your 1970-present chart, why not? What observations are those, anyway? ‘Cause your chart doesn’t say. On your first chart, is that Marcot shooting up off the chart, way above instrument and everything else on the blade end of your hockey stick? Does that lend it credibility? It’s hard to tell, your charts seem to obscure things. I don’t imagine these comments will get you wondering, since you know so much about the inside of bubbles.
Paul,
“CO2 is ghg whose concentration can change independent of temp? So increase in CO2 concentration does NOT mean increase in temp?”
No, the specific comment here is just that you can’t really change the H2O content of the atmosphere by boiling water and emitting H2O – it will rain out. Consequence of chemistry, thermodynamics of phase change. Atmospheric CO2 on the other hand can be increased in this way, as we’ve shown (having increased the global atmospheric concentration by a full 40%).
“If Pages 2k and the multis are not on your 1970-present chart, why not?”
Pages 2K is a paleoclimate reconstruction. I touched on different topics in my comment, you seem to be confusing them. The paleoclimate chart was a response to Ira’s (obviously wrong/meaningless) claim that warming is just what happens coming out of a glacial/ice age. The 1970-present chart on ocean warming was directed at Ira’s separate but similarly meaningless “models are all failures” comments.
“What observations are those, anyway?”
Cheng et al. 2014, Cheng and Zhu, 2014a/b, Institute of Atmospheric Physics (IAP) historical upper OHC assessment. From the usual ocean temp data: Argo, expendable bathythermograph. (The usual anti-AGW objection is to complain that the ocean is big and we can’t possibly have enough samples so it is purely an accident that the data we have matches what physics and other observations say must be happening… in case you’re not sure what you’re supposed to say in response.)
“On your first chart, is that Marcot shooting up off the chart, way above instrument and everything else on the blade end of your hockey stick?”
No, that’s thermometers i.e. modern instrumental data, as labeled. (Choose your index, they’ll be the same at this resolution.)
” I don’t imagine these comments will get you wondering, since you know so much about the inside of bubbles.”
I am rather curious by nature but no, your comments/questions have not happened to get me wondering about anything.
Geoff, May 20-Well, your post leaves ME curious. Your specific comment still up there, no need for me to quote it, so I’m still curious-if CO2 can go up or down “independent” of temp., what are you warmers so alarmed about? And if I can’t change H2O concentration (I’ll go even further, you can’t change it either), what does change it? Or do you say it’s rock-steady constant? See how curious I am? I’m not confused (and neither are you) by your intentionally misleading charts, we here have seen modern instrument data not merely attached to paleo but used to blot out the tails of paleo. We can’t tell WHAT that line is jumping off the chart, doesn’t it look the same as the Marcott line? Have you looked at what those proxies have done in last 50 (or 150) yrs to see if they follow the instrument data? Or you’re not curious about that, either? So you choose ocean temps as “observations”. I can choose? OK, I choose UAH. Oops, looks like it’s below 99.5% of models. OK, I can choose others, even adjusted surface temp indexes are significantly below model mean (statistics-wise, another area of non-curiousity for you?). Dr. Tisdale’s posts leave me curious about that, not you, though. Folks who read blogs don’t need to be scientists to deconstruct your propaganda, our curiousity is not as limited as yours, evidently.
“I’m still curious-if CO2 can go up or down “independent” of temp., what are you warmers so alarmed about?”
Once CO2 increases in this way, as we’ve experienced in the real world, the CO2 in the atmosphere acts as a greenhouse gas and causes warming. Good for you to ask (though this is pretty basic.)
Do you understand how the greenhouse effect works and what the general scale of it is, or are you in the camp that rejects conventional physics, spectroscopy and thermodynamics on this? Just trying to clarify what it is you are having issues with.
CO2 and temp affect each other, they are actually mutually reinforcing in the longer run under current types of conditions, but they are not essentially immediately tied together in the way H2O is. Emitting lots of CO2 into the air over time drives up the greenhouse effect and temperatures. Emitting lots of H2O in the same way does not. Do you accept this point or have an issue with it? Good for you to keep asking, but for the conversation to be productive you need to be able to reflect the points back, and then to frame your counter-arguments (whatever they are) in a more specific way.
“And if I can’t change H2O concentration (I’ll go even further, you can’t change it either), what does change it?”
Maybe re-read the exchange so far? The temperature of the atmosphere is what changes the concentration of H2O, per Clausius–Clapeyron. Warmer air means more water vapor content (specific humidity). You have likely experienced this directly – notice how warm temperatures near the ocean in the tropics lead to more humid weather. This is why water vapor acts as a massive feedback.
“So you choose ocean temps as “observations”. I can choose? OK, I choose UAH. Oops, looks like it’s below 99.5% of models.”
Sure, you can “choose” according to what you see as politically desirable. But I am “choosing” based on physical logic and a desire to understand what is happening in the climate. Ocean temperatures are the most significant physical observation because some 93% of new heat trapped by the global warming (anthropogenic greenhouse) effect is expected to accumulate in the ocean. This is a consequence of the ocean’s dominating thermal mass in the system – it can just hold a *lot* more heat content. Looking at the ocean always immediately falsifies the claims that AGW isn’t happening as predicted – ocean heat accumulation appears to be generally right on target (actually a bit hot according to Cheng et al) relative to expectations, per the data we have.
Now, you are picking measurements of the troposphere (e.g. 1000m above the ground) presumably because there is wide disagreement among the different methods of measuring temperature there and that gives you more to work with in terms of cherry picking. I assume you mean the unpublished UAHv6, which appears to incorporate stronger use of what Spencer previously called “the old NOAA-15 satellite which has a decaying orbit” and gets cooler trends as a result, showing up at the bottom of this sampling of troposphere measurements (by far the coolest of the active data sets going forward, as RSS 3.3 is being revised to *correct* for that satellite):
https://drive.google.com/file/d/0B_dL1shkWewaYUdhcjdFOFJ3ZTA/view
So, yes you’ve “chosen” the coolest measurement you could find, not because the troposphere is important to measure (it’s not – it holds a small amount of the system energy and is very noisy), but because that’s what you want to see. What significance do you attach to this choice, beyond the utility as a talking point?
Meanwhile I doubt UAH *today* (either version) is below 99.5% of models (assuming you mean model means?) We’re still in El Nino and monthly temp readings have generally been above model means for Feb-April.
“OK, I can choose others, even adjusted surface temp indexes are significantly below model mean (statistics-wise, another area of non-curiousity for you?)”
Well again, not today they’re not; you need to update your talking points for 2016. Here is a recent deeper discussion of surface temp vs. models:
https://tamino.wordpress.com/2016/05/17/models/
In general it is multi-decade trend that is interesting; as the IPCC reported, observations match projections to within about 0.02 deg C / decade even through “pause”. If PDO is switched positive good chance temps will run warmer than projections for a bit, just as they have run cooler in PDO-. If PDO is still negative, temps may drift below model means again.
The combination of the facts that the ocean is warming on target and surface observations today are warmer than model means makes a strong case that global warming is generally on track. Arguing about the details further is a pretty meaningless distraction (though I’m sure we’ll happily do so for another few decades of warming.)
Ask Dr. Tisdale to explain why the El Nino in 2016 hits a temperature peak about 0.4 degrees higher than a similarly sized El Nino in 1998, if there has been “no warming in 18 years”.
Geoff: So you do need it quoted? “Yet more significant to climate because it [co2] is the GHG whose [sic] concentration can change independent of temperature.” You seem to be the one who doesn’t understand your own theory. My issue is that you contradict yourself. The conversation became unproductive, but much funnier, when you entered it with your hockey stick and cherry-picked graphs and smug condescension. What we’ve seen in the real world is co2 up on a straight line while all measurements of temp have bounced up and down, falsifying your theory (but, ironically, agreeing with the quote above, which quoted…you! You’re half as right as a stopped clock!). Is h2o feedback only? Maybe h2o is also a forcing, massive both ways I agree, overwhelming any co2 warming? You chose Cheng’s line as “observations”, accusing me of doing what you’re doing, very progressive. You ask Dr. Tisdale, and I’ll ask Cheng how he’s got 2014 .1 higher than ’98 el nino (he’s got EVERY year hotter than ’98!), and find out if he agrees with your notion that IR captured by co2 (or water vapor) downwells to heat the ocean. Gotta go, you can have the last word if you like. Try to be consistent.
“So you do need it quoted? ”
No. But if you made an effort to understand the points of others, it would give you a chance to raise your own points with some degree of lucidity.
Yes, there are relationships between CO2 and temperature, but that relationship is quite different than that between H2O and temperature. It is a distinction in time – CO2 will affect temperature over time (and vice versa), but the concentration of H2O cannot be driven up independently at all. Unfortunately, it seems a point you are unable or unwilling to grasp (or attempt to argue against).
“My issue is that you contradict yourself.”
I do not, but I understand your confusion.
“What we’ve seen in the real world is co2 up on a straight line while all measurements of temp have bounced up and down, falsifying your theory”
Mainstream theory does not predict a “straight line” of temperature in response to a spike in GHGs. Paul, you are super far from basic understanding of climate science here in imagining that it does. (Yes, I realize you believe that sounds “smug” but that’s a side effect of talking about science. While nowadays everyone wants every opinion to be “equally valid”, even if they are just making it up as they go, that just isn’t how science works. I apologize for the unpleasant existence of empirically verifiable objective reality.)
The surface is affected in particular by large-scale ocean weather patterns like ENSO, which effectively change the rate of heat mixing between ocean and surface, in a cyclical manner. If you want a straighter line of warming in response to GHG increase, you can do one of two things.
(a) look at the continual rise in ocean heat content. The ocean is the big dog, the surface is more of a tail. Nothing wags the ocean (well, major eruptions) so it tends to just consistently accumulate heat content in a greenhouse warming regime.
(b) plot the temperatures of El Nino, ENSO Neutral and La Nina years separately, so you take out the largest complicating cyclical factor in surface temps. Then you see that each of these types of years is warming in much more of a straight line. (This is also why you can’t address the question why the same strength El Nino in 2016 generates such higher temperatures than 1998.)
http://blog.chron.com/climateabyss/2012/04/about-the-lack-of-warming/
Let’s go ahead and leave it there.
“find out if he agrees with your notion that IR captured by co2 (or water vapor) downwells to heat the ocean”
For the record, downwelling IR (from greenhouse) acts more like insulation – the net flow of IR is from the ocean upward but the downwelling IR effectively slows that energy flow. This allows the *sun* to add heat to the ocean (as the ocean is not cooling itself off as fast). A common error there to forget the (rather large) role of the sun.
All of which brings us back to the top of the discussion so a fine place to leave things. Cheers.
Paul Courtney says:
The conversation became unproductive, but much funnier, when you entered it with your hockey stick and cherry-picked graphs and smug condescension. What we’ve seen in the real world is co2 up on a straight line while all measurements of temp have bounced up and down, falsifying your theory (but, ironically, agreeing with the quote above, which quoted…you! You’re half as right as a stopped clock!).
True dat.
The modern warming spike is artificial, there is no planetary change in atmospheric conditions caused by humans, just deceitful humans trying to control human behaviour, that’s the story of political science.
“The modern warming spike is artificial, there is no planetary change in atmospheric conditions caused by humans, just deceitful humans trying to control human behaviour, that’s the story of political science”
I’m familiar with such conspiracy theories (obviously). It’s just not a view grounded in empirical reality. There is in fact a planetary change in atmospheric conditions – an unambiguous 40% increase in the global concentration of CO2, unprecedented on geological timescales. The greenhouse effect is real and directly observed and not disputed by even the most extreme anti-AGW partisans in science.
Yes, I hear that you are a greenhouse denier. I know this is still an active internet subculture. Sounds like you are from the “it’s all about pressure” splinter of that particular fringe camp. A planet with a dense atmosphere floating in the void of space with no sun shining on it will be dead cold, despite its high-pressure atmosphere supposedly doing work in your ‘alternative’ thermodynamic model.
geoffmprice,
I’m a what??
Is that how your twisted ideas gets accepted? you’re in the business of false affirmation, no one accepts your idea so you seek to belittle anyone who disagrees with you, nice try dipstick but you’re talking to me, and your comment is vile and disgusting on levels you couldn’t imagine, so f*k off with your fake conspiratorial nonsense, you moronic fool.
You believe that temperature is rising on a planetary scale, and the cause is humans, because of Carbon dioxide, you’re an Imbecile of the highest order among some pretty tough competition, well done you.
Ira, thanks for the interesting analysis. I followed you up to the end, where you say:
I don’t see how you can calculate the effect of that amount of cooling on the surface temperature. You are completely correct that the amount of energy is small in global terms. But the effect on the climate system is far less clear.
Here’s how I’d express it:
There are 213 gigatonnes / year of ice melt.
It takes 330 megajoules / tonne to melt ice, which means there are
7.0E+13 megajoules / year required to melt ice.
Now, we have 5.1E+14 square metres earth surface, which means that melting the ice requires
0.14 megajoules / year / square metre
We can convert this using the fact that 1 megajoule / year / square metre = 0.032 watts / square metre on a constant basis.
This means that the effect of the melting of the ice is
0.004 watts / square metre
By comparison, we have a global 24/7 average of 500 watts / square metre downwelling radiation at the surface … so the ice makes a change of 0.0009% in the surface radiation balance. As you say, it’s too small to matter in regards to the global energy flow.
My best to you,
w.
So why do most balances show 340 W/m^2 ToA?
Mankind’s alleged atmospheric CO2 power flux (watt is power, energy over time) increase between 1750 and 2011, 260 years, was 2 W/m^2 of radiative forcing. (IPCC AR5 Fig SPM.5) Incoming solar RF is 340 W/m^2, albedo RF reflects 100 W/m^2 +/- 30 (can’t be part of the 333), 160 W/m^2 reaches the surface (can’t be part of the 333), latent heat RF from the water cycle’s evaporation is 88 W/m2 +/- 8. Mankind’s 2 W/m^2 contribution is obviously trivial, lost in the natural fluctuations.
One popular GHE theory power flux balance (“Atmospheric Moisture…. Trenberth et. al. 2011 Figure 10) has a spontaneous perpetual loop (333 W/m^2) flowing from cold to hot violating three fundamental thermodynamic laws. (1. Spontaneous energy out of nowhere, 2) perpetual loop w/o work, 3) cold to hot w/o work, 4) doesn’t matter because what’s in the system stays in the system) Physics must be optional for “climate” science. What really counts is the net RF balance at ToA which 7 out of 8 re-analyses considered by the above cited paper concluded the atmosphere was cooling, not warming. Of course Trenberth says they are wrong because their results are not confirmed by the predicted warming, which hasn’t happened for twenty years.
“Temperature drives pressure theory” nice!!
Pressure differences drive temperature.
Nicholas Schroeder May 18, 2016 at 5:19 pm
Good question, Nicholas. The 340 W/m2 is TOA solar radiation. However, only about 170 W/m2 of this sunshine reaches the surface. There is also about 330 W/m2 of downwelling longwave radiation.
This gives a total downwelling radiation at the surface of about half a kilowatt per square metre as a 24/7 global average, although obviously anhy given area gets more or less.
w.
“There is also about 330 W/m2 of downwelling longwave radiation.”
Per my comments above I consider this a violation of thermodynamics. Since all of the ebbs & flows are accounted for, this 330 W/m^2 has to appear out of nothing (strike 1) and cycle in a perpetual loop without additional work (strike 2) from cold to hot without additional work (strike 3). Some of the power flux balances I pulled off the internet don’t show this loop, i.e. failed consensus.
If you apply S-B to that down welling radiation at -40 F or C with an emissivity for atmospheric gasses/CO2 of 0.3128 the W/m^2 result is negligible. (Nasif S. Nahle – “Determination of the Total Emissivity…”
I know this ground has been plowed, horse has been beaten, but I’m not satisfied with the answer.
Also as I mentioned above what happens in the system stays in the system and all that counts is the balance at ToA. If more leaves than enters, cooling results. That’s what 7/8 studies in Trenberth’s 2011 Figure 10 showed. And CO2’s 2 W/m^2 is trivial. That balance is controlled far more by albedo and other stores/releases than CO2.
Nicholas Schroeder May 18, 2016 at 6:43 pm
Fortunately, thermodynamics is not bound by your opinion. Scientists regularly use instruments to accurately measure the amount of downwelling radiation from locations all over the planet. You can explain that measured radiation in different ways, but waving your hands won’t make the scientists and their measurements suddenly disappear. The radiation is measurably there, regardless of your beliefs.
In other words, you get to have your own theories, but not your own facts.
Here are two of my posts that show how the poorly-named “greenhouse effect” works. There is no violation of the second law, all heat flows from warmer to cooler. Turns out you don’t need CO2 or even an atmosphere. Check it out:
The Steel Greenhouse
People Living in Glass Planets
My best to you,
w.
IMHO this popular GHG perpetual motion heat loop contradicts hundreds of years of thermodynamic theory. Extraordinary claims require extraordinary evidence. If CO2 & GHGs have such impressive thermal properties, greenhouse operators would increase the CO2 concentrations to save on their heating bill (no evidence of that) as well as improve crop yield (plenty of evidence of that).
I’ve used IR thermometers and cameras in industrial settings. There is more to an IR instrument than point, read, and figure S-B. My impression is that the instruments are being improperly applied and interpreted.
The S-B equation including grey body emissivity results in negligible radiation returning from the inside of the shell. The energy available for radiation is what’s left over after T+A+R = 1, .e.g. for GHGs transmission 95% / absorption 5% / radiation 4%. Since most of the LWIR leaving the earth’s surfaces passes right through the GHGs there is little absorbed, little radiated and a resulting low emissivity. This shell concept is as flawed as the GHE & blanket. As I mentioned elsewhere removing this 330 W/m^2 loop changes nothing at the ToA.
I think a better analogy is the walls of a house. If I increase the insulation on the house the rate of heat loss decrease per Q = U * A * ΔT. The furnace firing rate also decreases as does my monthly bill. However, if the furnace fires at a fixed rate (ASR) and U goes down ΔT must increase to move that same Q through the thicker insulation. So what to do? Well, open a window or door, turn on the air conditioner, etc. There is not a thermostat on the sun, but there is certainly one on the atmosphere: water vapor. (See Jo Nova’s handbooks)
Disputing this GHG loop concept is not denying the greenhouse effect/principle/process. A greenhouse operator can increase thermal mass by installing boxes of rocks, trombe walls, black painted plastic tubes and barrels full of water or eutectic salts, aka the oceans.
If it gets too hot the operator can pull down reflective shades reducing the incoming heat, aka albedo which is more than just clouds. BTW IPCC AR5 credits clouds with -20 W/m^2 of RF and that’s a lot more cooling than CO2’s 2 W/m^2 of heating.
The operator can turn on misting water sprays and evaporative cooling to reduce the air temperature and raise relative humidity, aka storms, rain, snow, etc.
Both IPCC and Trenberth (same as IPCC) admit they really don’t understand the water vapor cycle, clouds, etc. very well, IPCC AR5 in TS.6 and Trenberth in the papers mentioned earlier.
1) The CO2 increase between 1750 and 2011 amounts to a 0.5% fluctuation in the overall global carbon balance. When the uncertainty in the origins of the carbon balance is +/- 850 Gt, 1,750 Gt band, it’s strains belief that 0.5% can be measured let alone attributed to any particular source. C13/C12 changes over 261 years have to be detected at ppm levels. Pretty unlikely.
2) At 2 W/m^2 RF CO2’s role in the greenhouse process is insignificant.
Nicholas Schroeder May 19, 2016 at 8:08 am
In your humble opinion? Reminds me of Churchill, who allegedly said of someone:
I gave you two good clear explanations of how the so-called “greenhouse effect” works, including why it doesn’t break any laws of thermodynamics. Instead of coming back and telling me exactly where my explanation is incorrect, you’ve come back with your “humble opinion”.
Pass … you can lead a horse to water, but you can’t make him think.
w.
http://claesjohnson.blogspot.com/2011/08/who-invented-downwelling-longwave.html
“We find support to our claim that DLR and backradiation is fictional without physical reality, and thus that an essential component of the greenhouse effect is fiction and not physics.
DLR thus appears to be a recent man-made invention, and so the greenhouse effect of CO2 alarmism.
It is remarkable that several governmental agencies base their whole existence on measuring DLR/backradiation, which may not exist. This shows the strength of tax-financed science which can freely invent to measure anything, fiction or reality does not matter as long as numbers, tables and movies are produced according to the principle:
•the more fictional
•the more difficult to measure
•the bigger institute.”
And:
http://www.drroyspencer.com/2010/08/help-back-radiation-has-invaded-my-backyard/
@Nicholas
I share your frustration with this fictitious 330 W/m2 of heat transfer from the atmosphere to the surface. This would require the earth’s surface to serve as a heat sink for a cold atmosphere.
How can space and the surface be a heat sink for the atmosphere which has no heat source?
How much colder is the atmosphere after it warms the planet below?
These posts by Roy Clark do a fantastic job of laying bare the fallacies of the Trenberth energy budget.
Climastrology is inventing the 330 DWLIR figure as a fudge against an average thereby avoiding the importance of time and latency.
https://tallbloke.wordpress.com/2012/03/21/roy-clark-where-it-all-went-wrong-with-climate-science/
http://www.venturaphotonics.com/ClimateFraud.html
Someday this GHG theory is going to be read its last rights.
@Willis
Over 1000+ Wm2 reaches the surface in the tropics, penetrates at depth, and it hits a substance that is extremely adept at retaining that heat. The TOA releases 240 Wm2 across the sphere, but 170 Wm2 for average reaching the surface simplifies a dynamic process in a non-physical way.
Willis: THANKS for your comment and your analysis. We agree that the Global Ice melt, even if it averaged a bit over 200 Gt annually since 1970 (which is uncertain) has not had any significant effect on global energy flow.
I follow all of your WUWT postings and read most of them completely through. Despite (or perhaps because of) your lack of formal scientific educational certification, you have a canny ability to penetrate to the core of climate science.
You have “been there and done that” in the real world. You write clearly and honestly. You prove the maxim, (“Don’t let school interfere with your education!” :^)
Your seafaring adventures, both past and recent, have transported me to places and situations I can only enjoy vicariously, but which never-the-less give me much pleasure, and only second-hand pain and discomfort.
Ira
Ira, many thanks for your kind comments about my writings. My target audience for my scientific work is the person I call the “literate layman”. To me this means someone who is educated but not necessarily in science, who may not be real comfortable with math, and who is curious about the world and its mysteries.
Climate science, by its very nature, requires a different writing style than other disciplines. This is because there are at least six complete and separate sub-systems to the climate: atmosphere, hydrosphere (ocean, lakes, and rivers), lithosphere, cryosphere, biosphere, and electrosphere. So it’s not like say some part of physics, where everyone involved is a physicist and speaks physics. In climate science, we have oceanographers and atmospheric chemists and tree-ring specialists and remote-sensing experts … so you can throw away all the specialty stuff, only one person in ten would understand it.
Next, I make up rules of thumb, they are valuable guidelines. One of my rules of thumb is that every number I put in my text costs me a reader. Seriously. Many people are quite math-averse. So I try to tell the story in such a way that the math is kind of secondary. Don’t get me wrong, the math is always central and critical. I just work at telling a story that is supported by the math, rather than the usual scientific method of having math tell the story.
Finally, to structure my documents, I think about the elevator speech and the matchbook speech. The elevator speech is the speech you’d give if you had the length of an elevator ride to convince the hearer of your claims. You get in on the first floor with someone, and you have until the 25th floor to explain your ideas. You need to boil your ideas down, over and over, until they fit into a few paragraphs.
The matchbook speech is the same, but you need to be able to write it on the cover of a matchbook. It’s tougher, instead of paragraphs you need to boil your ideas down to a few sentences.
Once I’ve done that, boiled my ideas down, the rest is pretty easy. The one caveat I’d put on it is that I’m incredibly fortunate in that I’m free of deadlines, or any “publish or perish” pressure. So I can apply another of my rules of thumb, which is to only write about something when I can’t stand not writing about it …
Regards,
w.
To respond to your comments above Willis:
“In other words, you can’t find anything scientific to object to in my post”
Oh, the post is unimpressive right from the opening. Your main point seems to be to dispute Evans’ claim that “Today, the Earth is warming about 20 times faster than it cooled during the past 1,800 years”. You look for this in the older paleo data, which seems ludicrous: “The change from 1700 to 1900 is not anywhere near 20 times as steep as the drop from the start of the study to the present”. Evans is clearly comparing *modern* warming (last century) to the warming of the past 1800 years. The data unambiguously supports his comment. That you think he means the proxy data from 1700-1900 is your strange non sequitur. He said “today”, by what strange perspective is 1700-1900 “today”?
Your next point is that you think the data for the Indian ocean looks flat, and that this also contradicts the claim. Yet the oceans are obviously warming today, quite steep relative to that flat trend from previous millennia. These comments don’t seem to make sense, and as a result this doesn’t encourage me to dig a lot deeper into the post.
Understand the cultural gap here: I’m a skeptic, used to scientific method. “Blog auditing” as popularized by gentlemen like Mcintyre (http://www.shapingtomorrowsworld.org/news.php?p=5&t=209&&n=159#674) is not a normal part of the scientific process. For clear/valid reasons. It’s not easy to parachute into complex areas of science, pick some bits out and claim you’ve shown it’s all nonsense. Much, much easier to *convince* yourself you’ve done this. Indeed, the custom in blog auditing is to resist checking your criticisms against the actual experts, and to actually spin this as a virtue (of independent thinking)! This is fundamentally pretty alien to the normal scientific process.
If you are honest, you could concede that by *far* the most common result of such ‘blog auditing’ is that the author just flatly fails to understand something in published work. In rare cases, the blog auditor is successfully nitpicking something that is genuinely a weak point of some kind, but wildly exaggerating the significance of the issue. Now, is there a set of cases where the blog auditor really has proven that widely scrutinized and endorsed science like Pages 2K is “garbage”? I’ve dug deep into many such claims over the years, often doing the homework that you don’t seem to want to do yourself (i.e. contact the dedicated experts and ask them what they think about the criticisms) and the results have not been pretty, to put it mildly. I can’t say I can name a case where a blog auditor has truly shown that some major emperor of mainstream science “has no clothes”.
If blog auditors such as yourself were tearing giant holes in prevailing scientific knowledge as you claim, I still believe you would fare much better in publishing these criticisms. I know you might disagree, claiming there is suppression/conspiracy against contrary views. But you only have to look at the most celebrated cases like Wahl & Ammann 2007 (and the endless subsequent reproduction of MBH general results) for an example of how Mcintyre type auditing tends to fare on the normal playing field of peer review.
Cheers, again genuinely appreciate the link and that you’ve made an effort to engage with real data.
geoffmprice says “claiming there is suppression/conspiracy against contrary views.”
The RICO 20 and Shukla’s letters seem to fall squarely into that category. Obviously it is no longer a conspiracy since it is no longer secret.
Michael 2 writes “The RICO 20 and Shukla’s letters seem to fall squarely into that category”
No, that doesn’t fall squarely into the category of suppression of peer review research. RICO can only apply to an organization knowingly defrauding the public, customers or regulators in some way, which is clearly the intent of the letter you’re referring to.
geoffmprice “No, that doesn’t fall squarely into the category of suppression of peer review research.”
Say what? When did this conversation suddenly become about suppression of peer review research (research into peer review?)
“RICO can only apply to an organization knowingly defrauding the public, customers or regulators in some way, which is clearly the intent of the letter you’re referring to.”
Yes, exactly. In this case the 20 signatories of the Shukla letter and more recently the cabal of state attorneys general. RICO may well be appropriate, but against the originators of this adventure.
Your earlier comment, since you seem to have forgotten it, was “I know you might disagree, claiming there is suppression/conspiracy against contrary views.”
Let me emphasize the object: contrary views. What might those be? Certainly not the 97 percent! How can 97 percent be contrary? Suppression of “contrary views” must necessarily therefore be any of several minority views, namely, that global warming is not necessarily dangerous, not entirely human caused, and/or maybe doesn’t exist outside of normal climate variation.
The list of attempts to silence skeptics is enormous. In the following, notice the frequent hatred and suggestions of violence that the TBW’s (True Believing Warmists) have for skeptics.
Some contrary views being suppressed by organizations meeting, sometimes secretly, for this purpose:
Dem AG Targets 90 Conservative Groups in Climate Change Racketeering Suit. [http]://freebeacon.com/issues/dem-ag-targets-90-conservative-groups-climate-change-racketeering-suit/
Quote: Walker’s subpoena is part of a coordinated effort by Democratic attorneys general spearheaded by New York’s Eric Schneiderman and undertaken in consultation and cooperation with leading environmental advocacy groups. The participants huddled at a Jan. 8 meeting at the headquarters of the Rockefeller Family Fund, a left-wing foundation. At the meeting, RFF, Greenpeace, other environmental groups discussed ways to “delegitimize [ExxonMobil] as a political actor,” “force officials to disassociate themselves from Exxon,” and “drive divestment from Exxon,” according to a copy of the meeting agenda obtained by the Washington Free Beacon last month.
Unquote.
Bill Nye: Throw ‘climate deniers’ in jail [http]://redalertpolitics.com/2016/04/14/bill-nye-throw-climate-deniers-jail-video/
October 15, 2015 In UK, Judges Propose Making It Illegal to Utter Any Statement Denying Global Warming
[http]://ace.mu.nu/archives/359537.php “‘The most important thing the courts could do,’ he said, was to hold a top-level finding of fact, to settle these scientific disputes once and for all: so that it could then be made illegal for any government, corporation (or presumably individual scientist) ever to question the agreed science again.”
Dem. Congressman on Witch Hunt Against Climate Scientists. “Roger Pielke Jr. … reveals that he was one of seven academics being being investigated by Rep. Raul Grijalva, the ranking Democrat on the House Committee on Natural Resources.”
[http]://www.weeklystandard.com/article/rep-raul-grijalvas-shameful-witch-hunt-against-climate-scientists/866050
“Daily Kos Editor Says Skeptics Should Commit Suicide” [http]://canadafreepress.com/article/daily-kos-editor-says-skeptics-should-commit-suicide “Former Washington Post reporter David Weigel was recently fired from the paper for privately writing on the Journolist listserv that Matt Drudge should ‘… set himself on fire.’ “
geoffmprice – your first graph is dodgy, because it splices higher-resolution data onto lower-resolution data. IOW, the pattern shown in the higher-resolution data may well have occurred in the past, but the past data is too low-resolution to be able to show it. Perhaps a better graph would be this one …
http://climate4you.com/images/GISP2%20TemperatureSince10700%20BP%20with%20CO2%20from%20EPICA%20DomeC.gif
… but you still can’t ‘legally’ splice the last few decades onto it.
PS. The “multi-proxy” reconstruction from Marcott et al, complete with “hockey-stick”, as shown in your graph – could be bogus:-
http://www.c3headlines.com/2013/03/the-marcott-science-hockey-stick-blade-fiasco-audit-mcintyre-bogus-data-manipulation.html
“The Marcott-‘Science’ Hockey Stick Fiasco: Audit of New Study Proves Bogus Data Manipulation“
Yes, that is a single ice core graph. It is clearly not a ‘better graph’ for purposes here, being a single type of proxy from a single location (topic is global warming), though it is clearly pretty consistent with the graph I linked. Yes, it is fine to highlight resolution differences in the older data but that’s not the topic, the topic is Ira’s claim.
No, it’s not very likely that planet-wide energy changes of the magnitude currently being seen are hiding in the ~300 year seams of the older Marcott reconstructions, but sure, you can cling to that. We know about Dryas type events that seem to be circulation related.
The Pages 2K portion (which reproduces both Marcott, original MBH and all the others) has higher resolution (~30 years?), and that segment is sufficient to reject Ira’s claim that current warming is ‘just what happens coming out of an ice age’. Why would you defend such claims? You appear to know better.
I expect the breathless blog expose of fraudulent data manipulation is about as reliable as all the other blog pages claiming climate data is a result of conspiracy, despite results like this continually getting reproduced by independent international efforts, and the fact that individual claims of “fraudulent data” have continually turned up nothing for a couple of decades, certainly including the original hockey stick controversy.
“Hockey stick” just comes from two facts clearly and redundantly shown in data/evidence: general flattish, slow cooling of Holocene past ~6K years followed by a sharp modern warming spike, which we’ve directly measured with thermometers and satellites. But again that’s not the topic here.
Relying on Pages 2k, Marcott and MBHahaha instead of one ice core that has not been debunked; tying instrument record apples onto (debunked) multi proxy oranges; bad-mouthing WE’s one article while ignoring his 27 others. Smells like teen CliSci, fer sure.
Oh, now there’s a surprise.
Someone posting the Alley graph of GISP2 ice-core proxy temp data that shows the end date as present – when in fact it is 1855.
That this is so is stated on this very website …
https://wattsupwiththat.com/2013/04/13/crowdsourcing-the-wuwt-paleoclimate-reference-page-disputed-graphs-alley-2000/
Also:
The surrent atmospheric concentration of CO2 is ~400ppm.
That graph shows it at pre-industrial levels of ~280ppm
This is how those graphs (no attribution but they are from the climate4you website) would look if updated to present:
http://www.skepticalscience.com/pics/c4u-chart5.png
Oh lord not again.
You can’t legitimately take a highly smoothed time-series graph “to present”.
If there was enough data for the GISP2 ice core proxy graph to be at the equivalent resolution of say HadCRUT3 it would look a lot busier with much higher peaks and lower troughs.
Adding the CO2 spike simply illustrates how ineffective CO2 has been as a temperature forcing factor.
“Adding the CO2 spike simply illustrates how ineffective CO2 has been as a temperature forcing factor.”
No it (and it was meant to) simply illustrates that *sceptic* mythology continues to have a life of it’s own once created.
Also, no, one wouldn’t expect that that graph would “illustrate how ineffective …..”.
Anthro CO2 has only had a forcing effect since around 1960 (outweighed by aerosol until then) and this is a single site on a graph covering millennia with many local variations likely to have occurred in wind/ocean circulation.
Putting it another way:
So you’d expect to climatic swings in temperature ~3C to be reflected elsewhere on the globe? and for it to be representative of a global climatic shift even?
Precisely – and neither would anyone expect the last ~50 years of warming to be evident there, given the over-riding climatic variability evident in the extreme location.
Toneb says:
Someone posting the Alley graph of GISP2 ice-core proxy temp data that shows the end date as present – when in fact it is 1855.
OK then, here’s a chart with a very recent splice:
http://oi53.tinypic.com/sg2wav.jpg
As we see, current temperatures are still far below those earlier global warming events — which all occurred when CO2 was much lower, thus debunking the alarmnist crowd’s CO2=cAGW nonsense.
“As we see, current temperatures are still far below those earlier global warming events — which all occurred when CO2 was much lower, thus debunking the alarmnist crowd’s CO2=cAGW nonsense.”
If you stay so db…
Then it must be true.
Never mind the worlds experts eh?
So, you would accept that there have been variations in temperature throughout the the Earth of the order of 3C over a few hundred years?
Where is the evidence of this other than at this one (immensely extreme location).
Who climate has a as THE major influence the ocean currents and wind regime.
Think AMOC and NAO.
But then that would be science eh db?
And god forbid that the experts know more than you.
After all you get yours from *sceptic* blogs don’t you?
The font of all scientific truth. (sarc)
your first graph is dodgy, because it splices higher-resolution data onto lower-resolution data. IOW, the pattern shown in the higher-resolution data may well have occurred in the past, but the past data is too low-resolution to be able to show it. Perhaps a better graph would be this one …
… but you still can’t ‘legally’ splice the last few decades onto it.
Well the last 16 decades anyway since the last ~160 years are missing. In the vicinity of that ice core the temperature has increased by ~1.5ºC during that time. The most recent GISP2 data has a time resolution of ~6 years.
Mike Jonas,
Personally, all I need is to see this bogus chart to know that Marcott et. al is trying to sell us a pig in a poke with this splice:
http://www.realclimate.org/images//Marcott.png
That’s not even a hokey stick. That’s a 3-stage atomic powered skyrocket!
Also, splicing on recent temperatures (as recently as 2009, per the graph) the current global warming still doesn’t come close to natural global warming events during the Holocene:
http://oi53.tinypic.com/sg2wav.jpg
Since past global warming events happened before human CO2 emissions could have had any effect, what is the explanation for those obviously natural warming episodes?
8000 years of exactitude around a variance that hit .4 degrees at the most convenient time to make the point! A degree of certainty that could land a lesser person in the loony bin for delusions of grandeur! I’ve got an idea! Let’s wreck the world’s economy based on this piece of artwork. The hubris is stunning!
LOL, they got to get this guy and Bill Nye together! Now the earth is like a glass of cold water! Maybe if they bubble heated CO2 through the water under a heat lamp they can prove it warms faster and make a video of it for school children.
There are times when the argument becomes so STUPID you just have to laugh it off.
lmao
Ira – I appreciate the analysis. You express concern over the fact that so many people seem to accept without question the premise that global warming is/must be human caused. I believe the following to be true: The human ego is strong and large and subject to being self inflated. Many many otherwise very intelligent citizens are told often, and therefore believe, that they (we) can do ANYTHING! This seems to include materially changing the earth/solar system/universe. Our popular entertainment and media constantly reinforce this theme (sci-fi is really good at this). Very very few outside the engineering field have any appreciation have any idea just how much ENERGY substantial changes need and how difficult it is to obtain and control that energy.
Until that fact is understood at a fundamental level the phrase “we can do ANYTHING” will continue to be widely believed.
NO ONE lies to hear ‘NO YOU CAN’T but it is true. We really cannot change the weather or the climate.
People have been changing the weather for hundreds of thousands of years, it’s true, people have been around throughout Ice ages and whatever else they observed and survived through, they changed the weather, they burned witches alive and committed genocide, people have ripped out and held freshly beating hearts to appease one thing or another, why not do a rain dance? the pattern of utter ignorance and stupidity has left a trail throughout history, why on earth would anyone suspect that cats ‘n dogs are causing man made something or other?
They don’t, people are liars, criminals and opportunistic to the point of murder, there is nothing more frightening on earth than a person. (except spiders, wriggly things, the unknown and death) Always remember that!
If we agree that looking at the ice caps melt is more indicative of global warming than measuring temperature, are we not then saying that the climate models some of us worship are a total waste of time?
Send half the climate scientists to the Arctic to measure that ice. Send the other half to the Antarctic to measure that ice. Pick them up in ten years and compare. then swap pole for pole and try again.
“HOWEVER, warming is mostly natural and due to Earth’s recovery from the depths of the last ice age, some 18,000 years ago.”
This isn’t correct Ira. We’re in an overall cooling phase since the Holocene Climate Optimum, prior to plunging into something that will likely be enormously disruptive for humanity.
I think you meant “the little ice age”.
philincalifornia: Depends upon your perspective. Yes, there has been a modest net warming pattern since the Little Ice Age of the 16-1700s (as you point out). But, there was a more modest net cooling pattern since the warm 1930s, followed by a modest net warming since the coolish 1950-60s.
But, as I step back and look at the ice core data of the past 400,000 years or so, I see four remarkably similar saw-tooth patterns, each about 100,000 years long. Each features a rapid (if you can call a few thousand years “rapid”), nearly monotonic rise to a rather pointy peak (or a couple of ups and downs with multiple peaks), followed by a less rapid, non-monotonic decline over a several thousand year period, and then a jig-jaggy up and down decline to the depths for the balance of the ice age.
The most recent depth was reached around 18,000 years ago. Since then, there has been a relatively rapid, nearly monotonic rise that has not yet (perhaps never will) reached the height of the past three peaks. Unlike the previous rather pointy peaks, the current near-peak has jig-jagged up and down for the past 10,000 years, or so.
You look at this data and conclude, possibly correctly, that we have already reached the peak (even though it is not yet as warm as previous peaks) and should expect a plunge “into something that will likely be enormously disruptive for humanity.”
I look at the same data and conclude, possibly correctly, that we have not yet reached the peak, and should expect hundreds of years, or a couple thousand, of relatively small ups and downs, but mostly ups, until we reach the “real” peak and then plunge once more to the depths.
We won’t know until it happens, probably after we the living are dead and buried, but don’t we all hope I’m right?
Ira
“Ingenious or Misleading Rationale for the “Pause”?”
How about a third choice – “absurd”?
There has been ice all along. So why hasn’t there been a pause all along? Seems like a fundamental flaw to me.
“Yes, the Atmospheric “Greenhouse” effect is real. It is responsible for the Earth being about 33⁰C (60⁰F) warmer than it would be absent “Greenhouse” gasses in the Atmosphere.”
Not exactly. This is the case between the LTE EQUIVALENT 255K emission temperature of the planet and its 285K average surface temperature. However, the same GHG’s that cause this warming are also causing cooling via reflection from ice and clouds. As I consistently try to point out, the effects of water vapor extend far beyond its nature as a GHG.
The planets intrinsic albedo (minus ice and clouds) is closer to 0.1, thus the incident energy and emissions would be 307 W/m^2 corresponding to a temperature of about 271K. So while the GHG’s increase 255K up to 285K, the influence of ice and clouds consequential to these same GHG’s reduces 271K to 255K. The NET warming from GHG’s (which must include water vapor) is only 14C and less than half of what is consensually stated.
YES! You’re the 2nd person I’ve seen (besides me) point this out. Most of the 0.31 albedo is due to white clouds, which are a reaction to incoming solar and the presence of water – part of the feedback. I used 0.15 as the base, to include some haze, which makes the GHE about 20°C, not 33°C. A very important, but conveniently ignored concept! Conventional climate science is backwards. Albedo is not fixed, it rises with temperature, causing cooling, and declines with cooling, causing warming. Its level is determined by the properties of water, which aren´t going to change anytime soon. More warmth below (especially oceans), more clouds. Less warmth, fewer clouds. This is the main driver of the fact that actual sensitivity as measured by ocean warming is only about 0.25 * the expected 1.2°C per doubling.
Michael,
“More warmth below (especially oceans), more cloud.”
It’s not this simple. More warmth means more water vapor which means more clouds, but what’s increasing from 0C to 30C is the cloud volume, not the amount of surface covered by clouds. It’s not until evaporation starts to increase exponentially above about 30C that cloud area starts to increase again. At the 0C isotherm where snow/ice is ebbing and flowing, the sensitivity is significantly larger and often incorrectly extrapolated to the rest of the planet.
I say increases again, because below 0C, the surface area covered by clouds also increases as the temperature increase. The reason for the inflection point at 0C is that clouds reflect the same as surface ice and snow, so the cooling (often incorrectly referred to as negative feedback) from increased reflection is absent. Interestingly enough, the inflection point at 30C is also a consequence of a negative feedback like effect. This time it’s caused when incremental evaporative cooling completely offsets the heat arising from incremental solar input and contributes to establishing a maximum temperature for the surface of the oceans before Hurricanes can form owing to massive amounts of atmospheric water vapor.
This plot show this behavior in no uncertain terms.
http://www.palisad.com/co2/sens/st_ca.png
Many more plots demonstrating this, along with an explanation of what’s being plotted and plots of the sensitivity of many climate attributes to various others can be found here:
http://www.palisad.com/co2/sens
We’ve been bouncing around in a cooling trend for about 35 million years, since Antarctica got stuck down at the South Pole. The current warm phase has lasted about 12,000 years, with warmer and cooler periods, and I think it is very pleasant but it is unlikely to last.
Geological and glaciological history suggests we should know where we have stored our coats
Another fine contribution by Ira Glickstein, PhD. Many thanks!
Ira says, “The most likely explanation is that their climate theory is either incomplete or totally wrong, so their models failed.”
This is consistent with Ray Bätes’s claim in a recent paper.
Quote, “A major current issue in climate science is that, despite the considerable progress that has been made in the development of global climate models (GCMs), it has not proven possible to narrow the uncertainty limits of 2 × CO2 equilibrium climate sensitivity since the Charney Report [1979]. Recently, it has been seen necessary to widen these limits, with Intergovernmental Panel on Climate Change (IPCC) [2013] giving a probable range of (1.5, 4.5)°C as compared with the IPCC [2007] range of (2, 4.5)°C.
…
The central conclusion of this study is that to disregard the low values of effective climate sensitivity (˜1°C) given by observations on the grounds that they do not agree with the larger values of equilibrium, or effective, climate sensitivity given by GCMs, while the GCMs themselves do not properly represent the observed value of the tropical radiative response coefficient, is a standpoint that needs to be reconsidered.”
Source: J. Ray Bätes, Estimating Climate Sensitivity Using Two-zone Energy Balance Models, 2015.
http://onlinelibrary.wiley.com/doi/10.1002/2015EA000154/pdf
Comment: As I understand it, the reason for the lack of convergence among models is that modelers cannot agree on the role of clouds, specifically the feedbacks.
However, the role of clouds in modulating albedo (reflectance) may also be underestimated by GCMs. (I cannot locate the reference, but I recall a critical claim that the GCMs all use the same value for Earth’s albedo, fixed around 0.30.)
Pallé et al, in a series of studies have shown that this assumption is not tenable.
Source: Pallé, E., et al. “Earth’s albedo variations 1998–2014 as measured from ground‐based earthshine observations.” Geophysical Research Letters (2016).
http://arxiv.org/pdf/1604.05880.pdf
While I maintain a skeptical view of the claims of cosmo-climatologists, their focus upon the cloud-albedo relationship seems to me to be so much to the point that we should keep up to date with developments in this countervailing theory of climate change.
Frederick: Yes, right and right! I think climate sensitivity to doubling CO2 will turn out to be closer to 1 C than to the average of the current IPCC estimate, 3 C. Also, while nighttime clouds do increase warming by absorbing long wave radiation from the surface, heating up, and then emitting long wave radiation towards the surface, it will turn out that daytime clouds generally cover more area than nighttime, and, by reflecting short wave radiation back out to space (increasing albedo), provide way more cooling to more than make up for nighttime warming.
Ira
If earth emitted as much as it absorbed, there would be flipping life on the planet
Mark,
There would be NO life on the surface since photosynthesis converts some of the incident energy into the chemical energy in sugar, upon which all other life depends (excluding life near deep ocean vents).