Forget homogenization, that is so 2010. If the pause is bothering you and your belief is that there must be more warming, we only need to find it in the data, then what you need is “Karlization”, named after director of the National Climatic Data Center, (now NCEI) Tom Karl who pulled a fast one this summer trying to adjust the past down, so the present would be warmer. The sleight of hand on this was so obvious that even warm-oriented scientists such as Michael Mann and Ben Santer co-authored a rebuttal paper that said Karl was dead wrong and the pause was real. There is now a congressional investigation into Mr. Karl’s apparently political actions disguised as science
Now we have a new player in the “Karlization” process – Carl Mears, who is the chief scientist for RSS (Remote Sensing Systems) in Santa Rosa, CA. This is a private business that just happens to make a satellite based climate data set that is similar to the UAH satellite data set produced by Roy Spencer and John Christy. For years, the RSS data set showed very little warming, and on the RSS web page they were so bold to say:

Source: http://www.remss.com/research/climate Archived here – http://www.webcitation.org/6fiQcrQDQ
All that is about to change. Readers may recall a video produced by the execrable “Climate Crock of the Week” activist Peter Sinclair that we covered here where the basic premise was that the “satellites are lying“. It seems to me based on his recent comments that Dr. Mears has gotten fed up with people using his RSS data set to suggest that the world isn’t warming as he expects it should. From the video Mears states:
They just wanted to know, you know, they wanted to fine-tune their statement about, you know, whether , you know, the surface temperatures are more accurate or the satellite temperatures are more accurate, and initially they wanted to say something like “But you really shouldn’t trust the satellite temperatures, you should go with these surface temperatures”, and I said, “Well, what I would like to emphasize, you’d really want to look at all the different datasets, so you don’t want to trust only the satellite temperatures, you want to look at the surface temperatures, and – and that sort of thing.
On his website, Mears makes this statement:
Recently, a number of articles in the mainstream press have pointed out that there appears to have been little or no change in globally averaged temperature over the last two decades. Because of this, we are getting a lot of questions along the lines of “I saw this plot on a denialist web site. Is this really your data?” While some of these reports have “cherry-picked” their end points to make their evidence seem even stronger, there is not much doubt that the rate of warming since the late 1990’s is less than that predicted by most of the IPCC AR5 simulations of historical climate. This can be seen in the RSS data, as well as most other temperature datasets. For example, the figure below is a plot of the temperature anomaly (departure from normal) of the lower troposphere over the past 35 years from the RSS “Temperature Lower Troposphere” (TLT) dataset. For this plot we have averaged over almost the entire globe, from 80S to 80N, and used the entire TLT dataset, starting from 1979. (The denialists really like to fit trends starting in 1997, so that the huge 1997-98 ENSO event is at the start of their time series, resulting in a linear fit with the smallest possible slope.)

Source: http://www.remss.com/blog/recent-slowing-rise-global-temperatures Archived here: http://www.webcitation.org/6fiS2rI7k
Mears uses the term “denialist” so there goes his objectivity when he feels the need to label people like that.
Clearly, he’s miffed. So what to do? Taking a cue from the other Karl, he publishes a paper and claims that new and improved adjustments have “found” that missing warming.
Mears, C., and F. Wentz, 2016: Sensitivity of satellite-derived tropospheric
temperature trends to the diurnal cycle adjustment. J. Climate. doi:10.1175/JCLID-
15-0744.1, in press.
http://journals.ametsoc.org/doi/abs/10.1175/JCLI-D-15-0744.1?af=R
Here’s the result:
Here are the differences between the old version and new version of RSS

The new version V4.0 has the warming rate of almost double that of UAH V5.6 … (see Figure 9 below of the paper)

If you think that’s something, for the tropic-30S-30N: the new rate of warming of RSS V4.0 is almost five times larger than UAH’s!
Dr. Gavin Schmidt of NASA GISS seems thrilled that the new adjustment is coming:

Dr. Roy Spencer and Dr. John Christy have already looked into this latest “Karlization” and have found what appears to be a fatal flaw. Spencer comments in an email to me:
The paper is for MT, not LT…but I think we can assume that changes in one will be reflected in the other when Mears completes their analysis.
From what little we have looked at so far, it appears that they did not correct for spurious warming in NOAA-14 MSU relative to NOAA-15 AMSU…see their Fig. 7c. They just leave it in.
Since this spurious warming is near the middle of the whole time period, this shifts the second half of the satellite record warmer when NOAA-14 MSU (the last in the MSU series) is handed off to NOAA-15 AMSU (the first in the AMSU series).
Why do we think NOAA-14 MSU is at fault?
1) AMSU is supposed to have a “Cadillac” calibration design (that’s the term a NASA engineer, Jim Shiue, used when describing to me the AMSU design, which he was involved in).
2) NOAA-14 MSU requires a large correction for the calibrated TB increasing with instrument temperature as the satellite drifts into a different orbit. The NOAA-15 AMSU requires no such correction…and it wasn’t drifting during the period in question anyway.
So, it looks like they decided to force good data to match bad data. Sound familiar?
Yes, yes it does.
Added: here is Figure 7 from the paper that Dr. Spencer refers to:

h/t to Willie Soon with thanks to Dr. Roy Spencer
UPDATE1: Given this sort of work has only two groups doing it, it is a very narrow field of scientific specialty, I asked Dr. Spencer this question:
I assume neither you or Christy were asked to review this paper?There aren’t many satellite temperature data experts in the world.
He replied:
Interesting question….
John reviewed their original paper submission to JGR, in detail, asking for additional evidence — but not advocating rejection of the paper. The JGR editor ended up rejecting it anyway.
Mears & Wentz then revised the paper, submitted it to J. Climate instead, and likely asked that we be excluded as reviewers.
In the news Mears and Wentz paper, they comment on the NOAA-14/NOAA-15 issue, noting:
“We are left with explanation that the differences are caused by a calibration in either NOAA-14 or NOAA-15 (or both). Our baseline dataset will use both MSU and AMSU measurements during the overlap period. If we exclude MSU data after 1999 (implicitly assuming the error is due to NOAA-14), the long-term trend decreases by 0.019 K/decade, and if we exclude AMSU data before 2003 (implicitly assuming the error is due to NOAA-15), the long term trend increases by 0.01K/decade).”
So if Spencer and Christy are correct, that NOAA-14 is at fault, it seems like this would drop the reported RSS MT v4 trend from 0.125C/dec to 0.106C/dec, or by about 40%.
-Chip
Great insight Chip, thanks
[note, by a drop of 40%, I mean in the difference between the newly reported RSS v4 trend (0.125C/dec) and the RSS v3.3 trend (0.078C/dec)]
We have only a tiny abstract from a pay walled article on a subject very few people have any experience in-satellites- and which many in the business claim has little relevance to real world temperatures -2 metre above the ground-as very substantial interpretation is required.
Hopefully those with genuine expertise will chip in to the debate and provide some context.
tonyb
It’s not NOAA14 at fault.
It’s 15.
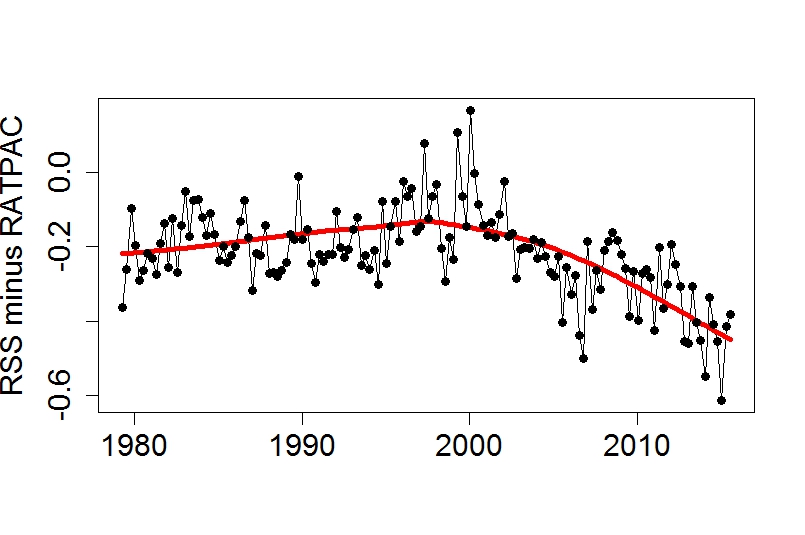
RSS v3.3 did not sit with calibration with RATPAC data since the new AMSU on 15.
Hehe. RATPAC is not “Troposphere Truth”, Toneb:
https://okulaer.wordpress.com/2016/02/21/taminos-radiosonde-problem-part-1/
Self-referencing eh Kristian (and death by graph).
Anyone can compare RSS (v3.3) v RATPAC data
They go adrift.
Either RSS or RATPAC.
So 85 sonde stations suddenly veer warmer at the junction of the MSU > AMSU 14>15 change over.
Passingly remote my friend.
Toneb: You say “anyone can compare RSS v RATPAC.” Yet I am having trouble reproducing your plots. What’s your data source for the RATPAC data properly weighted to directly compare with the MSU MT?
Thanks,
-Chip
Toneb says, March 2, 2016 at 3:10 pm:
Self-referencing eh Kristian (and death by graph).
*Eyeroll*
An advice to you, Toneb: Look at the DATA presented, not the person presenting it. The data speaks for itself. RATPAC and HadAT2 are both a mess.
Kristian, I would appreciate Meta Widget links (RSS entries-feed etc) at your interesting blog 🙂
Kristian:
“An advice to you, Toneb: Look at the DATA presented, not the person presenting it. The data speaks for itself. RATPAC and HadAT2 are both a mess.”
I respectfully disagree.
They are no more a mess than any other data-set.
I am sorry Kristian, but your analysis is just a wall of graphs and text. No statististics, and you dont even bother to a make a proper 850-300 mbar index out of HadAT.
The difference in trend between RSS (or UAH v6) is not significant before 2000, but it is after.
The pattern is confirmed by RICH, Raobcore, and IUKv2. The latter also have a slightly larger trend than the satellites before 2000, but not significantly.
Here is a comparison between satellites, radiosondes and reanalyses for the period when two satellite datasets diverge significantly
http://postmyimage.com/img2/995_Tropospheretrends.png
I have done some preliminary calculation on a RSS v4 TTT-product. In the graph above it would follow UAH 5.6, with a trend of about 0.12
The reason for the hadcrut 4 version was because hadcrut3 apparently wasn’t finding the warming in the Arctic. RSS matched hadcrut3 fairly well during both MSU and AMSU before it changed to hadcrut 4.
http://www.woodfortrees.org/plot/rss/from:1979/to:2014.5/plot/hadcrut3gl/from:1979
Now RSS changes to match closer to hadcrut4 when the reasons for changes in hadcrut have not been verified by the GPS-RO also below. So has now RSS fabricated the missing warming in the Tropics to match surface data because of a unverified problem not even related to this?
“The temperature calculated from GPS-RO geopotential height matches the MSU tropospheric temperature time series and trends in the hiatus period, and therefore our analysis strengthens the case for using MSU/AMSU TLT in polar regions. However, when partitioning the trends of all 4 data sets into different latitude bands we do not observe an impact of omitting polar data (Figure 3 right panel). We find that the main reason for the absence of global warming in 21’st century must be found in the tropics. This is not contradicting Cowtan and Way, who analysed a more extended hiatus time interval from 1997-2012.”
http://research.dmi.dk/uploads/media/poster.pdf
Matt G,
Indeed.
You can read about the GISTEMP (and, by extension, the introduction of HadCRUt version 4) vs. the HadCRUt3 product here:
https://okulaer.wordpress.com/2015/12/23/why-gistemp-loti-global-mean-is-wrong-and-hadcrut3-gl-is-right/
Also, GISTEMP vs. UAHv6:
https://okulaer.wordpress.com/2016/01/27/why-gistemp-loti-global-mean-is-wrong-and-uahv6-tlt-gl-is-right/
Pretty obvious (and embarrassing) what these people (at GISS) are doing. Their thumbs on the scales …
The troposphere DOES track the surface. If you only know what surface dataset to use: HadCRUt3. Which agrees remarkably well with the CERES ToA OLR data.
Ah, of course, feed now works after manually having entered:
http://okulaer.wordpress.com/feed
Toneb,
RATPAC doesn’t suddenly veer. It didn’t exist prior to 2005. It matches that satellite data so well because it was pegged to the satellite data in development. The moment it went live it started to diverge because it was designed to. NOAA didn’t like what the weather balloons were saying so they rigged a new dataset to show warming.
Of course.
Had to be *the* conspiracy.
Like adjusting down is fine, but god forbid they are made upwards.
For whatever reason, eh?
.
It is not NOAA-15 that it at fault as this data can be used without any corrections to the measurements.
Long-Term Trend of the NOAA-15 AMSU-A Performance
http://onlinelibrary.wiley.com/doi/10.1029/2008JD011267/full
One thing.
The paper is entitled (fully)….
“A study of the NOAA-15 AMSU-A brightness temperatures from 1998 through 2007”
So up to 9 years ago.
It maybe 9 years ago, but the main issue is regards to changing from MSU and clearly this has not been a problem with it being used here for nearly a decade.
Matt:
“It maybe 9 years ago, but the main issue is regards to changing from MSU and clearly this has not been a problem with it being used here for nearly a decade.”
I refer you to the quote from Mears et all in the first post here by Chip Knappenberger…..
“We are left with explanation that the differences are caused by a calibration in either NOAA-14 or NOAA-15 (or both). …..”
And a simple look at the RATPAC comparison makes it abundantly clear something “has happened”.
What has happened is a small observation project cannot find global trends. These claims from the other inferior products are embarrassing and like wanting to adjust global temperatures to local.
How does a limited 85 station network become the standard reference for satellite data that covers ~95% planet? The UK has warmed much less than global temperatures this month with a station network larger than this, so need to adjust GISS to show this less warming?
Should be,
“warmed much less than global temperatures this year.”
“so that the huge 1997-98 ENSO event is at the start of their time series”
Thing is, that the 1998 El Nino is what actually STOPS the back-calculation.
Without that STEP that alarmist have to rely one to show a warming trend, there has been essentially NO WARMING in whole satellite record.
Flat before the 1998 El Nino, and flat from after it up to this El Nino.
The alarmista are RELYING on these NON-CO2 forced El Ninos to claim warming.
So El Ninos step up the temperature but La Ninas don’t step it down?
I say more like, the pre-1997 period has its slope depressed by the Pinatubo eruption.
El Nino/La Nina, when there is a solid solar input yes.. they can cause a step up.
Now what do you think they will do when the solar input is low.
Guess we will find out in the coming year or so.. won’t we 😉
Yes, the debate about how our local star doesn’t control our temperature despite it being the main source of heating here on this planet, will end once the sun decides to do what it did during the Little Ice Age, that is, have few or no sun spots.
“The question is if the UAH team will be doing similar corrections in their data treatment, or if they will write an article that explains their view on why the RSS team is wrong with this update.”
What I said on the previous thread.
Our UAH v6 paper has been already been submitted for possible publication, although it still has to go through peer review. It’s a little awkward to add new, significant material to a manuscript after it’s already submitted, so John Christy and I need to discuss this.
Roy, I understand that. If a paper of yours is already submitted… Discuss thoroughly 🙂
But it would be good to see an opinion (added to the presently submitted paper or in a future one) from the UAH team on the new corrections from the RSS team.
a little awkward perhaps but surely crucial given the issues raised by Mears and Wentz?
Dr Spencer, will Carl Mears or anyone on the RSS team be peer reviewing the UAH v6 adjustments? This is all getting rather messy in my opinion. UAH adjustments decrease the trend in LT, RSS adjustments then increase the trend in MT, especially over the tropics, thereby miraculously finding the missing tropical mid-tropospheric hotspot. From the outside, for the lay-person who doesn’t understand all the intricacies of satellite tropospheric temperature retrieval, it’s coming down more to a matter of whom do we trust more to give an unbiased analysis of satellite data? Mears has demonstrated repeatedly an unscientific bias in favour of endorsing AGW theory. His recent behaviour in that regard falls far short of what one should expect from a scientist who is dispassionately surveying the evidence for and against a significant, perhaps overriding influence of man on climate. He is behaving more like an advocate than a scientist whereas yourself and John Christy have maintained a more balanced approach. So unless Mears can demonstrate an overwhelmingly good scientific case for his positive adjustments vs. the UAH negative adjustments, the balance has to be in favour of giving more credence to UAH data rather than the new ‘pause buster’ RSS data.
Change that to Karl Mears, please
Dr Spencer,
I read above that you trust NOAA-15 and not NOAA-14 because some NASA scientist have told you that the AMSUs have a “Cadillac calibration”.
Is that approach scientific, making important choises based on anecdotes? As a contrast Mears et al consider NOAA-14 and -15 equally right (or wrong). Since we simply don’t know which one is right, I find their approach scientifically sound. But, why not bring it to the test, and validate NOAA-14 and NOAA-15 against radiosondes and see which one is right? As far as I know NOAA-14 follow radiosondes, but NOAA-15 doesn’t.
Another way to validate the AMSU-channel 5 is to compare with the neighbour channels 4 and 6.
Is it reasonable that the trend of channel 5 is 0.15 C/decade lower than channel 4, and almost as low as channel 7 (Mo 2009)?
Is it reasonable that the trend of channel 5 is much lower than a weighted blend of channel 4 and 6 (according to the NOAA Star AMSU-only datataset)?
Finally, why is UAH 5.6 more or less immune to the pause ? Is it because it relies less on NOAA-15 and more on nondrifting Aqua and Metop? Can the pause be an artefact caused by an unknown drift in AMSU-5 onboard NOAA-15? More use of NOAA-15 gives more pause, etc…
Olof R says, March 3, 2016 at 3:16 am:
Why do you automatically think that the radiosondes represent “Troposphere Truth”? That’s a nonsensical assumption.


GISTEMP trend 1979-2001: +0.135K/decade
RATPAC-A (850-300mb) trend 1979-2001: +0.085K/decade
HadAT2 (700mb) trend 1979-2001: +0.071K/decade
GISTEMP trend 1999-2015: +0.166K/decade
RATPAC-A (850-300mb) trend 1999-2015: +0.242K/decade
HadAT2 (700mb) only goes through 2012, but follows RATPAC-A
From 1979 to 2001, the global surface of the Earth (by GISTEMP) warmed a lot faster than the troposphere above it, as per the radiosonde version of it. From 1999 to 2015, however, the tables are turned; now the radiosonde troposphere all of a sudden warms substantially faster than the surface underneath. There is no tenable physical explanation to such a massive reversal in relative warming rates between the surface and the troposphere. Rather, this glaring discrepancy is a clear indication of methodological errors:
Note how the first period (1979-2001) coincides with the period for which the Climate Establishment scorned UAH for not showing high enough warming rates. Well, UAH complied and warmed their series. But, as you can see, the radiosondes are still there, almost flat:
Why would this represent “Troposphere Truth” …?
Olof R says, March 3, 2016 at 3:16 am:
No. UAHv5.6 needed adjustement simply because there was an obvious spurious upward shift in their land portion during 2005:
https://okulaer.wordpress.com/2015/03/08/uah-need-to-adjust-their-tlt-product/
UAHv5.6 was clearly flawed. And so the UAH team fixed the error. Now the UAH series fits to near perfection with HadCRUt3 and with CERES ToA OLR:
Spot any sudden upward shift in the mean level CERES ToA OLR occurring during 2005? Didn’t think so …
@Jaime
“He is behaving more like an advocate than a scientist whereas yourself and John Christy have maintained a more balanced approach. ”
Dr. Spencer is a signatory of the Cornwall Alliance statement on Climate Change, stating that God would not allow us to adversely alter the climate. He has also stated that he views his job as stopping overt government overreach and taxing on climate change mitigation.
I’m not criticizing Mears or Spencer either way – but it’s false to suggest that Dr. Spencer has not engaged in explicit advocacy over this issue.
Jaime March 3, 2016 at 2:25 am
So unless Mears can demonstrate an overwhelmingly good scientific case for his positive adjustments vs. the UAH negative adjustments, the balance has to be in favour of giving more credence to UAH data rather than the new ‘pause buster’ RSS data.
This is rather ironic Spencer has always stated that the RSS method of correcting for diurnal drift was inferior to the method that he and Christy used, criticizing the approach of using a climate model as the basis for their correction. Now RSS have come around to his way of thinking and developed a new method which is the subject of their new paper.
“In this paper, we present evidence that this previous method is not sufficiently accurate, and present several alternative methods to optimize these adjustments using information from the satellite measurements themselves. These are used to construct a number of candidate climate data records using measurements from 15 MSU and AMSU satellites. The new methods result in improved agreement between measurements made by different satellites at the same time.”
Here is a reference to the previous method by Spencer while referring to UAH’s need for updating:
“After 25 years of producing the UAH datasets, the reasons for reprocessing are many. For example, years ago we could use certain AMSU-carrying satellites which minimized the effect of diurnal drift, which we did not explicitly correct for. That is no longer possible, and an explicit correction for diurnal drift is now necessary. The correction for diurnal drift is difficult to do well, and we have been committed to it being empirically–based, partly to provide an alternative to the RSS satellite dataset which uses a climate model for the diurnal drift adjustment.”
So it’s difficult to argue that over such a time it’s appropriate for UAH to substantially modify their method while at the same time criticizing RSS for a similar change, particular when they drop the previous approach which S&C had always criticized!
The interesting part is that both groups appear to be moving away from the TLT product to the TMT.
Phil. March 4, 2016 at 10:21 am
“This is rather ironic Spencer has always stated that the RSS method of correcting for diurnal drift was inferior to the method that he and Christy used, criticizing the approach of using a climate model as the basis for their correction. Now RSS have come around to his way of thinking and developed a new method which is the subject of their new paper.
So it’s difficult to argue that over such a time it’s appropriate for UAH to substantially modify their method while at the same time criticizing RSS for a similar change, particular when they drop the previous approach which S&C had always criticized!”
Spencer & Christy devised an empirical method of correcting for diurnal drift, in part driven by a desire to find an alternative to Mears’ corrections based on a climate model. Simply because Mears has now devised an alternative correction for diurnal drift does not mean that it is superior to the previous model-based correction or that it is somehow now ‘in line’ with Spencer & Christy’s empirical method. Most obviously, RSS v4.0 is now less ‘in line’ with UAH than it was before. So whereas the evolution of adjustments to UAH have resulted in a relative modest cooling, the same in RSS have now resulted in significant extra warming. Both datasets might be wrong; either may be more or less correct, but they can’t both be right.
“The interesting part is that both groups appear to be moving away from the TLT product to the TMT.”
Yes, I believe TMT is more straightforward to measure, without having to correct additionally for radiation coming from the surface.
Every dataset on the planet shows 2016 as the warmest year ever recorded. UAH, RSS, et al. How can they all be wrong?
” Every dataset on the planet shows 2016 as the warmest year ever recorded. UAH, RSS, et al. How can they all be wrong?”
To start all but one model part or most of the planet based on spotty samples.
I’m not sure what ‘one model part’ is but thought RSS & UAH covered nearly the full planet. That does not sound spotty.
” I’m not sure what ‘one model part’ is but thought RSS & UAH covered nearly the full planet. That does not sound spotty.”
My understanding of one of the comments is that RSS solves some of its calibration (diurnal? ) with a model, where UAH is empirical. And the surface series are mostly made up of locations that aren’t even measured.
Spencer & Christy have responded to Mears v4 adjustments here: https://wordpress.com/read/feeds/867469/posts/946736580.
Only 1/3 of the correction is due to the diurnal drift and Mears’ combination of empirical and model adjustment gives a stronger upward correction for diurnal drift than UAH empirical only.
Attention, any attention is good, when you are indulging in public relations.
So what justification does Mear use, to explain why his measurements need adjusting once more?
Could he define his terms?
For example what does “denialist” mean?
As the good doctor uses it?
Why would a scientist take it personally how other persons use his interpretations of satellite data?
This strange mixture of advocacy and science seems to serve neither.
Now I may just be blind, but what is the zero average temperature for these anomalies ?What period?
And what are the error bars?
Because if these “measurements” need adjusted once more, surely the pass error estimations must have been underestimated.
His open insult calling people who have other ideas, ‘denialists’ is pure evil and totally due to politics, not science and he is totally wrong to use this term and should apologize and resign.
RSS probably got tired of dealing with complaints from it’s funding sources. Why else “correct” to match known bad data?
I suspect you are correct. It happens all the time in behavioral surveys, where biased measures, oversampling and sloppy weighting practices are used to make outcomes look better than they really are. For example, a website might have an audience of 1,000,000 on a clean survey, and an audience of 1,500,000 on a biased survey. If you’re selling ad audience which number do you want to pay for? The problem is that it always comes back to bite them in the arse in the long run.
In the ocean acidification article published by WUWT yesterday, the author of the journal article wrote this:
“The bias in favour of doom-laden articles was partly the result of pressure on scientists to produce eye-catching work, he added.”
“You won’t get a job unless you publish an article that is viewed as of significant importance to society. People often forget that scientists are people and have the same pressures on them and the same kind of human foibles. Some are driven by different things. They want to be prominent.”
So what do the Radiosondes say?
In a prior post here it was raised that water vapor rises by 7% per degree of warming. Sort of like an internal calibration check.
if the water vapor level doesn’t match they have a problem !!
Sigh! Here we go again.
Caramelizing is a part of many recipes that sometimes end in disaster.
Why not use it to Cook data?
In the same vein as changing the good data to match the bad data, perhaps the climate scientists never correlate their models to match measured data because they know eventually the measured data will be adjusted to match the predicted data.
As any fool can see the data trend was wrong, nudge nudge wink wink say no more, and naturally has underestimated the warming as usual. ?w=720
These tiny incremental adjustments can go on indefinitely, welcome to the “Adjustocene”:
With so many adjustments that the original readings are obscured I suggest the modern era be named the Datanotcene.
Also the time of a major extinction event. 97% of the phylus ‘climactius scientisticus” seemed to disappear from all properly peer reviewed documents.
Obscene 😉
It illustrates the sore state of science nowadays. Unfortunately it is not only climate but this is a very representative section of it => if the data does not fit your theory adjust your data.
The RSS adjustments were long overdue, as the difference between the satellite and terrestrial measurement were a pain. Now solved, exactly as the sea level story – where satellite did not show the wished increase initially:
Look at the old satellite data from 2001 :
http://www.john-daly.com/ges/msl-rept.htm
http://www.john-daly.com/ges/images/niv_moy.gif
Just compare that with what has it become a decade later… not through better satellites/better data, but all through adjustments – all newer satellite data were adjusted to the previous adjusted data.
Amusing, but misleading.
The adjustments have warmed the past.
“The adjustments have warmed the past”
===============================================
Really, the past is infinitely larger then the present, so what past do you mean?
Looks like Mears may have gone after the missing mid-troposphere tropical hotspot.
looks like uah found it going by the february anomaly 😉
Indeed. From the point of view of endorsement of AGW theory, finding greatly accelerated warming in the tropical mid-troposphere represents more of a coup than demonstrating modestly more accelerated warming in the LT.
Do the gatekeepers of government controlled temperature statistics ever adjust their numbers downwards?
It would be nice to think that this was possible, even if it was only done once.
Only peaks back in history to increase the more recent warming trend or to increase the difference between past and present.
Do the gatekeepers of government controlled temperature statistics ever adjust their numbers downwards?
Adjustments to SST (bucket adjustment) lowered the centennial trend by warming the early part of the record.
https://www.ncdc.noaa.gov/monitoring-references/faq/temperature-monitoring.php
Sure. About half the time they go down, and about half the time, up.
http://berkeleyearth.org/wp-content/uploads/2015/04/Figure7.png
What part of this isn’t clear?
https://stevengoddard.wordpress.com/2014/08/12/what-part-of-this-isnt-clear-3/
Lars P,
That graph says it all…
I should have said, “trend in their numbers downwards”
I never trust data that has been adjusted to show a trend that didn’t appear before while it was in operation. Adjusting good data to bad data just because it matches the surface data closer is bad science practice.
It looks like the Pause had to be MWP’d (verb, mod., trans), as in “we have to get rid of …..”.
But I thought it was UAH (Mr Spencer) that ‘adjusted’ his data (the so called Version 6) after copying RSS’s homework. Turns out Mr Mears’ answers were wrong. This leaves UAH high and dry…
Begs the question….what will Sir Christopher Monketon make of developments?
All temperature datasets are imperfect.
All need adjusting as improvements in understanding are made.
And if the improvements are reaching towards a physical reality about half the improvements will lower the trend and about half will increase a trend.
But all the improvements increase the trend.
So it’s not reaching towards a physical reality
@ur momisugly M Courtney: Errors are not necessarily random in sign. Therefore, improvements may not be evenly distributed between positive and negative. Even so, the statement that “… all improvements increase the trend” is false. The previous major adjustment made by RSS decreased the trend of lower troposphere anomalies significantly. The most recent change (to mid-troposphere anomalies) is about the same magnitude, but in the opposite direction.
Here is the difference between today’s warming and tonight’s cooling for some 78 million surface records (all stations that collect greater than 360 sample for any included year/station combination)
Overall it cools slightly more at night over land, than it warmed the day before.
There wasn’t reliable evidence for warming due to CO2 levels increasing. The pause highlighted that. Adjusting data to get back the warming only highlights it even more – the results are highly dependent on subjective choices in the analysis that were changed after the results were in.
The null hypothesis is that there is no correlation. Uncertainty that there is a real pause of 0°/decade trend is not necessary. What is obvious is that the data doesn’t fit the model projections/predictions without revision of how observations are quantified.
“There wasn’t reliable evidence for warming due to CO2 levels increasing. ”
Amongst many….
http://newscenter.lbl.gov/2015/02/25/co2-greenhouse-effect-increase/
“These results confirm theoretical predictions of the atmospheric greenhouse effect due to anthropogenic emissions, and provide empirical evidence of how rising CO2 levels, mediated by temporal variations due to photosynthesis and respiration, are affecting the surface energy balance.”
That red forcing estimate is *theoretically* calculated, not actually observed. Furthermore, the small increase in it (at best, 0.2 W/m2) is very small, and probably is swamped by natural variations…which are not shown. Conveniently, natural variations are not called “forcing”.
Toneb,
Buncha nonsense. No one has ever measured AGW, so that’s merely speculation.
You do realize that at the same location and encompassing the period used in the paper, another paper found a decrease in the total downwelling IR, right?
Gero/Turner 2011
“The most distinct result from these plots is that clearsky scenes are getting colder (i.e., less downwelling radiance) for all seasons and spectral regions (Fig. 7)”
“Since the downwelling infrared radiance is very sensitive to changes in precipitable water vapor (PWV) (Turner et al. 2004), this almost certainly indicates a decrease in PWV at this site over this period. ”
CO2 band radiation only gets 10 metres before it is ALL absorbed. Those same molecules do ALL the reradiating that is detectable on the ground (because reradiation from higher up will also be all absorbed). Doubling CO2 takes that to 5 metres. Easy to imagine changes in back radiation detected by an instrument even just 1 metre off the ground as it is a significant and variable fraction of the distance towards the end point. And at ten metres height, everything you measure will be from radiation emitted by the immediate few metres vicinity of the instrument. Lots more wrong here but I’m typing on a mobile.
‘Conveniently, natural variations are not called “forcing”’
There are no natural forcings or variations other than the Sun. Clouds and water vapor don’t change by themselves. Absent human influence you would expect them to remain the same forever.
Alberto Zaragoza Comendador:
NO! I would not “expect” that ONLY humans influence anything in nature.
Richard
Clearly man is not the only thing that can change the forcings. Volcanoes, solar, biological factors, erosion etc. These can all cause changes to the forcings, and these changes all have feedbacks, both positive and negative. However, if there were no change in the forcings, then we should expect things to remain much the same. Since there are so many natural factors that do affect the forcings, we would not expect a stable climate in the absence of man. Which is what we observe.
seaice1 says:
…if there were no change in the forcings, then we should expect things to remain much the same.
‘Things’ remain the same. There is nothing unprecedented happening. There is nothing unusual happening. Everything we observe now has happened in the past, before human industrial emissions, and to a much greater degree.
Sorry, but your “theory” is wrong.
The data behind the .2w/m2 +- .06w/m2 (per decade increase of 20ppm co2) is from careful measurements over 10 years. this is an increase in down well Long wave radiation on a clear day. the forcing is modeled with an expectation of 3x effect from water vapor which is not observed. Its an interesting paper that has to be read carefully. The change in radiation for 20ppm is so nearly negligible as to be silly. Downwelling radiation varies 0 to 500w/m2 depending on location, time of day, wv etc. Willis’s thermoregulation effects would have no problem drowning out that little bit of nothing!
v/r,
David Riser
” Downwelling radiation varies 0 to 500w/m2 depending on location, time of day, wv etc. Willis’s thermoregulation effects would have no problem drowning out that little bit of nothing!”
This is easy to see with an IR thermometer pointed straight up through the optical window, a light haze changes the temp easily more than 10W/M2.
could it be the posited water vapour feedback does not happen as there is a negative feedback that decreases water vapour in line with rising co2 levels ? maybe a stupid question, but i will ask it anyway.
” could it be the posited water vapour feedback does not happen as there is a negative feedback that decreases water vapour in line with rising co2 levels ? ”
There is a limit to humidity every night when it cools, and maybe as the surface cools, there’s enough of a drop in upwelling IR that that isn’t proping up temps maintaining the humidity level.
“could it be the posited water vapour feedback does not happen as there is a negative feedback that decreases water vapour in line with rising co2 levels ?”
The elephant in the living room are the changes to the cloud albedo with increasing evaporation. That process is very complicated, but it is certainly not unreasonable to suppose that more evaporation leads to more clouds. Those white clouds are a direct, primary negative feedback on the insolation that reaches the surface.
Is relative humidity near-constant?
‘Over the tropical oceans, atmospheric temperature and total column water vapor (TCWV) are tightly constrained assuming near-constant relative humidity.’
Tom Yoke wrote that increased water vapor from warming means more cloud cover. It’s not so simple. Instead, clouds are becoming more concentrated. Because clouds are becoming more concentrated and their associated updrafts are becoming more intense, the percentage of the world covered by these has been decreasing. The percentage of the world covered by clear air and downdrafts has been increasing. This means global atmosphere average relative humidity has been decreasing.
However, the amount of water vapor has been increasing less than if global atmospheric average relative humidity remained constant. This makes the water vapor feedback less positive than if relative humidity remained constant.
That line is from the Mear’s paper, that’s why I was wondering.
And your source for that was?
I probably don’t have to add anything to the debunking. I’ll just summarise. Its less than 0.1% of the average amount of down welling over the globe. Even with only 1°C change in temperature over a 24 hour period for the TOA, that’s 2 times bigger change in intensity than 20ppm rise in CO2. Possibly well below the precision of the experiments but ignored like with Ocean Heat Content. The overall intensity of LWIR from a clear sky had diminished so the vast bulk of the GHE, the positive feedback, is not consistent with the data.
There is not much doubt that more CO2 in the atmosphere will increase the intensity of LWIR emitted near the detector for certain wavelengths but from nearby, not the roof of the glasshouse. Then you need to show that the world is warming as the models predict.
” Even with only 1°C change in temperature over a 24 hour period for the TOA,”
I routinely measure 80F – 100F difference between the temp of my east facing concrete sidewalk, and the temp pointing straight up under clear skies. On a typical 50F day, Tsky reads -40F, and while the optical window doesn’t have any CO2 IR, at that temp (which is the temp the surface sees over the high temp portion of the band), adding the 3.7Wm2 to that temp, makes about 2-3F difference in Tsky, so instead of -40F it becomes about -38F instead. Varying types of clouds make as much as an 80F difference in Tsky. Varying humidity below about 80% rel humidity hasn’t made an noticeable difference in Tsky, you can see this in the night time clear sky cooling rate (8-10F/hour) until rel humidity gets into the mid 80+% rel humidity or higher, where the cooling rate can drop to between 1 and 2F/hour.
So there’s not enough room in any of these measurements to allow for much in the way of added Co2 or excess water feedback.
Add on to that, that you can take the measured change per day for a year for hundreds of stations each year, and plot the slope of the temperature and compare this slope over multiple years, and it doesn’t show any sort of a trend.
All this leads me to say, the change in Co2 isn’t causing any of the changes is surface temp (if any of it is actually more than processing artifacts).
dbstealey. My post says that there will always be changes to the forcings with or without man, so without man there will be changes to the climate. This is what we observe from studies of past climate. It is obviously wrong to say that only man can change the climate. It is also wrong to say that the climate changes for no reason. Can you explain which part of this you do not agree with?
Mears’s repeated claim that skeptics are cherry-picking the start year for the pause, despite repeated explanations that it’s calculated backwards from the end, makes him nearly as bad as anyone on his side of the fence.
Well, frankly I see no difference in cherry-picking a year and calculating how to cherry-pick it. The latter is more efficient of course. The hiatus won’t go away by telling the date is cherry-picked, though.
But the essence of cherry-picking is about truncating the graph, not about calculating a date.
There is a proxy available for global temperature which confirms the “pause”, and that is the rate of change of atmospheric CO2. Here with RSS no doubt prior to this update:
http://woodfortrees.org/graph/esrl-co2/derivative/mean:12/scale:4.5/offset:-0.6/from:1979/plot/uah/plot/rss
ummm…I’d be interested to know exactly how that “CO2 derivative” curve was computed…it does not look like any I have computed from CO2 data.
I assume first differences divided by time interval, with 12 month running average to eliminate the yearly fluctuation. That is how I have done it in the past, with similar results.
http://i1136.photobucket.com/albums/n488/Bartemis/CO2_zps330ee8fa.jpg
Here’s the originating plot at WFT site, which you can play around with as you like.
http://woodfortrees.org/plot/esrl-co2/derivative/mean:12/scale:4.5/offset:-0.6/from:1979/plot/uah/plot/rss
IIRC, I did have to interpolate the data at uniform monthly intervals in order to apply a uniform 12 month averaging filter.
Here is a comparison over the longer term with HADCRUT4SH data. The surface series are probably too corrupted to trust in general, but of the ones available at WFT, this one seems to best match the satellite data over the period of overlap. It appears that most of the tampering takes place with NH data.
http://woodfortrees.org/graph/esrl-co2/derivative/mean:24/from:1958/offset:-0.1/scale:4.5/plot/hadcrut4sh/from:1958
Why such a big fuss about a temperature anomaly of only few tenths of a degree C when the range of diurnal and seasonal temperatures vary by about 50 C? In any case, those variations have nothing to do with atmospheric CO3 and even less than nothing to do with human emission,
carbon trioxide. I like the sound of that. 🙂
https://en.wikipedia.org/wiki/Carbon_trioxide
It’s even more potent than CO2 as a GHG. With that extra atom, the forcing is clearly upwards. /sarc
Carbon Trioxide – now with 50% more warming!
Re Bartemis’ link to Wiki, CO3 is an “oxocarbon”. Is this something like an oxomoron?
I have always used UAH LT data – fortunately, it now seems – I just did not fully trust those RSS’s.
For example:
To:
Heads of Departments,
Proceedings, National Academy of Sciences (PNAS)
Dear PNAS Heads:
UAH Global Temperature Update for July 2012: +0.28C,
COOLER than June, 2012: +0.37 deg.
If one wants to argue about GLOBAL warming, should one not look first at GLOBAL temperatures?
Respectfully, Allan
Martin,
People had some fun with your typo. Enjoy it.
(Maybe the Obamanites will switch from the war on CO2 to a war on CO3?)
well, the rate of change of CO2 can’t support the temperature PAUSE because, with linearly increasing CO2 with time, a plot of the rate of change with time is FLAT.
Well, yeah, just like the temperature is FLAT. But, prior to the “pause”, the rate of change of CO2 shows more than flatness. It shows a proportional change with temperature anomaly relative to an appropriate baseline. I.e., the rate of change of CO2 is a proxy for global temperature, both before, and after, the onset of the “pause”.
Murry Salby observed this and explained it in terms of ocean outgassing.
That may not be true. Bartemis. There is something very wrong with the reported co2 levels. There is also something wrong with the statement that the IPCC can tell the difference between naturally occurring co2 and anthro co2 by isotope ratios. And there is also something wrong with relationship between co2 and the sink rates. There is no way that the sink rate for last year could possibly equal the sink rate for 30 years in the late 19 century. And yet during that time period there is a small rise in co2 levels each year? To believe that such small levels of co2 could not be absorbed is close to insanity.
“There is something very wrong with the reported co2 levels.”
I don’t think so. The rate of change matches the pre-Karlized (and now Mearized) data quite well. I believe this is due to temperature modulation of natural flows. Ferdinand Englebeen and I have been arguing about this for ages in various comments sections here on WUWT.
“There is also something wrong with the statement that the IPCC can tell the difference between naturally occurring co2 and anthro co2 by isotope ratios.”
I agree. The isotope ratio lends itself to an interpretation which is merely consistent with attribution to the burning of fossil fuels. But, it is not the only interpretation, and consistency with an hypothesis is not proof of the hypothesis. The claim that “we can’t think of any other way for it to happen” is argumentum ignorantiam. Process of elimination only works when you have a full set of alternatives to winnow down.
“There is no way that the sink rate for last year could possibly equal the sink rate for 30 years in the late 19 century.”
I think that anything which is not directly measured and which cannot be verified by independent means, such as ice core CO2 estimates, should be considered with a high degree of wariness.
“To believe that such small levels of co2 could not be absorbed is close to insanity.”
Especially when the year-to-year variation is so much greater than that small input, and the natural flows are are greater by more than an order of magnitude.
Please note: the claim that the rate of change of CO2 is a valid proxy for global temperature anomaly is NOT a claim that CO2 drives temperature, but rather the reverse. Due to the differential relationship, the arrow of causality is necessarily in the direction of temperature driving CO2.
“The rate of change matches the pre-Karlized (and now Mearized) data quite well.”
There were adjustments to surface temperatures based on the satellite data, openly. I didn’t read up on what it was.
There is something wrong for there to be such a good correlation with an uncertainty of 0.1°C for the temperature. Divide that by your scale and the dCO2/dt corresponds to 0.02ppm/month. The greatest difference in the plot is 0.2. So its magic just from the uncertainty in monthly temp anomaly that they correlate let alone that the global CO2 is measured at ML to within a 1/100th of a ppm.
Something very wrong.
Also interesting that no matter what temperature data set you use compared to the Mona Loa data, temperature change precedes CO2 change http://www.woodfortrees.org/plot/esrl-co2/isolate:60/mean:12/scale:0.2/from:1979/plot/hadcrut4gl/isolate:60/mean:12/from:1979/from
Nonsense. Coherent formations which replicate in both signals are not “noise”. It is a high pass filtering operation. It passes signal as well as noise in the higher frequency band. CMS’ chart shows that CO2 does, indeed, lag temperatures in that band.
For attribution of the observed rise, though, you have to establish that the signals match in the low frequency regime as well. And, they do in the modern era. The phase lag of 90 deg is uniform across the entire spectrum, which is why there is such a good match to the differential equation dCO2/dt = k*(T – T0), for appropriate constants k and T0.
Those arguing for anthorpogenic attribution for the observed long term rise either implicitly or explicitly allege that this remarkable match is mere coincidence, and that nature somehow separates the high and low frequency responses such that humans are responsible for the latter. But, that is just arbitrary dismissal of what would be an astounding happenstance if true.
In fact, there is no reason that nature cannot be responsible for virtually the entire observed rise. It fits the data seamlessly, and it is much less complex a relationship. Occam’s razor comes down squarely on the side that atmospheric CO2 is temperature driven, and human inputs have negligible impact.
This is strange. The comment to which I was replying disappeared after I posted. Probably a momentary glitch. If it does not reappear, know that I was not replying to CMS, but to a comment that had taken issue with him.
Those that control the present, control the past; those that control the past, control the future.
Why am I not surprised. If a crime has similar modus operandi to other crimes it is suspected that there is a single group or individual behind the crimes.
We are supposed to see nothing, hear nothing, and say nothing. Just believe and the cool aide will go down easier.
The cool aide? Is that similar to a hot assistant?
Just as each successive crime becomes easier (so they say), just so for each upward adjustment.
So the trend changes by 0.05 K per decade. Does anyone know how this compares to error estimates for the overall trend? Of course, coming up with realistic error estimates is often much harder than calculating the function itself, so maybe we don’t even have any.
error estimates ? in climate science ? did you not get the memo there are no errors in climate science. the science is settled 😉