Of the many reference pages we offer on WUWT about weather and climate data, the WUWT Sea Ice Page is the most popular of all, and it is the most popular page on WUWT besides the home page. In the last year, it got neglected and some of the images, data, and links became broken due to them changing at their source websites.
Having a year of distractions, both personal and professional, I was remiss in keeping it updated. That has since changed and as far as I can tell, it is fully functional again. If it isn’t, please let me know in a comment below.
I’m always interested in new elements, so if there is an image, graph, or live feed that you know of that is not included here, please leave a comment with a link to the source and I’ll look into including it.
Thanks for your patience, and as always, thanks for reading WUWT.
Thanks. If you are interested in adding the Baltic Sea, there are excellent charts which update daily during the winter months, available here :
http://cdn.fmi.fi/marine-observations/products/ice-charts/latest-full-color-ice-chart.pdf
I love the page. The only problem I have is the Denmark sourced pages are blocked at work, for some stupid reason.
Exposure to reality in the workplace is a no-no.
Particularly in the public education sector, from my experience.
ICE !! What sea ice, I thought it all melted a few years ago ? You’re not saying that all these greenie web sites lied are you !! LOL
I send my friends there and heard nothing negative when I asked them later what they thought. I have a particular interest in the Gulf of Maine and surrounds and it’s been very interesting. Thanks for everything! Oh, and GO PATS!
Go Broncos.
GREAT page, and worthy of a daily look!
No one does this as well as you, Anthony!!!
“No one does this as well as you, Anthony!!!”
+1000
Totally agree.
Thank you so much Anthony for everything.
Thanks for the update. I do check it out quite often.
The Sea Ice page (and its links ) is an invaluable resource.
Too bad the page cannot contain a little more history.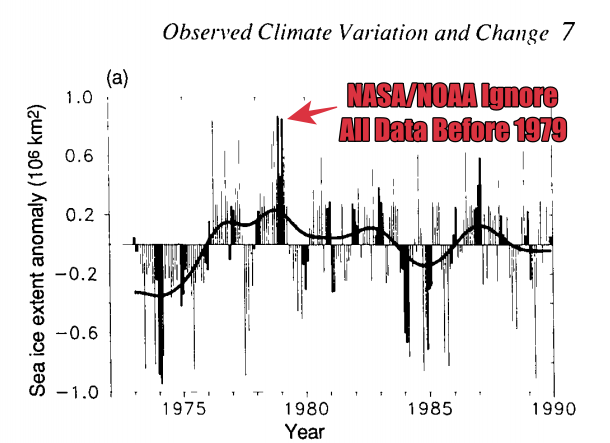
http://ipcc.ch/ipccreports/far/wg_I/ipcc_far_wg_I_chapter_07.pdf
Page 224. N. Hemisphere snow extent was still going up. Fig 7.19:
1973 & 1974 Arctic Ice extent was 700,000 km^2 below the 1998 Average.
Sea Ice – 1973-1990
This is written ;under the original chart in the report.
Changes and fluctuations in Arctic seaice extent have been analysed by Mysak and Manak (1989); they find no long term trends in sea-ice extent between 1953 and 1984 in a number of Arctic ocean regions but substantial decadal time scale variability was evident in the Atlantic sector. These variations were found to be consistent with the development, movement and decay of the “Great Salinity Anomaly” noted in Section 7.7. Sea-ice conditions are now reported regularly in marine synoptic observations, as well as by special reconnaissance flights, and coastal radar. Especially importantly, satellite observations have been used to map sea-ice extent routinely since the early 1970s. The American Navy Joint Ice Center has produced weekly charts which have been digitised by NOAA. These data are summarized in Figure 7.20 which is based on analyses carried out on a 1° latitude x 2.5° longitude grid. Sea-ice is defined to be present when its concentration exceeds 10% (Ropelewski, 1983). Since about 1976 the areal extent of sea-ice in the Northern Hemisphere has varied about a constant climatological level but in 1972-1975 sea-ice extent was significantly less.
About where we are now.
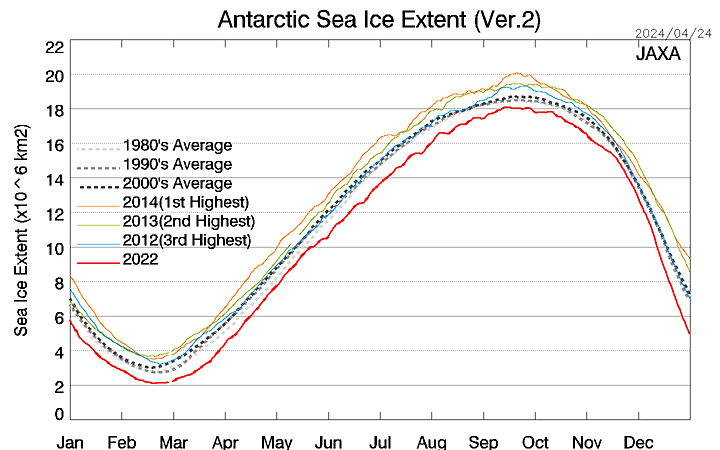
JAXA Antarctic seams to be incorrectly linked.
Fixed, thanks
Fantastic work. Thank you.
Thank you for the update.
I’m working through the NANSEN “click-for-Antarctic-sea-ice extent” events queue. More later.
So JAXA data still exists after all! Thanks for finding it!
Thanks for updating. I check it out almost every day, and have missed the temeprature graph, which I now see if working again.
I think I know where a lot of those views of your Sea Ice Page are likely coming from, Anthony. They will never admit it, but, they respect and trust you. And you deserve it:
December 31, 2013
by Anthony Watts
(Source: http://wattsupwiththat.com/2013/12/31/wuwt-and-weatherbell-help-kusi-tv-with-a-weather-forecasting-request-from-ice-trapped-ship-in-antarctica-akademik-shokalskiy/ )
Here’s to you, Anthony Watts, a true hero, whose persevering dedication to science realism (thus, freedom) is matched by the greatness of his heart.
*************************************
Yes, JohnKnights — one can laugh and cry at the same time.
: )
🙂 and 🙁 (sorry for messing up your last name… was thinking of another commenter R. Knights — will try to remember!)
Great to see the Sea Ice page up and running again. I saw a few snide comments on some greenie web sites recently. This will keep them quiet.
The Jaxa Antarctic “click for latest value” link doesn’t work for me although the Arctic link works fine.
NWS Alaska Ice Desk, shows daily Ice Extent in Alaskan waters, comparable to the Canadian graphic: http://pafc.arh.noaa.gov/ice.php?img=CT
Way down in the “Source Guide”, we still refer to our friend Nick as “Nike” Stokes.
It’s the shoes…
Is Stokes being funded by Big Shoe?
I contacted the Amundsen-Scott web cam people about it being stuck on 4th. January.
They say it is broken but they are working to get it fixed.
I guess sourcing spare parts will not be easy down there
Thanks.
The Sea Ice page (and its links ) is an invaluable resource and I was confused until I realized the page was not updated to 2016.
Here are 2 links which I like alot. Maybe I’ve missed them on your page? Take a look.
http://nsidc.org/arcticseaicenews/charctic-interactive-sea-ice-graph/
http://ocean.dmi.dk/arctic/icedrift_anim/index.uk.php
Thanks. I added the second, the first can’t be added except by link.
Hi Anthony. A possible typo.
The Sea Ice Page Reads: “Drifting ‘North Pole’ Camera (offline until a near one is placed in Spring 2016)
Should that read …(offline until a new one…?
PS: Other than that, it looks great.
Cheers.
Anthony, thanks for updating the Sea Ice page. I refer to it often. It’s a great resource.
Anthony,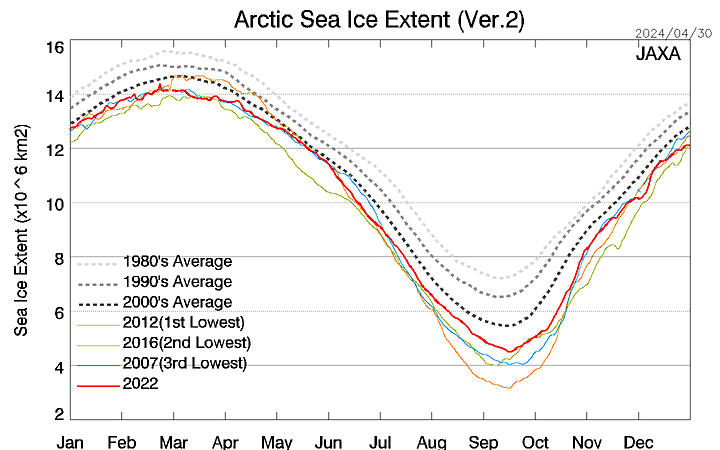
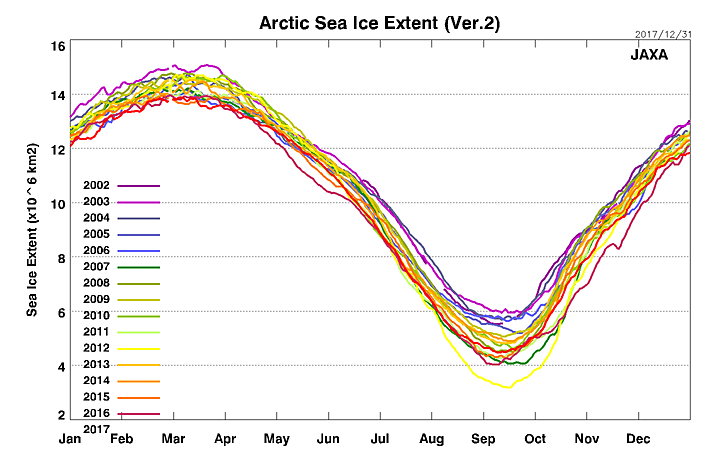
Here are direct links to JAXA data:
These have problems with adblock plus. It has to be disabled. I contacted adblock a few months ago. They fixed it, but the problem seems to be back. I’ll contact them again.
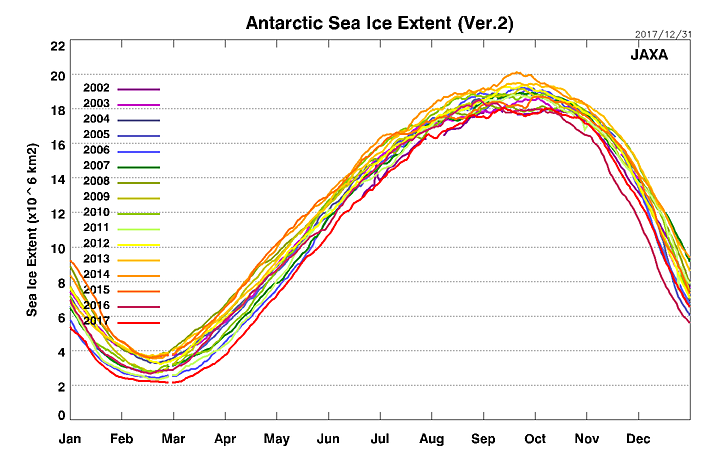
IMO JAXA data should be removed, split into two separate periods.
As Anthony noted at the time they CHANGED the way they calculate sea ice area just before the annual minimum, a couple of years ago. But KEPT the earlier data with the old calculation method.
This means that the data is useless and misleading as a long term record. This is Mike’s Nature Trick On Ice. : apples and oranges on the same graph, grafted together into a continuous line as though it is the same thing.
If the newer method is reckoned to be more accurate ( I have not assessed whether that is the case ) , then the new data merits a new graph.
My personal opinion is, if they are going to mess around like that they should not be regarded as a reliable source of data.
Many many thanks for finding these, I looked but could [not] find them. I’ve added them.