Add another one to the huge list of excuses for “the pause” in global temperature. Reader “Al Gorez” emails:
The climate alarmists have come up with a brilliant new excuse to explain why there has been no “global warming” for nearly 19 years: the satellite data is lying.
And to prove it they’ve come up with a glossy new video starring such entirely trustworthy and not at all biased climate experts as Michael “Hockey Stick” Mann , Kevin “Travesty” Trenberth and “I’d be tempted to beat the crap out of Dr. Pat Michaels” Ben Santer. (All of these paragons of scientific rectitude feature heavily in the Climategate emails) See more at Breitbart here.
Riiight. Because we all know how reliable their preferred surface temperature measurements are, as illustrated by these examples from NOAA’s USHCN climate monitoring network:


![Detroit_lakes_USHCN[1]](https://wattsupwiththat.files.wordpress.com/2011/09/detroit_lakes_ushcn1.jpg?resize=480%2C360&quality=83)
![bainbridge_ga_ushcn[1]](https://wattsupwiththat.files.wordpress.com/2011/09/bainbridge_ga_ushcn1.jpg?resize=480%2C360&quality=83)

Those and hundreds of other stations have been encroached upon by heat sinks and heat sources. And, the proof is in the fact that when you get rid of all the garbage temperature monitoring stations like those shown above (which comprise about 90% of the US monitoring network) and use only the unperturbed stations that don’t have biases that need corrections applied, what you are left with is a lower trend:

Comparisons of 30 year trend for compliant Class 1,2 USHCN stations to non-compliant, Class 3,4,5 USHCN stations to NOAA final adjusted V2.5 USHCN data in the Continental United States

What an act of desperation by these politically oriented climate proponents. NASA GISS, an agency founded to do planetary studies in support of the Apollo program, that should be making use of satellite measurements based on NASA’s strategic plan which has shifted heavily to remote sensing (notice that picture of Earth from space on the cover?), still uses this high polluted, highly adjusted surface temperature data…for one reason only: it supports their narrative, and when their narrative is flowing, so does the funding. I’d wager that NASA GISS would be pretty much out of business due to funding cuts if that hadn’t reinvented themselves after the cancellation of the Apollo program and many other missions in the 70’s and 80’s. They just weren’t needed as much.
Stay tuned, there’s more to this story coming. The full transcript of the video follows (h/t to Monckton):
Here is the video from the “Yale Climate Connections”
Transcript of How reliable are satellite temperatures?
Senator Ted Cruz [described in onscreen text as “Climate Denier”, displaying the graph below, shown onscreen in the video]: According to the satellite data, there has been no significant global warming for the past 18 years:

Dr Michael E. Mann, Pennsylvania State University [The following four terrestrial-temperature graphs, from GISS, HadCRUT4, Japan Met and Berkeley Earth Surface Temperature series respectively, were shown on the video for 1-2 seconds each]: When the full data are available, we will find that 2015 was the warmest year that the globe has seen as far back as we have reliable records.


Dr Mann [continuing]: And what’s ironic is, it’s really those satellite datasets that critics like John Christy hold up, that Ted Cruz was emphasizing in that Senate hearing a week ago …
Senator Cruz: The satellite data are the best data we have.
Dr Judith Curry, Georgia Tech: We need to look at the satellite data. I mean, this is the best data that we have.
Dr Mann: It is those datasets that are subject to the most adjustments – that have historically been found to have been biased, um, actually in the direction of too little warming.
Sinclair: For a decade during the 1990s and early 2000s, climate skeptics John Christy and Roy Spencer argued that their reading of satellite data showed no atmospheric warming … even a cooling. Finally, a series of studies showed that satellite data was not being correctly interpreted. The problem was friction. Even hundreds of kilometers above the Earth, atmospheric friction slows satellites down and they lose altitude. Every year they were falling about a kilometer closer to the Earth. To derive the temperature, scientists need to know the correct altitude, and without that the results were distorted.
Santer: For many years John Christy and Roy Spencer claimed, based on their analysis, that the lower atmosphere was actually cooling. They were wrong. They had gotten, literally, the sign wrong in adjusting for the effects of satellite orbit drift on the sampling of Earth’s large daily temperature cycle.
Sinclair: In addition, this meant that a satellite that started off measuring the temperature at 2 in the afternoon in a few years was measuring at 6 in the evening, making it look like temperature was cooling, when it had not. Although chastened by their repeated mistakes and failures, Spencer and Christy remain very active in questioning the mainstream science of global warming.
Spencer: I can tell you as a temperature monitoring expert, in 50 years we won’t be able to see the effect.
Limbaugh: I got a note today from our official climatologist, Dr Roy Spencer.
Christy: The regulations being established will do nothing to alter whatever the climate is going to do.
Trenberth: When they made corrections they were still underestimated, and they managed to do that at least three times, I think, which was unfortunate.
Dessler: So what does a satellite actually measure? A satellite doesn’t measure temperature: it measures radiance, which means it measures basically photons of energy that the atmosphere is emitting: in fact, what it really measures is a voltage on some detector, and from that it has to infer radiance, which is these photons, you know, that are coming out of the atmosophere.
Schneider: The problems that these photons are emitted not just from the – from the oxygen atoms as in proportion to their temperature but from the surface, from thick clouds, at different elevations.
Dessler: … and then from that they want to derive temperature. How do they do that? Well, they use a model. Now, they don’t call it a model: they call it a retrieval algorithm. But it’s a model. If you look at the history of the satellite data, the model that has been used has been shown repeatedly to be wrong.
Titley: Dr Christy and Dr Spencer, when they put this out, they have been wrong, I think, at least four consecutive times. Each time the data record has had to be adjusted upward. We used to have a negative trend, and then we had no trend, and now we begrudgingly have an upward trend.
Dessler: I don’t want to bash them, because everybody makes mistakes, and I’m going to presume everybody’s being honest, but I would just point out that – imagine the howls we would get if my model predicted it was warmer at night than during the day: you would hear people on the other side just screaming bloody murder: “How can you believe this? It’s, ah, these people are incompetent. How could you possibly believe this model that has the wrong sign of the diurnal cycle in it? The physics is obviously all screwed up.” But of course you don’t hear anybody talking about that with the satellite data. It goes to show you the amount of confirmation bias that’s actually going on in this debate.
Cruz: The satellite data are the best data we have.
Curry: We need to look at the satellite data. I mean, this is the best data that we have.
Dessler: That these people would accept the satellite data completely uncritically because it tells them what they want to hear …
Cruz [displaying the graph below, shown in the video]: You asked about the source of the data on the right chart: it’s actually not Dr Christy’s data, it’s the Remote Sensing Systems – the RSS – data that is up there.

Dr Carl Mears [keeper of the RSS dataset]: I guess it depends on which graph exactly you’re talking about. One of the ones that Senator Cruz likes to show actually uses the data that I make, which is a measurement of the temperature of the middle troposphere over time. The entire dataset actually starts in 1979 and goes to the present. But he probably likes to focus on the part really after 1998. He starts at that time for a very specific reason. And that’s because there’s a huge el Niño then, in ‘97/98, which puts a huge spike in the global temperature. And of course if you start at the top of a hill and you start driving you’re going to go downhill at least in the beginning, and that’s kinda the effect we’re seeing here. You start your time series at a place when it’s really high and it’s pretty easy to get no warming, or even cooling, if you do that.
Titley [at the Senate subcommittee hearing, 8 December 2015]: Ah, 1998, big el Niño, so it’s kind of interesting we start at 18 years: we don’t look at a 15-year dataset or a 10-year dataset or a 20-year dataset. We look at an 18-year dataset.
Cruz [replying to Titley]: I fail to see the significance …
Titley [The graph below is shown in the video]: Senator, it’s not. If you take up that top really big spike and you take that out you start getting the upward bias. And this is what people do when you start looking at these relatively arbitrary times, is you start with a really high number at the left-hand side and that kind of influences your – your, basically, your linear trend:

Titley [continuing: the graph below is shown in the video]: So, when you start looking at things like every decade, you have an upward trend in the data:

Mears [the graph below is shown in the video]: I think the longer the time period you look at the better, and if you look at the longer time period then you get a better idea of what the overall trend is. Senator Cruz focuses on one dataset (mine) from one type of instrument (satellites) and he ignores all the other evidence: for example, the surface temperature record …

Mears [continuing: the graph below is displayed in the video]: … you know, things like the Arctic sea ice declining …

Mears [continuing]: … things like the time of year that plants flower or leaf out or whatever.
Santer [the graph below is shown in the video]: … an increase in the amount of water vapor in the atmosphere, changes in sea level …

Santer [continuing: the graph below is shown in the video] … changes in the heat content of the global ocean …

Mears: All those things he’s ignored, and he’s just kind of glomming on to this one piece of evidence that supports the story he wants to tell.
Santer: Scientists are looking at moisture, at rainfall, at water vapor, at surface humidity, at the cryosphere, at snow and ice, and all of this is telling an internally and physically consistent story, and that story is, the planet is warming and, despite our best attempts to see whether natural causes can explain that warming, they can’t.
Peter Sinclair [Voice-over out of shot, to Mears onscreen]: Now, you were recently – er – doing some fact-checking for the Daily Show, is that correct?
Mears: That’s correct.
Sinclair: What did they want to know?
Mears: They just wanted to know, you know, they wanted to fine-tune their statement about, you know, whether , you know, the surface temperatures are more accurate or the satellite temperatures are more accurate, and initially they wanted to say something like “But you really shouldn’t trust the satellite temperatures, you should go with these surface temperatures”, and I said, “Well, what I would like to emphasize, you’d really want to look at all the different datasets, so you don’t want to trust only the satellite temperatures, you want to look at the surface temperatures, and – and that sort of thing.
Sinclair: OK, er, has Senator Cruz called you for any fact-checking?
Mears: No, he has not.
Sinclair: OK.
Credits
A production of
Yale Climate Connections
With support from
The Grantham Foundation for The Protection of the Environment
Produced at
Greenman Studio
Midland, MI
Editing, Script, Camera
Peter Sinclair
Interviews
Peter Sinclair
Thanks to
American Geophysical Union
Ben Santer PhD
Livermore National Lab
Andrew Dessler PhD
Texas A&M University
Michael Mann PhD
Pennsylvania State University
Admiral David Titley PhD
Pennsylvania State University
Carl Mears PhD
Remote Sensing Systems
Kevin Trenberth PhD
National Center for Atmospheric Research
Judith Curry PhD
Georgia Tech University
Video
BBC
NASA
CSPAN
Stanford University
Just ignore the uncontaminated surface record or the new pristine set of US stations which both compare well with the Satellite record, oh as do the weather balloon records then the video could look compelling to the uninformed masses which was probably the intent.
What the new pristine CRN stations do compare very well with is the old USHCN network:
You can’t pull that one Nick.
Even you are enough of a mathematician to realise that temperatures measured on different systems can NEVER match this well (see below), unless one of those sets is specifically being adjusted to match, so that you could make the statement you have just made.
http://www.ncdc.noaa.gov/temp-and-precip/national-temperature-index/time-series?datasets%5B%5D=uscrn&datasets%5B%5D=cmbushcn¶meter=anom-tavg&time_scale=p12&begyear=2005&endyear=2015&month=12
“unless one of those sets is specifically being adjusted to match”
So which dataset do you think is adjusted? By Dr Karl with his pencil?
And how and when? USCRN data are published daily. USHCN stations are in GHCN Daily. Mostly you can get hourly or better updates.
I’ve asked this before but have not received an answer, but maybe nick will weigh in. They set up this Climate Reference Network, apparently to be”the reference”since that’s in the name. But then they started out the CRN data at an anomaly of +0.9 instead of zero.
Does that make sense to you Nick? To set your reference to something other than zero?
Poor Nick, It really is tough that USCRN has put such a dampener on fabricated warming in the USA.
But remember, they still have the rest of the world to work with. 😉
So, based on your chart, if we plotted a trend line, it would show that there was a DROP in temperatures during the 8 year period between 2005-2013 of 1.25F in the United States. Right?
I gather that the USCRN is some expurgated version of a previously existing but larger network of measuring stations.
But it consists of stations, which are believed to be less contaminated with parked SUVs and concrete/asphalt, and University climate science buildings.
Ergo, by definition, the USCRN network is spatially undersampling the global climate continuous function map to an even greater extent than the old network.
So all that points out is that the surface station network is quite unsuitable for determining a true global mean Temperature.
Also it is my understanding, that many of these surface stations do not really measure Temperatures with a thermometer, but instead they base their readings on a model of a resistor which has a highly non linear proxy relationship to real Temperature.
To get a real correct global mean Temperature you have to directly measure the Temperature at each station with a real thermometer.
So just what is a real Thermometer.
Well it is the Temperature measuring process that is built into the SI units system that defines what the kelvin Temperature scale is; i.e. the thermodynamic Temperature scale.
g
Speaking of Tom Karl.. any idea what his next BOGUS ocean warming stunt will be?
Any advanced knowledge… are you in on the fix, Nick ?
You know he will need to come up with something once the current El Nino subsides.
Regarding CRN vs. USHCN
This could be a post in and of itself, but it has an excellent place in this thread.
Okay, I am going to put one hell of a cat among the pigeons. CRN cats, HCN pigeons. I ran a thought experiment. I took us out on a limb a little because I was doing actual prediction based on a hypothesis — classic science — and that sometimes involves the throw of the intellectual dice. But I was confident enough of what I was going to find such that I considered the risk minimal. Besides, I just do things. It is in the nature of servants of chaos.
Anyway, I was getting sick and tired of reading about how other people said the two matched perfectly. So I asked the unaskable question: Does it, really? I figured, hey, I have the data for HCN 05-14. I have anomalized and regionally gridded it. And I have the data for CRN (no gaps, so no anomalization needed.)
So since I have all that, why not just do a Willis and, like, run them numbers myself? But first I had to place bets. Not risky and not enough to break the bank, mind, but, you know, … bets.
I made three HCN/CRN predictions based on what our team has found. Said I’d be back with the results, win, lose, or draw. Here it goes.
PREDICTION 1
Regardless of whether or not there is any trend, the differences between summer and warmer temperatures should be greater for HCN than for CRN (2015-2014). This should not only occur a an overall result, but also in a large majority of years. A positive result would suggest heat sink effect in operation on an annual/seasonal basis as well as for longterm trends. (It should work for both.)
RESULT: Yes, in all years, and increase in trend of difference.
CRN, S-W
Summer – Winter 2005: 17.30
Summer – Winter 2006: 16.03
Summer – Winter 2007: 17.35
Summer – Winter 2008: 17.38
Summer – Winter 2009: 16.75
Summer – Winter 2010; 18.35
Summer – Winter 2011: 18.55
Summer – Winter 2012: 15.40
Summer – Winter 2013: 17.60
Summer – Winter 2014: 17.95
AVERAGE: 17.3C
TREND: 0.07C/d
HCN, S-W
Summer – Winter 2005: 18.95
Summer – Winter 2006: 17.72
Summer – Winter 2007: 19.32
Summer – Winter 2008: 17.38
Summer – Winter 2009: 16.75
Summer – Winter 2010: 20.22
Summer – Winter 2011: 20.47
Summer – Winter 2012: 16.93
Summer – Winter 2013: 19.79
Summer – Winter 2014: 20.20
AVERAGE: 19.2C
TREND: 0.11C/d
PREDICTION 2
If there is any overall trend from 2005-2014, the TOBS-adjusted HCN trend should be larger than the CRN trend.
RESULT: Yes. By ~0.14C/decade.
And, yes, there is a trend. A distinct cooling one. The poorly microsited HCN has exaggerated it substantially as compared with the well sited CRN. And, no, HCN and CRN do not track each other at all well. If you disagree, then run the numbers, yourself.
USHCN Anomalized
TOBS Tmean TREND
(100/th Deg. Celsius)
2005: 20
2006: 56
2007: 22
2008: -58
2009: -52
2010: -10
2011: -7
2012: 113
2013: -51
2014: -40
Trend: -0.39C/d
USCRN (Non-Anomalized)
Obs. Tmean TREND
(Deg. Celsius)
10.53
2006: 10.87
2007: 10.58
2008: 9.91
2009: 9.88
2010: 10.27
2011: 10.39
2012: 11.46
2013: 10.00
2014: 10.1
Trend: -0.25C/d
PREDICTION 3
If there is any overall trend from 2005-2014, HCN homogenized data should magnify that trend over HCN TOBS-adjusted data, same as it does for the unperturbed 1979-2008 set.
RESULT
Yes. This is consistent with the small amount of magnification by homogenization added to the unperturbed poorly sited stations form 1979 to 2008. About 0.01C/decade.
USHCN Anomalized
TOBS Tmean Trend
(100/th Deg. Celsius)
2005 20
2006 56
2007 22
2008 -58
2009 -52
2010 -10
2011 -7
2012 113
2013 -51
2014 -40
Trend -0.39
USHCN Anomalized
Homogenized Tmean Trend
(100/th Deg. Celsius)
2005: 20
2006: 58
2007: 23
2008: -57
2009: -53
2010: -11
2011: -5
2012: 115
2013: -51
2014: -41
Trend: -0.40
All in all, very strong results, entirely consistent with our previous results. They do not prove the hypothesis, but they provide heavy support.
It also tells us that it is possible, with caution, to use the microsite hypothesis as a predictive tool. That is where hypothesis meets theory. So far, so good.
As for those who claim HCN and CRS are the same, what I want to know is what they were doing. And what they were not doing. (Did they not grid. Did they not anomalize? What did they do?)
Evan,
To follow this, you need to give a lot more detail. Or better, code.
USHCN – are you using adjusted? Raw? How did you anomalise? How gridded?
USCRN – you say not anomalised. Just averaged as is? What if you do anomalise? It would be better, just for apples sake.
Is the difference in Pred 1 significant?
Prediction 2 – the USHCN trend is a lot less than USCRN. Prediction fail.
Prediction 3 – the difference is tiny – certainly not significant.
Evan,
The other thing I should say is that the plot I showed is NOAA’s and it is of their published ClimDiv average vs CRN. And it is the published average that people see. The published average agrees in anomaly with CRN. You are recalculating it and maybe getting something else. What does that mean? That NOAA should compute the average your way, so you could say it is wrong?
” or the new pristine set of US stations which both compare well with the Satellite record”
This I assume is the USCRN, US climate reference network.
NO adjustments, and NO warming in the past >10 years since the inception of the network.
The trends over the USA of the satellite data match very closely to the trends in USCRN and ClimDiv.
That VALIDATION shows that the extraction algorithms for the satellite temperature are doing a pretty good job..
” or the new pristine set of US stations which both compare well with the Satellite record”
This I assume is the USCRN, US climate reference network. (search WUWT for USCRN to see the nice graph)
NO adjustments, and NO warming in the past >10 years since the inception of the network.
“…as do the weather balloon records”
My understanding is that the satellites are calibrated against the radiosondes. If so, it’d be kind of a surprise if the two didn’t match pretty closely.
As soon as I look at USCRN vs USHCN, I say……… BULLS**T !!!
http://www.ncdc.noaa.gov/temp-and-precip/national-temperature-index/time-series?datasets%5B%5D=uscrn&datasets%5B%5D=cmbushcn¶meter=anom-tavg&time_scale=p12&begyear=2005&endyear=2015&month=12
There is NO WAY that the scummy USHCN data can match USCRN that closely without there being one heck of a lot of adjustment and fabrication going on.
Calibrated against correct.
Adjusted continuously to match?
I doubt.
Don K, I am pretty sure your statement is incorrect. UAH calculates absolute atmospheric temperature zones from MSU sensors at various frequencies, adjusting for stuff like orbital drift, aperture, and possible differences between satellites (a true calibration).
It does NOT calibrate the net result to radiosonde temps. It VALIDATES the calculated results using a completely independent measurement system, actual thermometers carried aloft by weather balloons. (Well, OK, battery powered telemetry thermistors, essentially thermometers,)
A distinction between calibration and validation, with a difference as lawyers would say.
“Does that make sense to you Nick? To set your reference to something other than zero?”
The actual CRN data is in degree F absolute. I think you are referring to the interactive diusplay on the NOAA site here. If you check the background page there, they explain. With only 10 years of data, you can’t use a mean of the actual CRN data. So for the display they compute climatologies for the 1981-2010 period from nearby USHCN stations. That is the base period, and the CRN data is at the high end of it and beyond. As they also explain, a common base period allows comparison.
Fun little interactive graph that Nick linked to, if you like to play with temperature anomalies instead of actual temperatures. If you click on the graph with your mouse, you can then drag the data around until the zero line is actually on the bottom of the graph, which is cool. So I clicked on the “maximum” anomaly data, and pulled the zero line to the bottom and guess what it showed me? It showed that out of the past ten years of maximum anomaly data, only three years out of the ten show an anomaly above that zero line. 🙂
Nick, there is no way to compare between hcn and CRN in absolute temperatures.
But after they went to all the trouble and expense to set up this pristine new “Reference Network” wouldn’t it make more sense to start measuring from zero?
Why pollute your pristine new reference network with data from 25 years before it existed that wasn’t fit for purpose in the first place by using it to set the initial conditions for all future anomaly comparisons?
“Does that make sense to you Nick? To set your reference to something other than zero?””
They take a fudged reference point from a fudged data set.
Its totally meaningless.
Don K,
You’re correct, satellite data is corroborated by radiosonde balloon data:
In that time frame there were about seventeen thousand radiosonde balloon temperature records in 4 datasets. They closely match the 2 satellite datasets. Others like GISS, NOAA, and USHCN don’t match, nor do climate models.
This video was made by serial propagandist Peter Sinclair (“potholer”). He is no different from John Cook. Sinclair has made numerous ad hominem videos trying to smear Lord Monckton, and other alarmist videos. The truth is not in him.
And what are the surface stations calibrated against?
Surface stations are calibrated against the expectation of a warming trend.
Yep, that was the most glaring omission. Not one word about Radiosonde data.
They say they can’t find a natural cause, but they don’t hold their own ideas to the same scrutiny.
According to the CO2 model, it must cause the atmosphere to heat first, which then filters down to the surface and the oceans. Since the warming they claim to see at the surface and in the ocean is running far ahead of any warming of the atmosphere shown by satellites or radiosondes, then their explanation is wrong. They have exonerated natural climate variability, but since the evidence contradicts CO2 as the culprit under their own models, they should keep looking.. Kind of like OJ saying he wasn’t responsible, but would spend his time looking for the “real killer”.
They have tried to turn the scientific method on its head by saying skeptics have to disprove their assertion rather than them proving it. But there is nothing at all scientific about what they are trying to do.
They can’t find a natural cause for the well known swings in global temperature over the last 10K years either.
But don’t worry, the current temperature swing must be caused by CO2, because the models prove it.
/sarc
Video killed the radiosonde.
It is easy to say so and so data is of good quality and so and so data is of poor quality. In climate, globe is covered by climate systems and general circulation patterns. The basic point that must be looked in while qualifying a data set is that the met network must cover areas of climate system and general circulation patterns.
We don’t have such network under surface measurements. Nearly 75-80% globe hasn’t coved by met measurements. On land majority of the met stations are located in urban areas with rapid spatial and vertical expansion affecting with land surface by converting it in to concrete jungle and destruction of greenery and water bodies along with the increased levels of pollution. Met network is sparse in rural areas even though rapidly the environment is changing from rainfed dry-land to irrigated wetland agriculture. Thus rural areas are covering the land with greenery more time in a year. Thus, the major contamination of ground based observations on land is the positive bias in urban data and negative bias in the rural data.
Two-thirds of the globe is covered by the Oceans but unlike on land there are no permanent met stations in the ocean area. Ocean data represents a sparse network — prior to 1990, mostly through ships movement the observations were collected. After 1990 though buoys built the network but this is not going to account the filth effect over sea surface. The spread of filth over land and oceans is non-linearly increasing with the time, which comes under ecological changes [under land and water cover].
Surface measurements were made in oF up to 1956 and there onwards the measurements were made in oC. In averaging the temperature, the second place of decimal is rounded off based on odd or even number in the 1st place of decimal to first place of decimal.
Ground based average temperature is derived from the averaging of maximum and minimum, thinking it follows a sine curve with the duration of day and night are the same. In reality it is not so. If you take the hourly average data from the thermograph, the day average may or may not be equal to the average of maximum plus minimum based on the degree of skewness in the 24-houly thermograph data from the sine curve that vary with the cloud conditions and duration of day and night.
All these are negated in the satellite data as they cover climate system and general circulation patterns on the one side and urban and rural changes, filth cover, etc that are taking place with the progression of time.
Dr. S. Jeevananda Reddy
To create a warming trend, you either have to reduce older temperatures or increase recent temperatures or both. If you have done this and yet we are now seeing record temperatures, doesn’t that imply the adjustments are reasonable?
If the surface global temperature trends have been falsely constructed by data adjustments, doesn’t that mean that recent record high unadjusted global temperatures are even more incredible?
Sammydj :
You ask
Only an idiot could honestly think “record temperatures” could “imply the adjustments are reasonable”. “Records temperatures” are probably an artifact of the “adjustments” (i.e. the unjustifiable alterations).
And the alterations to past data are outrageous; see this.
The method for constructing the global and hemispheric averages from surface temperature station data changes almost every month. Take few minutes off from trolling and read
Sammydj:
My post ‘went’ before completion. Sorry.
I intended to conclude saying
The method for constructing the global and hemispheric averages from surface temperature station data changes almost every month. Take few minutes off from trolling and read this.
Richard
‘ “Records temperatures” are probably an artifact of the “adjustments” (i.e. the unjustifiable alterations).’
Are they? So you are saying that recent temperatures are being adjusted upwards to fit in with an artificially created historical trend!
Utter rubbish and conspiracy.
“Only an idiot could honestly think “record temperatures” could “imply the adjustments are reasonable”.”
Abuse. Childish.
Sammydj:
You ask me and assert
Yes! They are!
I provided you with this link> which demonstrates “that recent temperatures are being adjusted upwards to fit in with an artificially created historical trend”. Making the one mouse click seems to have been too difficult for you (which is not surprising in light of what you have written).
I made no assertions of “conspiracy”.
And I wonder why warmunists always make untrue assertions about conspiracy theories which don’t exist whenever thay are shown to be wrong.
I also provided this link and I asked you to read it. It is a Parliamentary Sub mission so would be a criminal offence if untrue. Only an idiot could read that link then honestly write your replies to me that I am replying.
Importantly, very importantly, I am deeply offended by your assertion that I said anything that was “abuse” and/or was “childish” in response to your outrageously untrue, illogical and abusive nonsense.
Richard
My reply to the egregious troll has severe formatting error so this is a resend that I hope is corrected.
Sammydj:
You ask me and assert
Yes! They are!
I provided you with this link which demonstrates “that recent temperatures are being adjusted upwards to fit in with an artificially created historical trend”. Making the one mouse click seems to have been too difficult for you (which is not surprising in light of what you have written).
I made no assertions of “conspiracy”.
And I wonder why warmunists always make untrue assertions about conspiracy theories which don’t exist whenever they are shown to be wrong.
I also provided this link and I asked you to read it. It is a Parliamentary Submission so would be a criminal offence if untrue. Only an idiot could read that link then honestly write your replies to me that I am replying.
Importantly, very importantly, I am deeply offended by your assertion that I said anything that was “abuse” and/or was “childish” in response to your outrageously untrue, illogical and abusive nonsense.
Richard
You don’t see your abuse when it is quoted back at you RSC?
As for your graphics – they are meaningless – without even being able to trace them, I would say that, given that they each depict anomalies from a long term mean, the differences would be attributable to the changing mean not changes to the global temperatures.
But you confirm your willingness to subscribe to unproven and irrational conspiracy.
Show me your proof that recent GISS global temperatures are being artificially adjusted upward or else apologise for deception.
“Show me your proof that recent GISS global temperatures are being artificially adjusted upward or else apologise for deception.”
Do you agree they are being adjusted at all?
If you do, where is your proof they needed to be adjusted, and the expert who was there when they were recorded to know exactly how they should be changed?
Sammydj:
I made no abuse of you. I merely stated fact.
And I provided EVIDENCE of my statements which have refuted your falsehoods.
On the other hand, you – an anonymous troll – have spouted abuse.
And you have made untrue assertions that cannot be defended and I have refuted.
Your failure to read the evidence is merely more evidence that either you are an idiot – which I don’t believe – or you are disingenuous: there are no other possible explanations for your behaviour.
Having failed to address the information I have given you, you now demand
Type ‘GISS adjustments’ in the WUWT Search facility and you will be inundated with evidence.
Now, egregious troll, apologise for your implication that I would behave as you do then crawl back to wherever you have come from.
Any interested observers can see the evidence I have presented which reveals your misrepresentations. And that revelation is the only reason I refute the misrepresentations of egregious trolls.
Bluster all you want: it does not change reality.
Richard
To repeat your abuse: “Only an idiot could honestly think…”
As for your claim – if you have proof GISS adjusted global temps to create a trend and are now adjusting global temps to extend the trend, you’d publish a paper and be famous – and Anthony would be taking you seriously.
You don’t and you’re not – you’re just a person that is willing to make idiotic unsubstantiated claims on a website where that is encourage and tolerated – it’s called Group Think.
Grow up.
Sammydj:
Dear boy, when you grow up you will understand that I have NOT given you abuse but you have abused me.
Providing you with evidence and information is NOT abusing you.
But your childish response is to refuse read (possibly because you cannot) any of the evidence and information I have provided and to pretend to be hurt. Your responses to me amount to you whining, “That nasty scientists is assaulting me with evidence and information which he says I should be able to understand”.
If you had read this link which I have repeatedly provided you then you would not have written such untrue, offensive and abusive nonsense as this.
Indeed, you will have a right to comment on my publication record when you have published as I have.
Strewth! I detest oleaginous trolls!
Richard
Ah yes, the Internet knows who you are and also what you are not Mr Courtney. Explains a lot and why you don’t even understand the graphics of Hansen that you put up as faux evidence.
You have no credibility.
Please view the video on YouTube
then vote (thumbs up or thumbs down) under the video to the right. Right now it shows more thumbs up, but I can’t believe this is really the case. Show these people what the public thinks. Go out there and vote!
One more thing – click on the YouTube icon at bottom right of video above to go to the YouTube site where you can vote.
Evan, To follow this, you need to give a lot more detail. Or better, code.
I’ve nver been asked for code before. I no longer feel like a complete wallflower.
It’s just Excel, actually. It’ll be archived along with the rest. But you don’t even need our ratings for this, all you need is the usual CRN and HCN data, which you already have (I think).
USHCN – are you using adjusted? Raw? How did you anomalise? How gridded?
Says so up top. Using TOBS data because I haven’t skinned out the perturbed stations for the 2005-1014 set yet. And some of the ratings would have to be updated.
But raw, TOBS, and adjusted data and are pretty close by this time. Most of the MMTS conversion and TOBS flips have already occurred. I’d guess we have at least 800 perturbed for that interval, likely more.
It is gridded by region and area-weighted (same as we do in the paper). Stations are independently anomalized to their own baselines (standard method approved by Doc. N-G, tested many times).
USCRN – you say not anomalised. Just averaged as is? What if you do anomalise? It would be better, just for apples sake.
Well, sure, but it shows exactly the same trend either way. And it was yet more work, so I just didn’t do it. I am using the observational set, but CLIM is quite close.
Is the difference in Pred 1 significant?
I don’t know for sure, but I’d bet it is. The odds of all ten years to come up heads is a thousand to one in and of itself. 2C difference? No Close calls? I’d lay significantly long odds it is. But, like W. the Peacemaker over on jc likes to repeat (over and over and over), “NG got us covered.” He’ll determine for sure.
Prediction 2 – the USHCN trend is a lot less than USCRN. Prediction fail.
Heh. No, it’s a lot more. A lot cooler that is. Strong CONUS cooling trend from 2005-2014, you know. The whole point is that bad siting amplifies trends. It makes warming trends warmer — and cooling trend cooler.
Even the wiggles work.
Prediction triumph.
Prediction 3 – the difference is tiny – certainly not significant.
And that’s the point, isn’t it? We would expect the same thing to happen to the lousy-sited but TOB-adjusted HCN at large as happens to the unperturbed Class 3\4\5s.
Homogenization bumped both roughly equivalent sets ~.01C/d warmer. If the difference were not small and insignificant, the prediction would be a fail.
Evan,
The other thing I should say is that the plot I showed is NOAA’s and it is of their published ClimDiv average vs CRN. And it is the published average that people see. The published average agrees in anomaly with CRN. You are recalculating it and maybe getting something else. What does that mean? That NOAA should compute the average your way, so you could say it is wrong?
I wouldn’t know what NOAA does to its data between the copy-paste and the press release. I just used their data and our standard methods.
Notably, the defensive video fails to note anything about the “corrections” to the surface temperature data, or the balloon/radiosonde data set. Nice try:)
” fails to note anything about the “corrections” to the surface temperature data”
Here (from here) is a plot of the corrections to GISS in the last 10 years, compared to the difference made to UAH in just one change last year. Each dataset is set to the same anomaly base 1981-2010, and cover the satellite period. The GISS curves are differences (1981-2010) between current and archived versions from 2011 and 2005.
http://www.moyhu.org.s3.amazonaws.com/2015/12/uahadj1.png
Nick, what about all of the ‘adjustments’ that GISS made to the dataset from the early 20th century? You know the ones that account for over half of the observed warming in the past century. GISS has been hopelessly trashed with bogus adjustments and corrections. These have been discussed numerous times both here and on Climate Audit. Nice try on the bait and switch though.
Yes, and here’s a plot of UAH v6 tlt gl vs. CERES EBAF ToA Ed2.8 global OLR between March 2000 and July 2015, Nick, on whose pretty striking match you commented: “well, I didn’t think the correlations were all that good”:
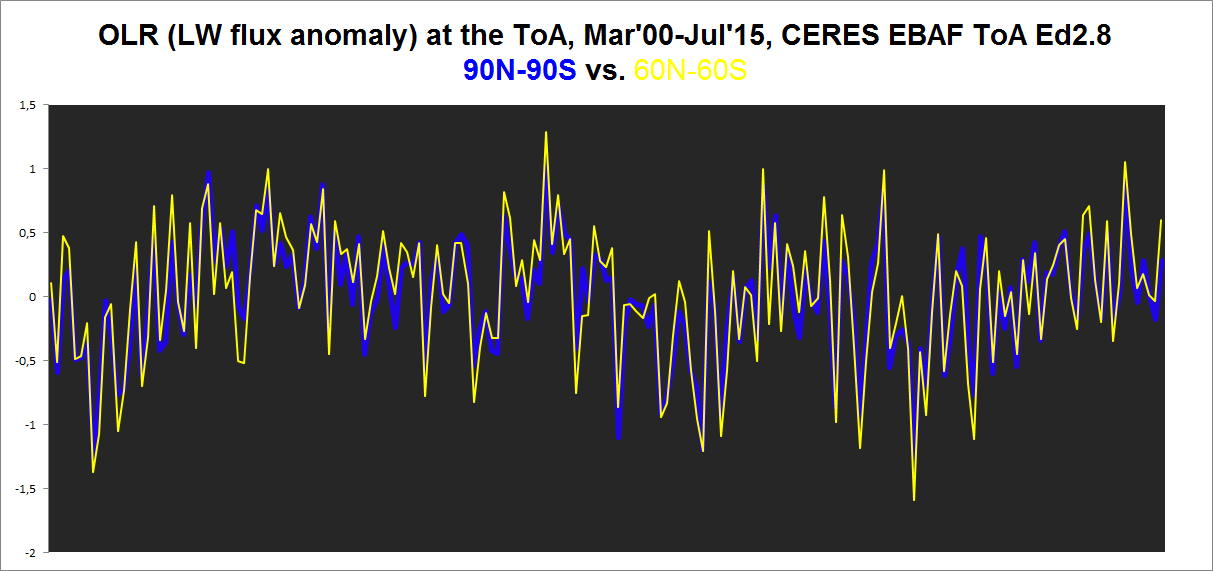
The plot explained here:
https://okulaer.wordpress.com/2016/01/07/uah-v6-vs-ceres-ebaf-toa/
CERES OLR at the ToA, 60N-60S vs. 90N-90S:
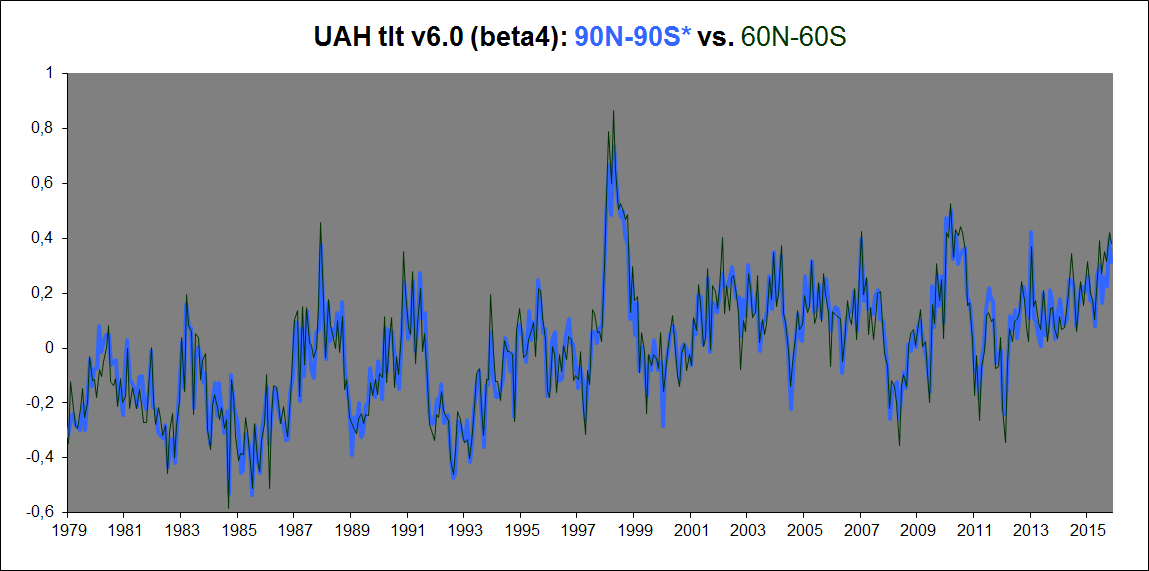
UAH.v6 tlt, 60N-60S vs. 90N-90S:
OI.v2 SSTa, 60N-60S vs. 90N-90S: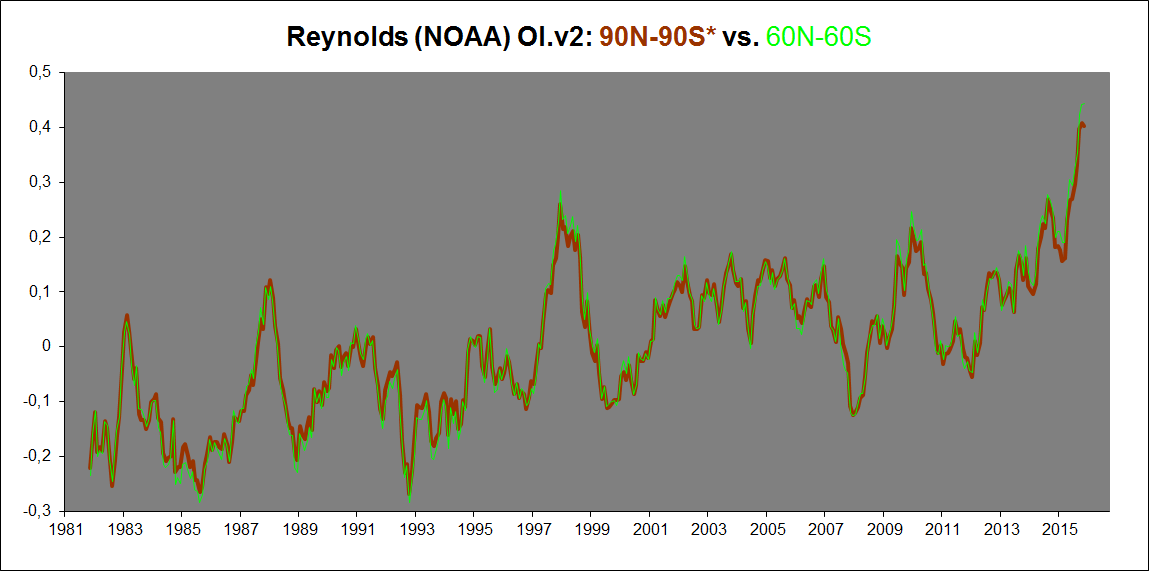


ERSST.v4, 60N-60S vs. 90N-90S:
HadCRUt3, 60N-60S vs. 90N-90S:
No steepening trend when going from 60-60 to 90-90 in any of these, Nick!
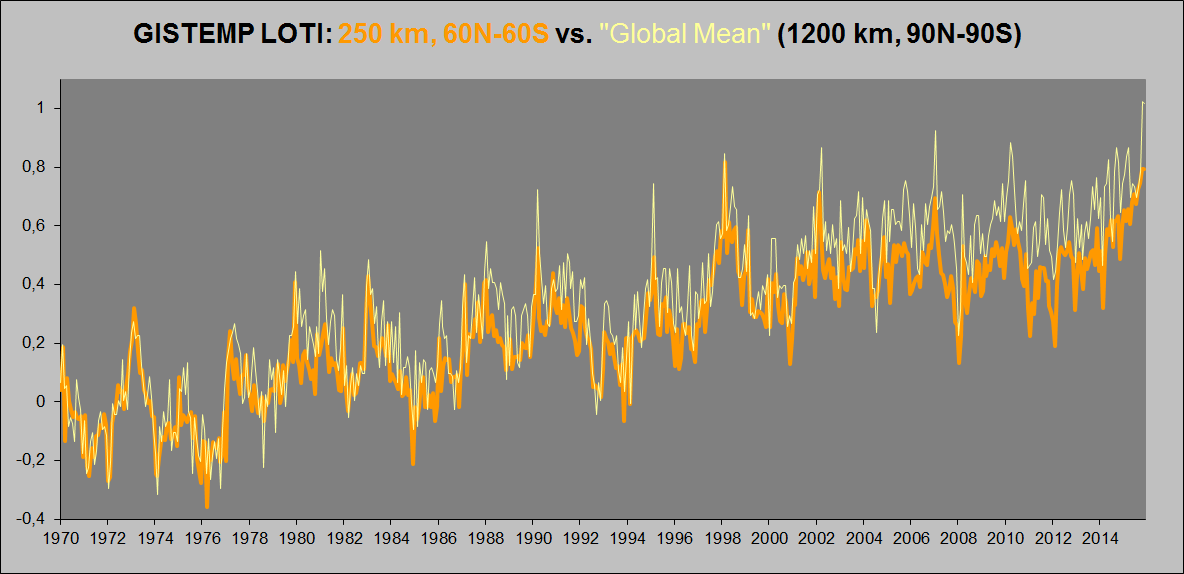
But then there’s GISS, of course …
GISTEMP LOTI, 60N-60S vs. 90N-90S:
What bullshit!
Here’s how GISS’s land mask apparently doesn’t work N and S of ~55 degrees of latitude (SSTs largely replaced by land data):
Explained here:
https://okulaer.wordpress.com/2015/12/23/why-gistemp-loti-global-mean-is-wrong-and-hadcrut3-gl-is-right/
Originally from here:
https://bobtisdale.wordpress.com/2012/04/13/the-impact-of-giss-replacing-sea-surface-temperature-data-with-land-surface-temperature-data/
Nick
It would help a lot if you put the graph above on the same scale temperature scale as the other graph you put up. Otherwise people cod accuse you of manipulating the information.
The uncertainty in UAH was estimated as 0.1°C and the difference between V5 and 6 is close to what it was between V5 and RSS. The problem with GISS is this
http://realclimatescience.com/wp-content/uploads/2016/01/2016-01-10-10-51-29.png
Instead of explaining why the rate of warming before 1940 was as much as in the second half of the 20thC, the data is adjusted to increase the trend only for the late 20thC.
“It would help a lot if you put the graph above on the same scale temperature scale as the other graph you put up.”
The first graph was from NOAA. It is of US anomalies, and is in °F. The second is of differences in global anomalies. Do you think I should convert to °F?
Why do you think the scale should be the same? The lead post has numerous plots, all with different scales.
Poor old St Glow- bull Nick.
You try so hard to promote the BS but there are too many sharper pencils (readers and contributors) who know the science and the tricks you and your fellow warmist are PAID to produce.
PS: WUWT = 259,459,740 views
Nick Quoted-” fails to note anything about the “corrections” to the surface temperature data”
Nick Replied- with NOTHING whatsoever about corrections to the surface temperature data.
And successfully distracted everyone back to the satellite data. Gotta watch this guy folks.
“Nick Replied- with NOTHING whatsoever about corrections to the surface temperature data.”
Did you read it? I plotted changes to GISS between 2005, 2011 and now. They are much less than just one correction to UAH.
Nick Stokes-
Tom Halla origincally stated- “Notably, the defensive video fails to note anything about the “corrections” to the surface temperature data, or the balloon/radiosonde data set. Nice try:)”
Still laughing. Let me clarify-
You responded, by quoting Tom in a cropped manner- ” fails to note anything about the “corrections” to the surface temperature data” and then posted more changes to the satellite data…NOT by noting ANYTHING about corrections to the SURFACE TEMPERATURE data…(surface temperature data and balloon radiosonde data comes from THE surface…surface monitoring stations and surface launched balloons Nick…not satellites. Satellites do not collect surface temperature data Nick. The video even said that! They collect other data which is then fed through a model which calculates surface temperature changes.) You instead posted more “corrections”/changes made to satellite data. Which I don’t think is what Tom was referring to. Which is why I found it all hilariously off topic. And getting funnier all the time.
Michael, why do you think that Nick chose 2005 as his starting date.
an automatic computer algorithm searches for breakpoints, and then automatically adjusts the whole prior record up or down by the amount of the breakpoint
http://wattsupwiththat.com/2014/06/10/why-automatic-temperature-adjustments-dont-work/
“In theory, one could argue that the computer models are accurate, and that the real measurements have some problem. However this is not the case. An incredible amount of work has been done to make sure that the satellite data are the best quality possible. Recent claims to the contrary by Hurrell and Trenberth have been shown to be false for a number of reasons, and are laid to rest in the September 25th edition of Nature (page 342). The temperature measurements from space are verified by two direct and independent methods. The first involves actual in-situ measurements of the lower atmosphere made by balloon-borne observations around the world. The second uses intercalibration and comparison among identical experiments on different orbiting platforms. The result is that the satellite temperature measurements are accurate to within three one-hundredths of a degree Centigrade (0.03 C) when compared to ground-launched balloons taking measurements of the same region of the atmosphere at the same time.”
http://science.nasa.gov/science-news/science-at-nasa/1997/essd06oct97_1/
You know how close to the target by the amount of flak. A video put out by Yale, funded by Grantham.
You reminded me of something Burt Rutan said. It was something to the effect that the more processed the data, the more likely it was part of an attempted fraud.
I couldn’t find the quote but I did find this 2011 presentation. Holy smokes. Ninety eight pages of excellence. He does the best big picture demolition of CAGW that I have seen. I have seen other, shorter, presentations that he did but this is the first time I had seen this one. Awesome.
He still makes a basic wrong assumption, although it doesn’t invalidate his arguments. We never “recovered” from the last Ice Age, people are seeing it the wrong way around. Right now “Ice Age” is the normal state of affairs on the planet, we are living in the unusual interglacial.
The correct reference frame is that when the bottom drops out, the planet will be “recovering from the interglacial.” 😉
I have no doubt there is a lie involved in this (again). And it looks like the alarmist experts on prevarication are on the job.
(Santer testimony above)
Natural climate drivers are the null hypothesis, which does not NEED to be “explained.”
The burden of proof is still firmly on the AGWers
who have NEVER made a prima facie case,
much less produced evidence,
that human CO2 emissions drive the climate of the earth.
That is, the burden of proof has NEVER shifted to the science realists (to disprove AGW).
Not one quantitative measurement makes AGW conjectured causation likely, much less, highly likely.
All they have is speculation.
@ur momisugly Santer, et. al.,
THE BURDEN OF PROOF IS ON —> YOU.
+1e12!
Thank you, Bart 🙂
Measurement error there Bartemis.
It’s actually +1e13
😉
Top stuff Janice!
And, DAVID SMITH! 🙂
Thank you, ten trillion times, thank you!
Excellent, exactly!!
But, but…Janice….they got models !!! ROTFLMAO …..
But, Marcus. The science giants of WUWT have… data. 🙂
And, Hi.
And…. after reading the thread again…. I CAN’T HELP IT….
GO, WUWT MEN AND WOMEN, GO!! — ((blam))!! ((blam))!! …. , one-after-another, knockin’ those wild pseudo-science pitches of the Team Enviroprofiteer (mascot: a weasel) outta the park!! Even with the bad pitching of Santer, et. al., YOU SCIENTISTS FOR REALITY SLAM THEM TO THE WALL!
despite our best attempts to see whether natural causes can explain that warming, they can’t.
==================
the failure isn’t with natural causes, it is with lack of knowledge. You can’t explain why the climate changes naturally. yet there is plenty of evidence it does,
so why would you expect something you can’t explain to explain something you don’t understand?
Ferd…I adore you!
“the failure isn’t with natural causes, it is with lack of knowledge. You can’t explain why the climate changes naturally. yet there is plenty of evidence it does, so why would you expect something you can’t explain to explain something you don’t understand?”
Gonna call that “Berple’s Law”
“Dessler: I don’t want to bash them, because everybody makes mistakes, and I’m going to presume everybody’s being honest,…”
Everybody except you and your fellow cohorts who don’t admit that the satellite data remains better than the heavily distorted ground station data, most likely since that doesn’t match the narrative you wish to peddle.
Some knowledge, not expertise. The big problems with land/sea sutface records are lack of coverage (polar regions, Africa, parts of South America and eastern Siberia, the oceans), urban heat island effects, and microsite issues (why USCRN was set up). AW’s post images show examples of the latter two vividly. So, lacking or shonky data from the gitgo. And all the manipulative ‘fixes’ tend to cool the past, for example erasing the historically hot US 1930s, or Reykjavik warmth in the 1940s along with the causative 1940s SST blip that climategate emails showed warmunists wanted to ‘disappear’.
The big issues with satellites are orbital decay and aperture (MSU sensors don’t see a uniform atmospheric depth due to Earth’s curvature). Decay is fixable because known, and aperture is mathematically tractable. UAHv6.0 is an improved aperture algorithm.
The big advantage of land/sea is that is where we live. The big advantages of satellites are two. First, they see the lower, middle, and upper troposphere where the biggest AGW changes are supposed to take place (e.g. modelled but non-existant tropical troposphere hotspot). Second they have been ground truthed by radiosondes (weather balloons), as the linked Breitbart article points out. It is impossible to ground truth vast swaths of non-existant surface data that just gets infilled to produce a land/sea surface guess.
ristvan
Two very minor points. First, RSS and UAH cover, I believe, 83N to 83S wheras the surface data sets attempt to include the poles (At least there’s a thermometer at one of the poles so they don’t have to guess at the temp there based on the temp at a site 1000km distant. And said instrument may be pretty accurate. I’d bet on minimal UHI at the South Pole. But the 3km elevation may be a problem).
Second, although all the observations on any given day use the same instruments worldwide, satellites don’t live forever and it’s conceivable that there are handover issues from one satellite to its successor. A lot of effort is put into avoiding problems with that and I haven’t seen any suggestions that there are significant problems with the handovers. But there could be something hidden there.
re your correction to my post far above in the thread. I’m sure you are right. You usually are. But I don’t really understand what you said. No need to explain further. I’ll work it out.
Two things.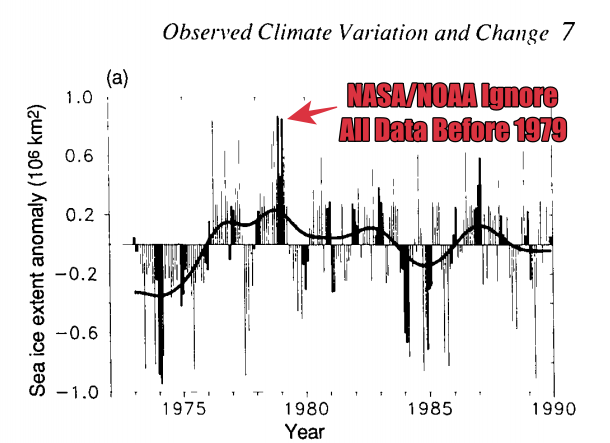
1st – GISS uses satellites to measure the sea surface temperatures. If not, where are the gages for 70 percent of the earth surface.
Note the Adjustments – then IR satellite (cannot get thru the clouds) to microwave (get thru the clouds, but not the rain & surface mist). Oh and did I mention one of the satellites was doing reasonable until they had to boost the altitude, then had problems with pitch, yaw and just had no idea the height it was flying. The number of adjustments to correct is staggering. Includes (but not limited to); wind speed, rain, cloud amount/percent and cloud water vapor, daytime diurnal warming, high latitudes, aerosols, SSTs <10C, columnar water vapor, higher latitudes show a slight warm bias, seasonal cycle wind direction for SST retrieval, fast moving storms and fronts, wind direction error and instrument degradation.
http://images.remss.com/papers/rsspubs/gentemann_jgr_2014.pdf
2nd – And this is what people do when you start looking at these relatively arbitrary times, is you start with a really high number at the left-hand side and that kind of influences your – your, basically, your linear trend:
Like the Arctic sea ice levels?
Sea Ice – 1973-1990
Changes and fluctuations in Arctic seaice extent have been analysed by Mysak and Manak (1989); they find no long term trends in sea-ice extent between 1953 and 1984 in a number of Arctic ocean regions but substantial decadal time scale variability was evident in the Atlantic sector. These variations were found to be consistent with the development, movement and decay of the “Great Salinity Anomaly” noted in Section 7.7. Sea-ice conditions are now reported regularly in marine synoptic observations, as well as by special reconnaissance flights, and coastal radar. Especially importantly, satellite observations have been used to map sea-ice extent routinely since the early 1970s. The American Navy Joint Ice Center has produced weekly charts which have been digitised by NOAA. These data are summarized in Figure 7.20 which is based on analyses carried out on a 1° latitude x 2.5° longitude grid. Sea-ice is defined to be present when its concentration exceeds 10% (Ropelewski, 1983). Since about 1976 the areal extent of sea-ice in the Northern Hemisphere has varied about a constant climatological level but in 1972-1975 sea-ice extent was significantly less.
http://ipcc.ch/ipccreports/far/wg_I/ipcc_far_wg_I_chapter_07.pdf
Regarding GISS using satellites to measure sea surface temperatures: This is not used in the current version of ERSST (which is v4) or the most recennt version (v3b) that is/was used in the NOAA and GISS global surface temperature datasets. Satellites were used for some of the data gathering for ERSSTv3.
DDMoore,
Many items on that list of things that might upset satellite readings are top candidates for a list of what might upset thermometers in Stevenson screens.
So we are not advancing much by the comparison.
Except that the satellite scientists have shown rather better ways with better physics to cope than the thermometer people have.
One of my main concerns is forced reliance on thermometer methods before the satellite era. These did not really have to agree with crosschecks, so it was easier to devise adjustments that, history has shown tended to enhance the CAGW case.
Many times now I have referred to the work of Chris Gilham from Australia who showed in great detail how official government temperature records printed in the middle of the 20th century are rather different to comparable records recalculated with adjustments quite recently. There are not strong grounds to dismiss the accuracy of the earlier complications,except for those inclined to state that these inconvenient early compilations done by top scientists at the time, can show that more than half of the present alleged Australian warming arises from adjustments to the same or similar data sets.
So when BEST advocates yell that their adjustments warmed the early data, they neglect the essential fact that their corrections are too small to give a match to the high quality mid century data that were compiled at a time when there was no pressure to craft either warming or cooling trends.
Therefore, comparisons of lig thermometry and satellites has some problems about whether the lig figures were more idealisrically adjusted to show warming of the globe, with perturbing algorithms that continue to exert questionable lig and thermistor changes post 1978.
Geoff
“everybody makes mistakes?” Yeah, every body does. But some of those mistakes matter a whole lot, and some of them don’t. I make a mistake in my checkbook. You make a mistake about what size of shirt to buy your kids I get the wrong shampoo or recipe ingredients. No big deal.
But scientists who use OUR MONEY to put large, metal objects into the SKY over our HEADS, and then attempt to use the data from those satellites to CONTROL our daily lives should NOT be making mistakes about that. And HONEST scientists who are shown to be mistaken are expected to ADMIT it and revise their former theories accordingly!
Yeah, two points:
1) Their data showed the exact same stagnation in temperatures, until they “adjusted” it by “correcting” the most accurate ocean temperature readings from an extensive state-of-the-art buoy network to match the worst readings from buckets thrown over the sides of ships.
2) They are continually “adjusting” their data, presumably because they were wrong before. Accusing Spencer and Christy of making a few “mistakes” then requires quite a bit of chutzpah.
3) The satellite temps are corroborated independently by radiosonde balloons.
OK, three points.
3 strikes. Announcer: “Steeeeerike THREE! Aaaaaan, poor ol’ A. G. W. is….. OUTTA THERE!”
Great pitching, O Hall-of-Famer Bartemis!
+1 for truth!
Of course some of us might use an alternative sports analogy, LBW, bowled, caught, stumped and hit wicket. I cannot think of how to include any other ways of getting out that can be included for one delivery.
Richard of NZ:
What about Handled the ball?
So down is up, plus is minus, more is less, etc. etc.
The, black, pot, kettle, calling, the (again).
Rearrange to suit.
Hey , that sounds a liberal paradise !!
I would like it if someone with expertise could make a detailed blog post describing the pros and cons of both satellite and ground-based measurements. Videos like the one above are obvious one-sided bs. But since both are subject to adjustments (and therefore both have the potential for human bias), it makes it difficult for laymen such as myself to make informed judgements as to which graphs are better.
JsG, tried but got misthreaded. See upthread under JohnWho.
Link to RudIstvan (buy his book, Blowing Smoke – available on Amazon! 🙂 )’s 12:08pm answer: http://wattsupwiththat.com/2016/01/15/the-climateers-new-pause-excuse-born-of-desperation-the-satellites-are-lying/#comment-2120509
JohnWho, Just Some Guy, meh, what’s the difference? Heh.
TY, Janice. I did not write it to get rich. I wrote it over two years cause am very upset at CAGW perversion of science. And, really care about mankinds energy future. Same motivation I reckon as AW’s excellent maintenance of this awrs winning blog.
If you or AW need additional copies, I can gift them to specific ‘Kindle reader’ coordinates. One of the things Amazon allows authors that iBooks, Kobo, and Nook does not, where is also available from my ebook publisher.
Dear Rud,
Yes. And that is why I (every so often) promote your book. It is ammunition in the battle for science truth! Thank you for providing us all with some powerful missiles of knowledge!
And, thank you for the offer! I’ll keep that in mind (I don’t have a kindle yet — sorry about that).
And I think even Knute (who was ribbing you the other day) realizes that all that time and effort you devoted to a book whose profits were never likely to fully compensate you was not done for the money.
I HOPE YOU MENTION YOUR BOOK AT EVERY OPPORTUNITY!
With gratitude for your persevering and powerful efforts for science truth (thus freedom),
Janice
The video above interviews the producer of the RSS satellite data set. Does it sound like he is biased to the side of showing no warming?
Dr. Mears has been trying to find a problem with his data for years. RSS did a very detailed comparison with radiosonde data (no doubt trying to find a problem). What he found is very good agreement outside the tropics with RSS was running too hot in the tropics. Not exactly what he wanted to find.
With all the problems Dr Mears has with RSS data, surely he has had time to correct the errors?
As a layman of limited expertise, with, nonetheless, some prior education in higher math and science( who actually earned money part time doing research type jobs in college,years and years ago), I can opine unequivocally, if intuitively, always believe the satellite data, for two reasons – coverage, and it doesn’t get any more pristine than space!
Someone correct me if I’m wrong, of course.
I should have said “little or no” expertise.
Hmmmm, I thought satellites controlled our GPS system, accurate to within 15 meters ???
The Lieca and Trimble surveying instruments measure MSL elevations to an accuracy of 0.1 +-cm.
Lieca and Trimble make GPS equipment.
The difference between absolute and relative error. Absolute error is generally about 5 meters 1-sigma. But, if you are measuring two positions, they are both affected largely by the same errors, so the difference between them has much smaller error.
Heat from climate scientists’ pants on fire are an example of AGW!
Couldn’t Prof. Dressler at least get a shave for his five minutes of fame, for crying out loud? The Yasser Arafat look I suppose.
Looking at Curry, Christy, Spencer vs Mann in the video, it is pretty clear which side of the debate gets funding and junkets to Paris. Mann is on the ManBearPig dining plan.
Satellite datasets with too little warming … compared to what?
Little Mikey’s wishes, hopes, fears, & funding desires?
Hundreds of different poorly sited stations that have been repeatedly adjusted to show … what … reality or a desired outcome?
All this climate science and these government scientists … talk about the creation of oxymoronic concepts …
“All this climate science and these government scientists … talk about the creation of oxymoronic concepts …”
Looks like “Lysenkoism” to me
https://en.wikipedia.org/wiki/Lysenkoism
Next time they try the “denier” slander (deny what? that there is a climate? that it is variable?) hit ’em back with that word, “Lysenkoism”.
“…the planet is warming and, despite our best attempts to see whether natural causes can explain that warming, they can’t.”
Natural causes melted 2 mile thick ice sheets, raised sea levels 400 feet, and at the end of the Younger Dryas temps rose 7C in a just a few decades. We can’t explain the mechanism behind that either, so the above statement is a non sequitur: nobody is arguing that these far more extreme events weren’t natural, but because Climate Scientists likewise can’t find a natural mechanism for the warming since the 1800s, how is that evidence for human-induced warming? It just doesn’t follow.
+1 🙂
There are also satellites which have been specifically launched to measure the surface temperature of the ocean. We have thousands of buoys specifically designed to measure sea surface temperatures.
Yet, what do the warmers do with this info? They throw this data out which cost billions of dollars to gather and they use unreliable ship-based engine intakes instead.
And even weirder, the ship-based engine intake data that they are purport to use now does NOT even show the increase in sea surface temperature that they are reporting.
Land-based data has been adjusted up by over 0.5C.
You would have to be a fool to take these guys seriously. But some people like to be foolish.
Thank god_ for Christy and Spencer or temps would be 1.0C higher than right now.
Speaking of those satellites Bill-where the crap is all the OCO2 data reporting that should be going on?
From Carbon Brief:
Ah ,yes.
It would seem the data wasn’t producing the required support for the AGW crowd, and will need to be “adjusted” before we can get to see it.
The OCO2 video’s smooth global coverage starts with the second half of May, shortly after the peak of CO2 in northern forests. That is when biomass decay has recently been going gangbusters for a while and photosynthesis in tree leaves has just started removing CO2 from the atmosphere. The video ends in and seems to concentrate on August, when northern forests have removed a lot of CO2 from the local atmosphere and are still doing so.
“Santer: Scientists are looking at moisture, at rainfall, at water vapor, at surface humidity, at the cryosphere, at snow and ice … ”
Yes, scientists are measuring many things with great precision, even barometric pressure. It’s like we measure everything we can, but we don’t measure how much heat is currently being “trapped” by so called “green-house gases”. There are charts and graphs of temperature, pressure, humidity data that we can reference. But there are no charts of the variances in how much heat is being “trapped” by green-house gases throughout the course of a day, a month, a year. We cannot compare how this heat “trapping” varies by elevation, by atmospheric tides.
Physical properties are things that can be measured. If there were an actual physical property resembling the definition of “green house” gases trapping heat, then why aren’t we measuring it? Are we to believe that those 97% of climate scientists just haven’t considered measuring it? If so, they’re not a very savvy lot.
(cont) … Of course we’d be measuring it if we could, but we aren’t and that means we can’t. And that means there is no defined physical property resembling the “green-house gas” phenomenon.
Considering the billions already wasted on the CAGW scam, it would cost a small fraction of that to set up a large scale physical model to emulate the Earth and its atmosphere and measure the actual amount, if any, that CO2 traps energy. This will never be done because the results are already known and it would quickly put an end to hoax and the gravy train.
+10. Or a simple experiment showing how a cold gas can boil water by increasing the CO2 content.
Yes Thomas Homer,
Physical properties are things
that can be measured. If there were an actual physical property resembling the definition of “green house” gases trapping heat, then why aren’t we measuring it? Are we to believe that those 97 of climate scientists just haven’t considered measuring it? If so, they’re not a very savvy lot.
____
Thanks for clear view, plain truth.
We know the graphs ‘CO2 lags temperatures.’
We can wait for the graphs ‘climate science truth recognition’ follows critical climate science.
Regards – Hans
I think this video is a good thing to take off from and to answer to these charges on a fuller video that does include balloon radio sonde, etc. Also a set of pristine stations compared to the satellite record. I would also bring in the remote sensing of other planets and moons using the same technology – say compare the satellite with the rover readings on Mars.
For a real killer, I would bring in the Russian astronomer’s evidence of concurrent global warming on Mars and Earth!!! And this was reported in National Geographic – how’s that for a source:
“Habibullo Abdussamatov, head of space research at St. Petersburg’s Pulkovo Astronomical Observatory in Russia, says the Mars data is evidence that the current global warming on Earth is being caused by changes in the sun.”The long-term increase in solar irradiance is heating both Earth and Mars,” he said.”
http://news.nationalgeographic.com/news/2007/02/070228-mars-warming.html
Also in the article from NASA:
“In 2005 data from NASA’s Mars Global Surveyor and Odyssey missions revealed that the carbon dioxide “ice caps” near Mars’s south pole had been diminishing for three summers in a row.”
I’ve been disappointed that the best spokespersons we have are even silent on this matter – it would be good for Ted Cruz to have had this ace up his sleeve.
Mann will just claim that CO2 from earth is trapping heat and shipping it via UPS to other planets. That’s why we haven’t had the runaway effect — UPS.
3 summers in a row shows a long term trend, while Earth’s temperature has global trends that last a couple decades and then change?
I guess they figure everyone will just sit back and believe them.
First they came for the Mediaval Warm period and I didn’t speak up for no one believed them anyway. Then they became desparate and adjusted the temperatures, and I didn’t speak up as no one believed them anyway then they came for the satellite data and everyone laughed their back sides off.
+1
+2
Man Bearpig write good.
In the ‘Remove the plank from your own eye’ division:
I cannot find a description of the electronics of the MMTS system but I suspect that the NOAA MMTS works by measuring a voltage drop created by the changing resistance of a thermistor, this voltage then being digitised.
As well as siting issues found by our illustrious host and others, I also found this interesting item on how well MMTS is maintained [my bold]. How do they correct for these situations?
http://www.srh.noaa.gov/srh/dad/coop/CPM_Article-1.pdf
John in Oz, the solution is obvious. Simply bag or tent the thermistor shelter and pump in CO2. The heat (that is, the changed climate) will kill them all in 100 yrs or so.
You made me laugh with that one Paul! Maybe we should tent NASA and do that….
sorry, you beat me to
Why not wrap that thing and apply nitrogen or carbon monoxide. For preservation of spider parasites?
Spiders are our first line of defense against harmful insects!
/need a sarc ?
Best regards – Hans
Yes , you’ve just gotta love it when the high priests start dissing the charge coupled device, the sine qua non of precise discrimination, the bed-rock of remote reconnaissance.
They’re not measuring temperature, they’re measuring millivolts! Maybe, they’re just inferring voltage.
Mosher is happy to tell us – ad-nauseam – that the RSS data is just the product of models. Then again, Mann’s tree rings are the product of – well, we can all fill in some words for that.
So it comes down to this: RSS data v Mann’s; 21st century technology v a Bristlecone or two. Tough choice….
Perhaps we should keep in mind that the tree-ring data shows that the Earth has been cooling for the past 65 years — something that Dr Mann et al thought we really shouldn’t worry our pretty little heads about. https://en.wikipedia.org/wiki/Divergence_problem
The Apollo mission were based many models. Guess what? These models had been validated before life were put at risk. The best guess of where the Moon would be and how much was needed to be on the good trajectory was good.
Yes, everything is based on models. Some can be tested. Some work really well.
A measurement device uses models. But usually not models about the phenomenon we want to discover.
This is the logical next step that I have been waiting for ever since the swift and comprehensive adoption of the Karlization method of the surface data.
next week we’ll read that we are no longer carbon based life forms
This is the letter I sent to the Veterinary Record last month in response to an Editorial Column.
Part of this column was highlighting how important CO2 and NH4 emissions from agricultural activities were in causing global warming, and that we as a profession should advise our clients of these dangers. We should also advise them to change their farming practices and that we should all eat less meat.
The Editor decided that the readers of the VR should not see my comments.
The Editor
The Veterinary Record
Dear Sir
Are we a Science-based Profession?
I feel bound to ask this question after reading the VR Editorial Comment (28th November). This stated, in effect, that the profession was in a good position to support the IPCC’s dogma on catastrophic anthropogenic global warming (CAGW), due to man’s emission of so-called greenhouse gases (mainly CO2 and CH4). There was a similar editorial (VR 5th October 2013) entitled “Curbing Emissions”, which was a response to the IPCC AR5 report. My letter was published (9th November 2013), in which I commented that “there was no published empirical data or verifiable experiments that suggested either of the gasses (CO2 and CH4) had ever caused or driven global warming”. I also suggested that curbing these emissions will have no measurable effect on global temperatures and the ‘economic effects’ are dubious. Recently Dr Patrick Moore, Ecologist (2015) gave a lecture in which he produced robust evidence which suggested that, far from causing CAGW, more CO2 would be highly beneficial to the biosphere and agricultural crops.
In order to clarify the scientific method, I need to refer to Dr Craig Idso and others (2013), quote, “The hypothesis implicit in all IPCC writings is that dangerous global warming is resulting, or will result, from human-related greenhouse gas emissions. In considering any such hypothesis, an alternative and null hypothesis must be entertained, which is the simplest hypothesis consistent with the known facts. The null hypothesis is that the currently observed changes in global climate indices and the physical environment, as well as current changes in animal and plant characteristics, are the result of natural variability. To invalidate this null hypothesis requires, at a minimum, direct evidence of human causation of specific changes that lie outside usual, natural variability. Unless and until such evidence is adduced, the null hypothesis is assumed to be correct”. I respectfully suggest, therefore, that the 28th November Leader does not follow the scientific method which was well defined by Popper (1965). If we are a science-based profession, it would make no sense to support the IPCC’s pseudo-scientific political dogma.
There are other disquieting aspects. Dr Tim Ball (2014) makes a compelling case that climate science has been, quote, “deliberately corrupted by deceptions, misinformation, manipulation of records and misapplying the scientific method and research”. Much of this is also revealed in the emails from the Climatic Research Unit of the University of East Anglia in November 2009, which have been fully recorded and analysed by Andrew Montford (2012). He shows, regrettably, evidence of international malpractice.
One of the main platforms of the IPCC hypothesis is its reliance on un-validated Global Climate Models (aka General Circulation Models) in projecting global temperatures about 100 years ahead. Global climate is far too complex and chaotic for GCMs ever to be programmed correctly. Furthermore many of the known natural factors affecting the global climate have been omitted from the GCMs. It is not surprising, therefore, that the projections made for the last 20 years differ wildly from the actual lower troposphere temperatures as shown by the RSS (Monckton 2015) and UAH (Spencer 2015) datasets. Both of these show there has been no statistical rise in global temperatures for nearly 20 years.
One is bound to wonder whether the Leader Comment exhorting us to “raise awareness of our clients to these issues” of a pseudo-scientific myth, will soon ask us to raise awareness of the importance of homoeopathy.
References
MOORE, P., (2015) GWPF Lecture http://www.thegwpf.org/gwpftv/
IDSO, C.D., CARTER, R.M., SINGER,S.F., (2013) Climate Change Reconsidered ll. Physical Science. http://www.nipccreport.org/reports/ccr2a/pdf/Summary-for-Policymakers.pdf
POPPER, K., (1965) Conjectures and Refutations: The Growth of Scientific Knowledge.2nd Edition: Harper and Row.
BALL, T., (2014) The Deliberate Corruption of Climate Science. Stairway Press.
MONTFORD, A., (2012) Hiding the Decline. Anglosphere Books
MONCKTON, C., (2015) RSS Dataset http://www.climatedepot.com/2015/08/06/a-new-record-pause-length-no-global-warming-for-18-years-7-months-temperature-standstill-extends-to-233-months/
SPENCER, R., (2015) UAH Dataset http://www.drroyspencer.com/wp-content/uploads/V6-vs-v5.6-LT-1979-Mar2015.gif
Michael Oxenham
excellent
Ditto!
Hear, Hear, Dr. Oxenham! No WONDER your Nov., 2013 letter got published (assuming similar product from same source). Hope this one does, too.
Attention Anyone Needing a Draft Letter to the Editor: Use Michael Oxenham’s above (with necessary modifications AND acknowledgement of author).
Your animal patients are in the hands of a great mind, thus, your practice is very, busy, no doubt!
I seem to recall that Roy Spencer and John Christy wrote an article about orbital decay and produced a new data set to correct for it. I also seem to recall that the orbital decay problem did not apply to all the satellites.
Correct on both counts.
Both satellite data sets have been corrected for orbital decay and drift. And unlike surface data the old unadjusted data is still available on the web.
Good point, Steven. The video does not mention how early one these corrections were caught and quantification. I doubt they got the sign wrong. The main point is the transparency and that Mears’ RSS and radiosondes agree. Surface data is the outlier. The models predict the lower troposphere to be warming about the same as land and up to 1.4 times the rate of the ocean surface. The trends as of March 2015 for land and sea for UAH are .19 and .08 per decade respectively, for GMST trend of .11 per decade, 1.1C per century.