From the UNIVERSITY OF MISSOURI-COLUMBIA:
Paleoclimate researchers find connection between carbon cycles, climate trends
Carbon cycling research can help scientists predict global warming and cooling trends
COLUMBIA, Mo. – Making predictions about climate variability often means looking to the past to find trends. Now paleoclimate researchers from the University of Missouri have found clues in exposed bedrock alongside an Alabama highway that could help forecast climate variability. In their study, the researchers verified evidence suggesting carbon dioxide decreased significantly at the end of the Ordovician Period, 450 million years ago, preceding an ice age and eventual mass extinction. These results will help climatologists better predict future environmental changes.

“Climate is not a simple science; many small factors determine what exactly leads to global warming and cooling trends,” MacLeod said. “By understanding the deep past, we have better information about historic trends that lead to better predictions. Understanding carbon cycles adds value to our knowledge base of climate change.”
During the Late Ordovician period, most of North America was covered in a shallow tropical sea. What is now Alabama was on the margin of that sea where local environmental effects likely did significantly impact carbon cycling. Page Quinton, a doctoral student in MU’s geological sciences program, led a field research team in northeastern Alabama that collected rock samples from rock formations exposed when workers cut highways through hills in the region. Using the samples, Quinton analyzed them for chemical clues that can be related to CO2 levels at specific time periods.
“After examining rocks 450 million years old or older, we believe the drop was caused by a massive burial of organic carbon during the time period,” Quinton said. “We’re trying to determine whether or not there was an increase in plant productivity, or huge algae blooms in the ocean, that died and fell to the sea floor, basically burying CO2. This burial, coupled with the mountain building event that created the Appalachian Mountains, could have contributed to the resulting ice age.”
A drop in CO2 due to the burial of organic carbon in the Late Ordovician is the exact opposite of what is happening now as massive amounts of CO2 are being released; yet, understanding how the historic events occurred can help with future models and predictions, Macleod said.
###
The study “Carbon Cycling across the Southern Margin of Laurentia during the Late Ordovician,” recently was published in Palaeogeography, Palaeoclimatology, Palaepoecology.
http://www.sciencedirect.com/science/article/pii/S0031018215004563
Abstract
The Guttenberg Isotope Carbon Excursion (GICE), a positive carbon isotope excursion that occurs near the base of the Katian Stage, is thought to be a global event possibly related to Late Ordovician cooling. Documenting how much regional and global variability exists in carbon isotopic trends prior to and during the GICE is a critical aspect in understanding the implications of the excursion for interpreting changes in the global carbon cycle, paleoclimate, and chemostratigraphic correlation during the Ordovician. To investigate carbon isotopic trends along the southern margin of the Laurentian carbonate platform during the Late Ordovician, we measured bulk carbonate δ13Ccarb and δ18Ocarbas well as organic carbon δ13Corg values from four locations in Alabama. These sections are excellent study sites because they are well exposed, contain the regionally well-correlated Deicke and Millbrig K-bentonites, and are in a region where δ13C trends have not been studied.
Full paper: http://www.sciencedirect.com/science/article/pii/S0031018215004563/pdfft?md5=c327a0e7bbfb57b6da08f34570359bd7&pid=1-s2.0-S0031018215004563-main.pdf
Carbonate δ13Ccarb results from one section (i.e. Fort Payne) in northeastern Alabama record a 1.5‰ positive excursion above the Millbrig K-bentonite. We interpret the 1.5‰ positive excursion as a primary feature and identify it as the GICE. The characteristic GICE excursion is absent in the other study sections and we attribute this absence to the presence of unconformities (either non-depositional or erosional) in these sections. We find neither evidence for sea level control on δ13C trends nor conclusive evidence for δ13CDIC gradients along the southeast margin of Laurentia’s epeiric sea. Combined with the proximity to the Iapetus Ocean, these results suggest that carbon isotopic trends in Alabama are a reliable proxy for open ocean conditions. Therefore, despite the absence of GICE excursion in all but one of our study sections, increasing δ13C values in Alabama prior to the GICE provides evidence for a steady 13C enrichment of the global surficial carbon reservoir consistent with a drawdown of atmospheric CO2 during the early Late Ordovician
The work was supported in part by NSF grants (1323444, 1324577 and 1324954). The content is the solely the responsibility of the authors and does not necessarily represent the official views of the funding agencies.
Everytime I hear some nutjob politician or climate pseudo-scientist refer to “carbon pollution,” I just want to slap them for offending my intelligence. That’s like saying a life-giving springtime rainfall is “water pollution.”
So anytime you hear someone today seriously employing the term “carbon pollution” in their climate lexicon, you can be sure you have identified a moron.
Does the last word in this sentence need to be corrected?
The study “Carbon Cycling across the Southern Margin of Laurentia during the Late Ordovician,” recently was published in Palaeogeography, Palaeoclimatology, Palaepoecology.
Thanks. Good article.
These idiots/scam artists cannot predict the weather 12 hours from now, let alone a hundred years. Are there that many LIV’s out there who believe them? (guess so).
*** Albedo regulation of Ice Ages, with no CO2 feedbacks ***
My analysis of Ice Age initiation and propagation is now up on the Warwick Hughes site. It speculates that the primary feedback for Ice Ages was actually albedo, not CO2. The overwhelming power of albedo was only overcome when CO2 dropped to dangerously low levels, resulting in widespread plant dieback and several millenia of dust storms. These dust storms reduced the albedo of the ice sheets, and allowed the Interglacial warming periods.
But Interglacial warming only happened when the precessional Great Year’s summer season increased insolation in the northern hemisphere. So several components are necessary for an Interglacial — very low Co2, plant dieback, dust storms, low ice albedo, and a Great Year summer season. So CO2 does falicitate Interglacial warming, but only by getting so low that all the plants die !!
http://www.warwickhughes.com/blog/?p=4019
http://www.warwickhughes.com/agri15/ralph_ellis_oct15.html
Ralph
This article has it wrong in that they are trying to say that co2 changes somehow led the climate change and that the ice age of the Ordovician period did not occur not only when co2 concentrations were not high but not until after co2 concentrations fell.
Conventional studies do not see it this way . The up shot being this is another article to twist data in order to support to AGW theory.
Ummm…. “forecast [] variability”? Riiiiigt. Perhaps forecast a primary quantity before you tackle the moments.
‘A drop in CO2 due to the burial of organic carbon in the Late Ordovician is the exact opposite of what is happening now as massive amounts of CO2 are being released’
CO2 during the Late Ordovician period is thought to be some 4,000 parts per million. CO2 has increased by a minute 150 ppmv during the past 150 years, reaching the frightening run for the hills level of 400ppm. Stop reading right there.
So they find 3 samples don’t show the “excusion” and one that does. They conclude that the three sample must be in error due to erosion or something … and retain the sample that fits thier preconcieved idea that CO2 changes climate.
Par for the course climatology.
The Ordovician Ice Age was cause by semi-super-continent Gondwana transiting the South Pole. Think Antarctica times 7. Think of global Albedo from all that ice at the South Pole rising to 35% versus today’s 29.8%. It is about a clear-cut of a case as it can get.
http://www.ncdc.noaa.gov/paleo/ctl/images/figure05_10.jpg
All of the CO2 estimates around this time-period are about 4500 ppm, or what should have led to +12.0C world compared to today. Instead we find it cooled off starting at 460 Mya and reached the coldest point right at the Ordovician Extinction at 443 Mya to about -7.0C and never really recovered back above 0.0C compared to today until 430 Mya. The ice age lasted 30 million years.
http://s14.postimg.org/7keqi3mwx/Ordovician_Extinction_Temp_CO2_Zoom_In.png
Note that they carefully avoid any comment or study on the relative phase of the CO2 in relation to the on coming glaciation but think that avoiding questions of causation will help us understand climate change in the future.
sociology is starting to look like a hard science !!
I knew it. It’s that CO2 that done it, the great extinction. It’s the lack of CO2. CO2 is always to blame, either because of too much of it, or because of the lack of it. Let’s keep it exactly at 350ppm +/-0.000%
Hopefully the “sample prep” people who “drilled the cores” remembered to saw off the end of the core that had been exposed to diesel engine exhaust (surface exchange reactions) from the time when the interstate road system (Eisenhower Military Road System) to present. On travel so I can’t get the paper.
Oklahoma Fittstown (Fig. 7 above) claim to fame is U.S. Route 377, connecting east of Oklahoma City, Stroud, to the Mexico US border in southwest Texas, Del Rio.
The oil truckers must be slushing gallons out of their rigs (or the sample spot is a notorious place where “accidents” tend to happen)!
Ha ha
They’re doing the “Look! A squirrel!” routine.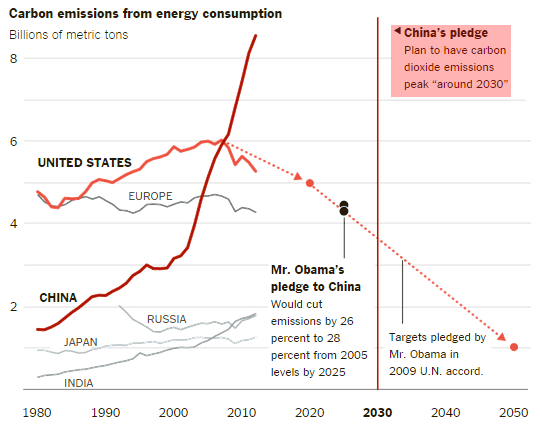

China is the big CO2 emitter, not the West:
http://realclimatescience.com/wp-content/uploads/2015/09/ScreenHunter_10514-Sep.-24-01.15.gif
But China gets a free pass:
Demonizing “carbon” is all politics, and a 180º flip-flop from Science a century ago.
Reality: the rise in CO2 has been a net benefit, with no observed downside:
http://www.co2science.org/education/reports/co2benefits/figures/Figure8.gif
[^That^ interesting chart shows that ∆CO2 follows ∆temperature]
[click in chart to embiggen. See the “Note” in the chart.]
But there is no correlation between the rise in CO2 and subsequent temperature changes:
http://jonova.s3.amazonaws.com/guest/de/temp-emissions-1850-web.jpg
However, there is a very strong correlation between rising CO2 and global wealth:
http://climate.mr-int.ch/images/graphs/gdp_vs_carbon.png
Draw your own conclusions…
I am Canadian , so my opinion may be a little biased BUT…..I WANT more Glo.Bull warming !!!! I am tired of freezing my nuts off every 6 months !!!! PERIOD !!
Why the title? The abstract never demonstrates that the glacial period was the result from the decrease of CO2, more likely, based on all other glaciations, the reverse is true. If the researcher (student) has this interpretation, they’re completely incapable of making such a claim from one outcrop, particularly a colder climate period that stretched over multiple million of years. How do such incompetence and spunk come from a very basic study and then to make such grandiose claim? The idea that one can assume a particular global climate for a period that stretches 20-30 million years from a thin minor rock sample or paleosol layer is ridiculous. Her/his degree should be rejected…..
I sat down and did the Greenhouse math. Using the temperatures and Co2 levels from the EPICA Ice Dome core sample of 1950, here’s the results:
18376 years ago, at the last coldest point of the last glaciation, temperature was -10.35C below the 1950 baseline and Co2 was 187ppm. Temperature began to climb consistently following that low.
11825 years ago, at the first time that the temperature reached the 1950 baseline, it was +0.07C and Co2 was 251ppm.
So we have a change of 10.28C in 6,551 years, all when mankind was still in the late Stone Age level of technology, just begining the transition from the Mesolithic to the Neolithic Age, and there was no use of fossil feuls. So the greatest level of global warming occurred when mankind could have made NO impact on Co2 levels. The Co2 level changed by only 64 ppm, which equals a ratio of 6.2 ppm per 1 degree of change
The current Co2 level is 398 ppm. If the AGW/Greenhouse Effect theory is true and Co2 is the only true engine of global warming, then the formula of 6.2ppm per 1 degree of change would mean the current temperature should be +23.7C above the 1950 baseline, according to the following calculation:
If 251 ppm is required to meet the baseline and the current level is 398ppm, that’s a difference of 147ppm.
Given the historic ratio of 6.2ppm per 1C degree of change, divide 147 by 6.2 to get the number of degrees that it should theoretically be above the baseline.
398ppm – 251ppm = 147 ppm/6.2 ppm = +23.7 degrees
The current world temp is….drum roll please….+0.85C above the 1950 baseline. Not +23.7C. Not even +1C over baseline.
Conclusion: C02 levels show NO quantifiable effect on world temperatures. AGW/Greenhouse Effect has no basis in reality.
Data sources:
https://www.ncdc.noaa.gov/paleo/metadata/noaa-icecore-6080.html
http://co2now.org/
http://earthobservatory.nasa.gov/Features/WorldOfChange/decadaltemp.php
“Making predictions about climate variability often means looking to the past to find trends.”
Translation: “We are on a fishing trip, looking for “clues” for how increased CO2 “causes” warming and how a drop in CO2 “causes” cooling. We will studiously ignore inconvenient facts like the earth’s climate system 450 million years ago being nothing like the more recent system of the past 2 million years, with alternating ice ages and interglacials. Because that is how climate science is done.”
“These results will help climatologists better predict future environmental changes.”
Translation: “These results will hopefully keep us on the Big Climate gravy train, and keep the train itself chugging along for at least a little while longer”.
As AndyJ points out, CO2 as a cause of ice ages is largely a non event.
Whats key to major cooling in the NH is changes to the climate in North America. Because what really stands out about the last ice age. ls just how much colder the climate in North America became, and l think that this is a key factor about understanding climate change in the NH. Because if the weather allows the Arctic to extend south over this large land mass. Not only does it affect North America but it also leads to having a major impact on the northern Atlantic and the jet stream. Which can end up dragging the whole of the Atlantic side of the NH into climate cooling.
Today’s study brought to you by: Captain Obvious
The GICE is positive PDB in all examples shown. A positive excursion means the light Carbon (12C) is somewhere else besides where you are measuring. It says nothing about the total abundance of CO2. Even the supplementary materials are paywalled and little effort seems to be made to correlate the excursion with the glaciation except that it was “before”.
A positive excursion usually means that the 12C is locked up in the biosphere which prefers it and means good times for living things.
Using typical carbonated logic they are trying to interpret the prevalence of 13C in their samples as evidence of CO2 “burial” and reduction in the atmosphere leading to the glaciation. Wrong. The burial of organic Carbon would result in a negative excursion.
They also suggest the silicate “weathering” from the collisional orogeny. This would reduce atmospheric CO2 and might cause a positive excursion as relatively unfractionated DIC, but by the late Ordovician land plants were crawling up the waterways and beginning to slow erosion. Rugose and Tabulate corals and other calcifying critters dominated ocean sedimentation (the rocks they were measuring). Surely some carbonate weathering would be also be a part of this orogeny.
For perspective chemical weathering at our current level of vegetation coverage is .03% of the Carbon cycle.
After I read the whole article including the meaty phrase: “Understanding carbon cycles adds value to our knowledge base of climate change”, I came to the conclusion that they were just a group of paleogeologists in search of a large grant. The age of reduced grants is coming and they want to be positioned to pick up some of the last crumbs before the trough is exhausted.
Forget about CO2, when it comes to understanding climate change you need to understand weather.
Because the main event about the last ice age is the fact that the weather kept sending cold Polar air down across North America. So with this cold pool sitting next to the North Atlantic, it lead to a large increase in cold air flowing over the northern Atlantic and a large increase in the power of the jet stream over the northern Atlantic. And its this what lead to the cooling of the northern Atlantic.
everybody stop breathing.
So why was there there little in the way of ice sheets over the eastern side of Russia ?.
Was it because climate was to dry?
Maybe, but l think it was largely because the climate got too warm during the summer and again this was likely due to the weather patterns. Because if there were a increase in low pressure sitting over northern Russia and with high pressure sitting over northern europe. Then you would have cold air pushing down across NW Russia but warmer air moving up from the south across the NE side of Russia. This is the reason l believe is the reason why much of the ice sheets were over NW Russia.
Very interesting but it does not agree with my geologic map. They have low CO2 arrive before the Ordovician ice age starts but mine shows it starting after the ice age and then take most of the Silurian that follows to complete. Who is right? The theory that Gondwana passed over the South Pole is far superior to the persistent idea that carbon dioxide has anything to do with ice ages. And what, if anything, is the connection between mass extinctions and CO2 they imply?