Looking back at a recently published paper on ancient sea level and CO2, and noting that the most recent paper by Dr. James Hansen seems to be getting the cold shoulder, I thought it would be a good idea to have a look at both.
First, Hansen’s paper, which isn’t peer-reviewed yet, but is generating some media attention, and some of it isn’t so good. It is titled:
Ice melt, sea level rise and superstorms: evidence from paleoclimate data, climate modeling, and modern observations that 2 ◦C global warming is highly dangerous
Hansen, J., Sato, M., Hearty, P., Ruedy, R., Kelley, M., Masson-Delmotte, V., Russell, G., Tselioudis, G., Cao, J., Rignot, E., Velicogna, I., Kandiano, E., von Schuckmann, K., Kharecha, P., Legrande, A. N., Bauer, M., and Lo, K.-W.: Ice melt, sea level rise and superstorms: evidence from paleoclimate data, climate modeling, and modern observations that 2 °C global warming is highly dangerous, Atmos. Chem. Phys. Discuss., 15, 20059-20179, doi:10.5194/acpd-15-20059-2015, 2015.
Abstract. There is evidence of ice melt, sea level rise to +5–9 m, and extreme storms in the prior interglacial period that was less than 1 °C warmer than today. Human-made climate forcing is stronger and more rapid than paleo forcings, but much can be learned by combining insights from paleoclimate, climate modeling, and on-going observations. We argue that ice sheets in contact with the ocean are vulnerable to non-linear disintegration in response to ocean warming, and we posit that ice sheet mass loss can be approximated by a doubling time up to sea level rise of at least several meters. Doubling times of 10, 20 or 40 years yield sea level rise of several meters in 50, 100 or 200 years. Paleoclimate data reveal that subsurface ocean warming causes ice shelf melt and ice sheet discharge. Our climate model exposes amplifying feedbacks in the Southern Ocean that slow Antarctic bottom water formation and increase ocean temperature near ice shelf grounding lines, while cooling the surface ocean and increasing sea ice cover and water column stability. Ocean surface cooling, in the North Atlantic as well as the Southern Ocean, increases tropospheric horizontal temperature gradients, eddy kinetic energy and baroclinicity, which drive more powerful storms. We focus attention on the Southern Ocean’s role in affecting atmospheric CO2 amount, which in turn is a tight control knob on global climate. The millennial (500–2000 year) time scale of deep ocean ventilation affects the time scale for natural CO2 change, thus the time scale for paleo global climate, ice sheet and sea level changes. This millennial carbon cycle time scale should not be misinterpreted as the ice sheet time scale for response to a rapid human-made climate forcing. Recent ice sheet melt rates have a doubling time near the lower end of the 10–40 year range. We conclude that 2 °C global warming above the preindustrial level, which would spur more ice shelf melt, is highly dangerous. Earth’s energy imbalance, which must be eliminated to stabilize climate, provides a crucial metric.
Hansen’s paper is now open for public comment.
Meanwhile, Climate Depot reports: Former NASA lead global warming scientist James Hansen’s new sea level rise scare study gets ‘cold shoulder’ from climate establishment.
- Warmist AP climate reporter Seth Borenstein said he ‘would not cover’ Hansen’s paper.
- UN IPCC Lead Author Kevin Trenberth calls Hansen’s study ‘rife with speculation and ‘what if’ scenarios’ and based on ‘flimsy evidence.’
- NYT’s Andrew Revkin: “Associated Press, The New York Times, the BBC and The Guardian..among those who steered clear of [Hansen] study”
- Even Michael Mann admits Hansen’s sea level rise estimates are ‘prone to a very large ‘extrapolation error’
Marc Morano comments:
“James Hansen’s new paper ratcheting up future sea level rise numbers is consistent with the new strategy of the global warming activists. Given that current sea level rise rates are not alarming, the only way climate activists can claim anything is ‘worse than we thought’ is to make more dire predictions of the future.
Simply making scarier predictions of the future in order to alarm policymakers is not ‘good science.’ Claiming that climate change impacts are ‘worse than we thought’ because predictions are now more frightening is a well worn playbook of the climate movement.
Simply put, when current reality fails to alarm, make scarier and scarier predictions of the distant future.
It seems even some of the worst offenders in alarmism, including Michael Mann, consider Hansen’s claims “over the top”. This may in fact be the first paper in recent times that Hansen has submitted that has a strong possibility of being rejected for publication. It appears he’s lost his mojo with his peers when they say thing like in the bullet point list above.
I’ll remind readers that one of Hansen’s most alarming predictions about sea level rise in New York City has yet to come to pass, looked to be falsfied in 2011, and so the goalposts got moved into the future, just as Morano says. Readers may recall our story about the claim Hansen made about the West Side Highway in New York city being underwater by now, due to sea level rise, visible from Hansen’s office at GISS.
I wrote then:
In a 2001 interview with author Rob Reiss about his upcoming book “Stormy Weather” Salon.com contributor Suzy Hansen (no apparent relation to Jim Hansen) asks some questions about his long path of research for the book. One of the questions centered around an interview of Dr. James Hansen by Reiss around 1988-1989. Red emphasis mine.
Extreme weather means more terrifying hurricanes and tornadoes and fires than we usually see. But what can we expect such conditions to do to our daily life?
While doing research 12 or 13 years ago, I met Jim Hansen, the scientist who in 1988 predicted the greenhouse effect before Congress. I went over to the window with him and looked out on Broadway in New York City and said, “If what you’re saying about the greenhouse effect is true, is anything going to look different down there in 20 years?” He looked for a while and was quiet and didn’t say anything for a couple seconds. Then he said, “Well, there will be more traffic.” I, of course, didn’t think he heard the question right. Then he explained, “The West Side Highway [which runs along the Hudson River] will be under water. And there will be tape across the windows across the street because of high winds. And the same birds won’t be there. The trees in the median strip will change.” Then he said, “There will be more police cars.” Why? “Well, you know what happens to crime when the heat goes up.”
And so far, over the last 10 years, we’ve had 10 of the hottest years on record.
Didn’t he also say that restaurants would have signs in their windows that read, “Water by request only.”
Under the greenhouse effect, extreme weather increases. Depending on where you are in terms of the hydrological cycle, you get more of whatever you’re prone to get. New York can get droughts, the droughts can get more severe and you’ll have signs in restaurants saying “Water by request only.”
When did he say this will happen?
Within 20 or 30 years. And remember we had this conversation in 1988 or 1989.
Does he still believe these things?
Yes, he still believes everything. I talked to him a few months ago and he said he wouldn’t change anything that he said then.
I’ve saved the Salon.com web page as a PDF also, here, just in case it should be deleted. So not only did Dr. Hansen make the claims in the late 1980’s, he reaffirmed his predictions again in 2001.
When we reported the story in 2011, saying Hansen’s prediction was falsified, it made some waves, and lo and behold, the reporter comes to the rescue of Hansen, by moving the goalposts out another 20 years.
See the relevant excerpt below:
Michaels also has the facts wrong about a 1988 interview of me by Bob Reiss, in which Reiss asked me to speculate on changes that might happen in New York City in 40 years assuming CO2 doubled in amount. Michaels has it as 20 years, not 40 years, with no mention of doubled CO2. Reiss verified this fact to me, but he later sent the message:
“I went back to my book and re-read the interview I had with you. I am embarrassed to say that although the book text is correct, in remembering our original conversation, during a casual phone interview with a Salon magazine reporter in 2001 I was off in years. What I asked you originally at your office window was for a prediction of what Broadway would look like in 40 years, not 20. But when I spoke to the Salon reporter 10 years later probably because I’d been watching the predictions come true, I remembered it as a 20 year question.“
Source: this update on Dr. Hansen’s personal web page at Columbia University. In my original story, I quoted from Reiss here in the Salon interview.
But here’s the thing, whether its 20 or 40 years, it makes no difference. Hansen’s claim of the “The West Side Highwaywill be under water.” is still falsified by actual data.
Let’s look at the tide gauge in New York and see what it says.

Here’s the PSMSL page that is the source of the above graphic and data http://www.psmsl.org/data/obtaining/stations/12.php
You can see the terrifying surge of acceleration in the sea level due to increasing GHGs in the 20th century. Willis downloaded and plotted the data to see what the slope looked like, and then plotted a linear average line.
Here it is overlaid with the Colorado satellite data. Note the rate of rise is unchanged:

At 11 inches per century, there’s a real problem with Hansen’s claim of sea level rise covering the Westside Highway. He’s betting on acceleration of sea level rise due to increased CO2, but the trend is clearly linear, not exponential.
Additionally and inconveniently, this peer reviewed paper from the Journal of Coastal Research says: “worldwide-temperature increase has not produced acceleration of global sea level over the past 100 years”
The results are stunning for their contradiction of AGW theories which suggest global warming would accelerate sea level rise during the last century.

“Our first analysis determined the acceleration, a2, for each of the 57 records with results tabulated in Table 1 and shown in Figure 4. There is almost a balance with 30 gauge records showing deceleration and 27 showing acceleration, clustering around 0.0 mm/y2.”
…
The near balance of accelerations and decelerations is mirrored in worldwidegauge records as shown in Miller and Douglas (2006)
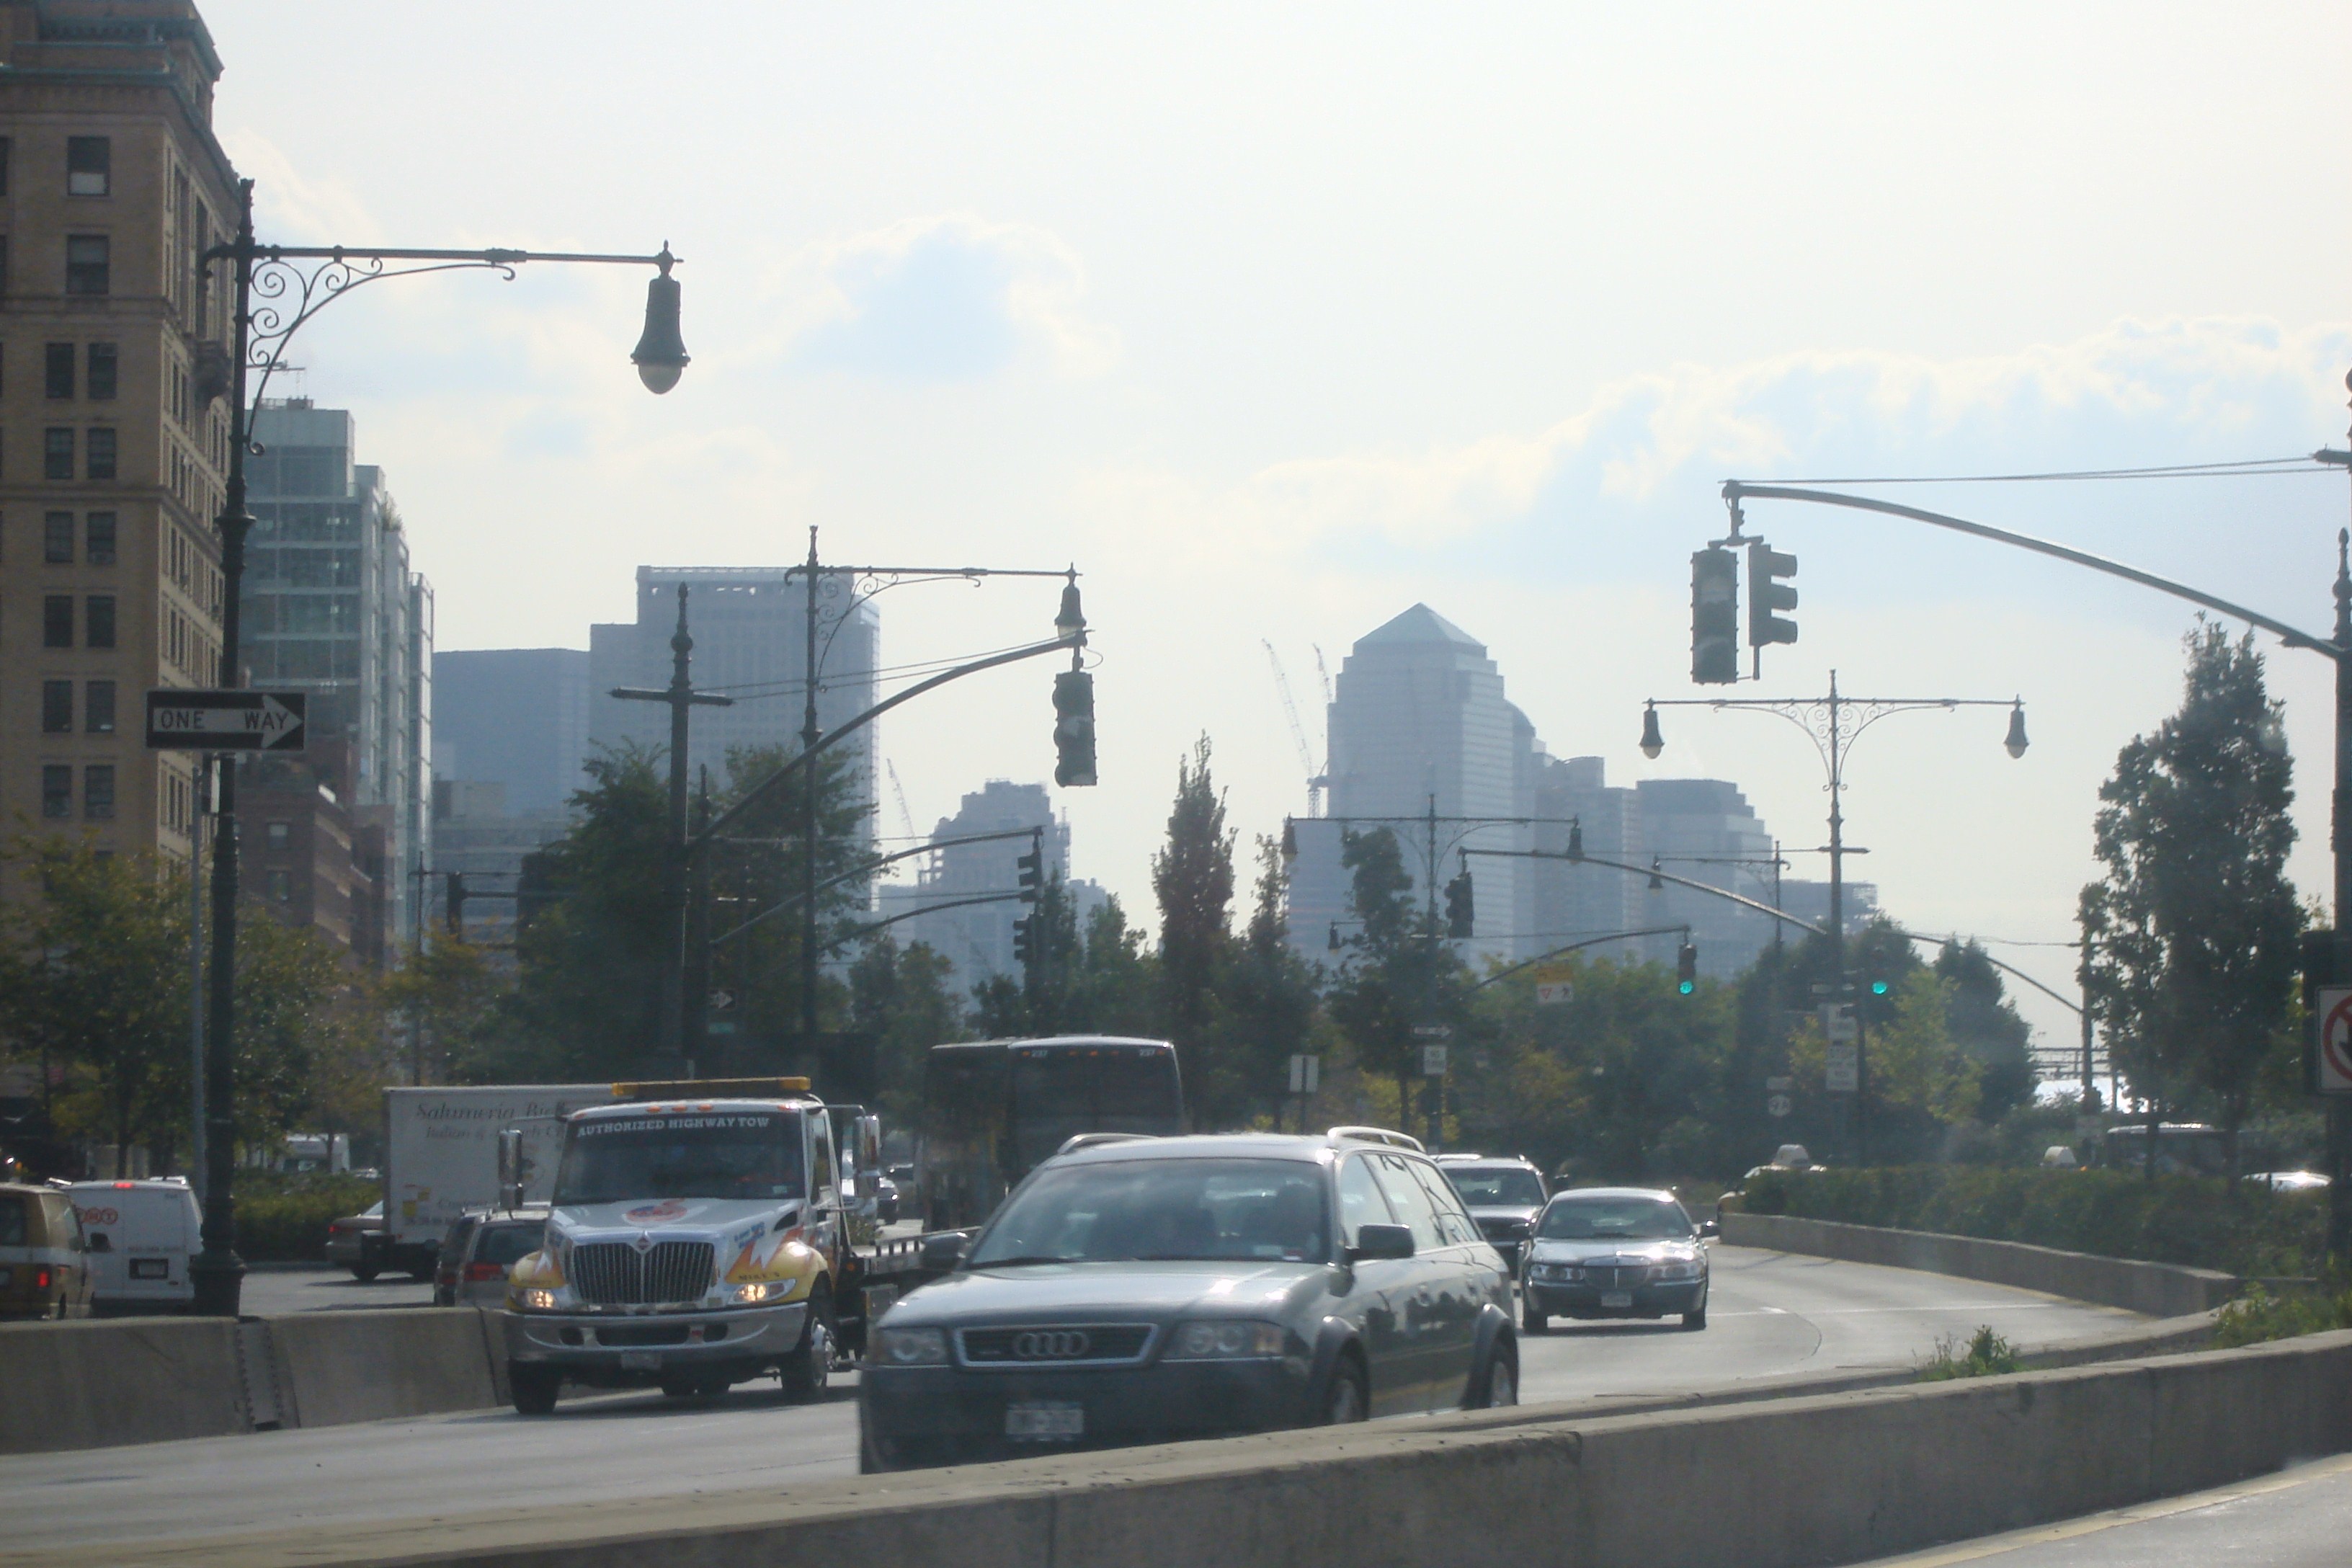
As of this update in July 2015, we’re 27 years into his prediction of the West Side Highway being underwater. From what I can measure in Google Earth, Dr. Hansen would need at least a ten foot rise in forty years to make his prediction work. See this image below from Google Earth where I placed the point over the WestSide Highway, near the famous landmark and museum, the USS Intrepid:

The lat/lon should you wish to check yourself is: 40.764572° -73.998498°
Here’s a ground level view (via a tourist photo) so you can see the vertical distance from the roadway to the sea level on that day and tide condition. Sure looks like at least 10 feet to me.

According to the actual data, after 27 years, we’ve seen about a 2.6 inch rise. There’ s still a very long way to go to ten feet to cover the West Side Highway there.
To reach the goal he predicted in 1988, Dr. Hansen needs to motivate the sea to do his bidding, he’s going have to kick it in high gear and use a higher octane climate driver than CO2 if he’s going to get there.
Problem is, here it is some 27 years later, and people still drive that highway today without the use of Jet-Skis.
Of course when you live in a modeled world of the future, rather than the real world of the present, anything is possible.
Now for part two.
I recently highlighted the press release and paper from Dutton et al. titled “Sea-level rise due to polar ice-sheet mass loss during past warm periods” in this WUWT story:
Claim: 20-foot sea-level rise in our future (except nature isn’t cooperating so far)
They had this graphic to ramp up the correlation fear of rising CO2 and rising sea level:

In that story there is this interesting statement that appears on the AAAS/Science website about the paper, emphasis mine:
ADVANCES
Interdisciplinary studies of geologic archives have ushered in a new era of deciphering magnitudes, rates, and sources of sea-level rise. Advances in our understanding of polar ice-sheet response to warmer climates have been made through an increase in the number and geographic distribution of sea-level reconstructions, better ice-sheet constraints, and the recognition that several geophysical processes cause spatially complex patterns in sea level. In particular, accounting for glacial isostatic processes helps to decipher spatial variability in coastal sea-level records and has reconciled a number of site-specific sea-level reconstructions for warm periods that have occurred within the past several hundred thousand years. This enables us to infer that during recent interglacial periods, small increases in global mean temperature and just a few degrees of polar warming relative to the preindustrial period resulted in ≥6 m of GMSL rise. Mantle-driven dynamic topography introduces large uncertainties on longer time scales, affecting reconstructions for time periods such as the Pliocene (~3 million years ago), when atmospheric CO2 was ~400 parts per million (ppm), similar to that of the present. Both modeling and field evidence suggest that polar ice sheets were smaller during this time period, but because dynamic topography can cause tens of meters of vertical displacement at Earth’s surface on million-year time scales and uncertainty in model predictions of this signal are large, it is currently not possible to make a precise estimate of peak GMSL during the Pliocene.
Even with the uncertainty factors, a conclusion we can draw from that is that CO2 at present day levels seemed to have no significant effect on sea level rise in that era.
It is clear from that statement that despite no help from greenhouse gas levels, past interglacial periods had higher temperatures than the present and sea levels were significantly higher. The new study in Science magazine shows that in previous interglacial periods, some shorter than our present interglacial, sea levels were as much as 20 to 42 feet higher than during the present interglacial period, and temperatures were also consistently warmer, yet carbon dioxide levels were the same as or lower than they are now, suggesting atmospheric greenhouse gases have not been drivers of significant sea level rise during that period.
 Like with this scary claim from National Geographic even if we do see sea level rise continuously, we may very well be into the next ice age before it happens:
I wrote then:
How long will it take to reach the NatGeo waterline in the cover photo?
The mean sea level trend is 2.77 millimeters per year. At that rate we have:
65.2 meters = 65200 millimeters / 2.77 mm/yr = 23537.9 years
That’s right, 23 thousand 500 years!
A new ice age will likely be well underway then, dropping sea levels. The water would never get there. That’s assuming the statue still exists there at all. Ironically, Liberty Island is a remnant of the last ice age:
Liberty Island is a small 12.7-acre island in New York Harbor. As a remnant of last glacial age, it is composed of sand and small stones deposited as the glaciers retreated.
Even if we believe that sea level will accelerate to 2 or 3 times that rate (as some proponents would have us believe), we are still looking at thousands of years into the future. At a 3x rate, we are looking at 7846 years into the future.
And then there’s this story I wrote back in 2010, Freaking out about NYC sea level rise is easy to do when you don’t pay attention to history
It was about this image:

Turns out it will take about 26,000 years to reach that level.
As I said in the title, the fears of catastrophic CO2 driven sea level rise seem to be little more than a spurious correlation in the minds of alarmists.