Guest Post by Willis Eschenbach
I’ve been thinking about the idea of the urban heat island (UHI) as a result of my post on the bogus temperature “record” at Heathrow. The “urban heat island” refers to the fact that cities generally run warmer than the surrounding countryside. This is from some combination of the direct heat generated by fuel use, and the land surface change (more buildings, more asphalt, less grass and trees). In this regard, I ran across a very interesting interactive map today from a professor named Modi. It shows the energy used by buildings in New York, block by block. It was run on ZDNet under the subhead of “Midtown Manhattan uses more energy than Kenya”, which is an interesting statistic in itself. Here is a view of the map:
 Figure 1. Energy use in downtown Manhattan, along with some of the boroughs. Click for a larger version.
This is just one view of an interactive map of NYC energy use by buildings, produced at Columbia University. So why was this map interesting to me? Well, it’s because of the values in the legend. Let me translate them into units that we are more familiar with, watts per square metre (W/m2) of land area …
 Figure 2. Energy use in downtown Manhattan, along with some of the boroughs, expressed in W/m2. Click for a larger version.
Dang … just … dang.
Finally, please note that authors point out that this is NOT the total block-by-block energy consumption in NYC. It is only the energy used in buildings for heating, cooling electricity, and hot water. It does NOT include such things as fuel for the vehicles used in the areas, nor electricity to run the subway system, the street lighting, the traffic signals, or the pumps to supply water to the buildings and take away the sewage. The article says:
Still, Modi [the developer of the map] said he hoped city residents would see his map as a call to cool their behavior at home. Across the city, 75% of all energy comes from buildings, according to the study, whereas nationwide buildings only account for 40%. (The main reason for the difference: fewer New Yorkers drive.)
So for the full energy use in Manhattan, you could jack all of those energy use numbers up by about 1/3 …
Finally, are Dr. Modi’s numbers right? I have no idea … but if they are, then UHI is no mystery …
w.
[UPDATE] WUWT reader usurbrain commented below:
And do not forget to add the human heat load, ~100 watts per hour emitted by each human working in the building. …
To which I replied as follows:
Human heat load … good thought, usurbrain. For the population I get the following:
<blockquote>… approximately 4 million people on a typical weekday, 2.9 million on a weekend day, and a weekday night population of 2.05 million.</blockquote>
Assuming I’ve not made some arithmetical error, this gives a weighted 24/7 average of 3E+6 humans on the island. Manhattan is 87.5 square km, or 8.7E+7 square metres. In other words, we have 0.03 humanoids per square metre.
I fear, however, that you’ve underestimated the energy production of your average American heat generating unit, we’re world champion caliber in that regard. The average American heat generating unit has a fuel consumption given by the USDA as 2,640 calories for men and 1,785 for women, an average of 2212 calories of fuel per generating unit. And since in the longer term humans are 100% efficient at turning fuel into heat, that converts to about 107 watts continuous.
Put that together and we get 0.03 heat producing units per square metre times 107 watts per unit gives us just over 3 W/m2 of extra ground-level energy to add to the UHI mix …
Not insignificant, to be sure.
Willis This is the hometown for UN headquarters I think you’ve made an error
Willis: Did you account for the fact that dietary “calories” in the US are more properly expressed as kilocalories when speaking in scientific terms?
His use of 107 watts is a good start. For NYC I would have used 125 watts.
Average activity adds to the basal metabolism. Typical male basal metabolism of 100 watts increases to 135 to 150 watts for most average office workers. Some jobs are more strenuous than others. Most people don’t use stairs, they use the elevator.
Adult female basal metabolism is 70 watts on average. Adding typical working activity means a real metabolism of 100 watts averaged over 24 hours. Those numbers directly translate into average daily food caloric intake.
Active teenagers often have higher metabolism on a per weight basis, but they are smaller than adults. Some teens just sit like blobs.
“Average activity adds to the basal metabolism.”
“Some jobs are more strenuous than others. Most people don’t use stairs, they use the elevator.”
“Active teenagers often… are smaller than adults.”
I feel like I just sat through a Captain Obvious commercial.
Is that you, Cap’n?
*sorry, could not resist*
I remember an infomercial that ran in the middle of the night some years back, made by a guy who claimed the secret to weight loss was just to drink cold water in large amounts.
He sat there and did all these calculations, showing that by the time your body heated up ice water to body temp a person would burn a huge amount of calories.
I suppose the idea was just to get people all excited about the prospect of losing weight by sitting back and drinking ice cold water, so they would buy his book. Either that or he did not know that a food “Calorie” is a kilocalorie, which is why it is always (properly) spelled with a capital C.
Whatever was the actual case, of course his calculations were off by three orders of magnitude. Drinking a liter of ice water will not force your body to burn 37,000 calories. Only 37.
You would die long before you drank enough to burn off a bag of chips.
So my drinking red wine with ice cubes is not helping me lose weight???? OMG…/Sarc off
Keep drinking the wine, but do it outside in a nice windy spot in the shade where you will lose more heat by evaporation of perspiration. 🙂
Urban Heat island also involves wind reduction by buildings, making air cooling less effective.
Please provide references for what you are talking about. Downtown high-rises typically increase wind speed, increasing convective heat losses.
Structures increase wind speed inasmuch as they decrease the area through which the air is flowing (tunneling). Upwind, the air is heated by compression. But even if the heating is negligible, buildings are air-conditioned when the outside air is warm. How will convective heat loss from an air-conditioned building be increased if the building is cooler than the air flowing around it?
There will be convection from air conditioning compressor exhaust on the rooftops. But buildings also create turbulence, and some of that hot air could be sucked down on the lee side of the building where air pressure may be reduced.
Really surprised you are not using BTUH like most US engineers do. Humans typically emit 250 BTUH sensible and 250 BTUH latent, based on ASHRAE analysis in an office environment. This is accounted for already in the building energy use, so you can’t double count it.
If you have ever flown into NYC, and looked at all the rooftops and observed all the louvers in the elevator penthouses? Those represent air losses due to thermal stack effect, which contributes greatly to UHI.
The energy waste in NYC is absolutely sickening due to poor architectural and engineering design.
” … (metabolism)… is accounted for already in the building energy use, so you can’t double count it.”
THIS. I don’t think there is not a lot of heavy manufacturing going on there, so it seems likely that the majority of the energy is expended for climate control. ALL of the heat absorbed or emitted by life forms (whether for heating or cooling) inside the building gets accounted for in the energy consumption for climate control.
Plus something else I looked for and did not find:
Presumably the energy consumption (and dissipation) for the area is elevated primarily due to the presence of high-rise buildings. Often the waste energy from air conditioning is discharged from these buildings by heat exchangers at roof level. In winter when the energy is purposely spent for heating, virtually all of the dissipation by radiation and convection happens at elevations above ground level. Figuring out how much of an increase will be measured by temperature sensors at ground level due to heat being dumped at a higher elevation is problematic at best. So the map is interesting but the relation of anthropogenic energy dissipation to Urban Heat Island effect is not so easy to establish as first-approximation intuition might suggest.
Thermodynamics modeling gets complicated even in simple scenarios. It might be that alteration of emissivity and reverbration of long-wave radiation between buildings dominates the micro-climate that comprises the Heat Island effect. On most days.
I think a lot of any effect is based on where the weather station is located. I’m about 35 miles from the airport, and there tends to be as much as a 5F difference between the airport and local stations. At 9:25AM there’s a 2F difference.
By itself that single station at the airport doesn’t have a lot of impact, but because of processing that 2F get spread around to potentially thousands (if not 10’s of thousands) of sq miles of surface area.
Willis this comment
To be found at an interesting blog here
http://clivebest.com/blog/?p=6721
More significant in winter than in summer. It’s not simply the energy used, but the tempersture at which the energy is emitted. A car engine has more effect than a bunch of humans producing the same energy. If the ambient air temperature is 37C then all the humans in New York won’t add to it, but the car engines still will. In Winter however, the human energy will cause heat flow into the surrounding atmosphere
Metabolic energy gets dissipated regardless of ambient temperature or you die. That’s why we sweat.
Is there a corresponding infra red of New York? This is the only one I can find:
http://exonews.org/wp-content/uploads/2012/05/New_York_City_from_space-SPL.jpg
It does seem difficult finding IR images of the earth’s surface although I may not be looking hard enough.
‘the bogus temperature “record” at Heathrow.’
____
A righteous blueprint for non BBC adhearants.
_____
Well done. Thx – Hans
Half the cause of the rise of the CAGW conjecture and the accompanying attempt to induce panic is that there are too many people in zip codes 02138, 10021 and 20001 and that they extrapolate from their own experience.
The problem doesn’t occur in the Northwest Territories or Eastern Siberia or among those who spend time aboard small sailboats crossing oceans.
[Cambridge, Mass; upper East Side (Central Park), NY; Washington DC .mod]
I resent that remark as a former resident of 02138 (we didn’t move, the Post Office switched ZIP codes in the middle of the night. Even worse they didn’t give 01776 to Lexington or Concord). The real problem is 80305.
[Boulder Colorado, National Center for Atmospheric Research (the climate modeling Mecca-Medina-Gaia-Utopia.) .mod]
I’ll add 80305 to the list.
I have discovered (the hard way, of course) that the use of zip codes helps confound the Thought Police of NPR who do their utmost to suppress contrary climate opinion.
Willis,
I might be completely out in left field, but your calorie calculation of human heat output may have left out the caloric value of human waste. I might consume three thousand calories of food, that does not mean that I have every calorie at my disposal, because some of them ended up in the disposal [fixture]
A couple of years back I was in New Orleans. In a park there was a temperate recording station. Across from the park was a 20 year old tourist building made of concrete. The road was black asphalt. And, to top it off a four lane black asphalt road between the park and tourist center filled with tour busses with engines running.
The global warming is a bad joke perpetuated by special hires who are seriously mentally challenged. Of course they are Democrats and true to their collective insanity. The government of the United States is a sick joke, as well as, lethal to its’ citizens.
The most dangerous thing that can be attributed to climate change are the effects of government policy intended to “combat climate change”.
Thanks for this – it has given some food for thought.
I am inclined to think that there is a limit to the UHI efect on temperatures such that once a city is fully built there would be no more increase from greater growth – sort of a step jump from rural to urban and then a constant difference to the rural. With this in mind, I was cautious in using a straightforward “UHI is proportional to city population size” kind of calculation to try and adjust for it.
However, I see that there can still be further intensification within a developing city (as nicely shown by the images provided here) and that there may not be the same kind of step change. At the same time, most towns and small cities still grow out rather than up these days and once you have made the first change to concrete and asphalt I think the rate of change (compared to non-urban affected temperatures) would be quite a bit less.
Bottom-line – UHI effect on surface temp is more complicated than a simple “proportional to city population” effect, but also not a single step change as I (used to) think.
At the end of the day, why are we still trying to use surface stations to measure climate? Weather stations are just that – for measuring the weather not the climate!
I used this as part of the ‘Theory’ I used processing surface data, I look at the day to day change for each station by itself, how the station cools over night as well as in winter. I [think new construction] would alter the temps for a day, then the new day to day change blends in with weather and climate, thousands of stations while they are all building, won’t build on the same day, as long as cooling during the winter wipes it out, all it can do is make the summer peak warmer. On the longest day of the year, it also has the shortest night, on clear nights it cools until the Sun comes up. All the way to the shortest day which has a very short warming period followed by a long cooling night.


When you look at the data like this, UHI will be small steps randomly placed, weather which at least on some scales overpowers UHI, and the seasonal change completely removes it’s year to year effect. This leave Climate, but only climate that exceeds the average weather for any particular collection of stations.
For instance, looking at all global stations, would you expect weather to force all of the the same amount? I would expect weather to average out once you have some arbitrarily large sized collection of stations. Climate would effect that collection, UHI as long as it doesn’t carry over from one year to the other disappears. Leaving the impact of Climate, but what I found was a strong regional effect that was not a trend, but periodic effects, and there’s only one large periodic forcing that moves around the planet, the oceans.
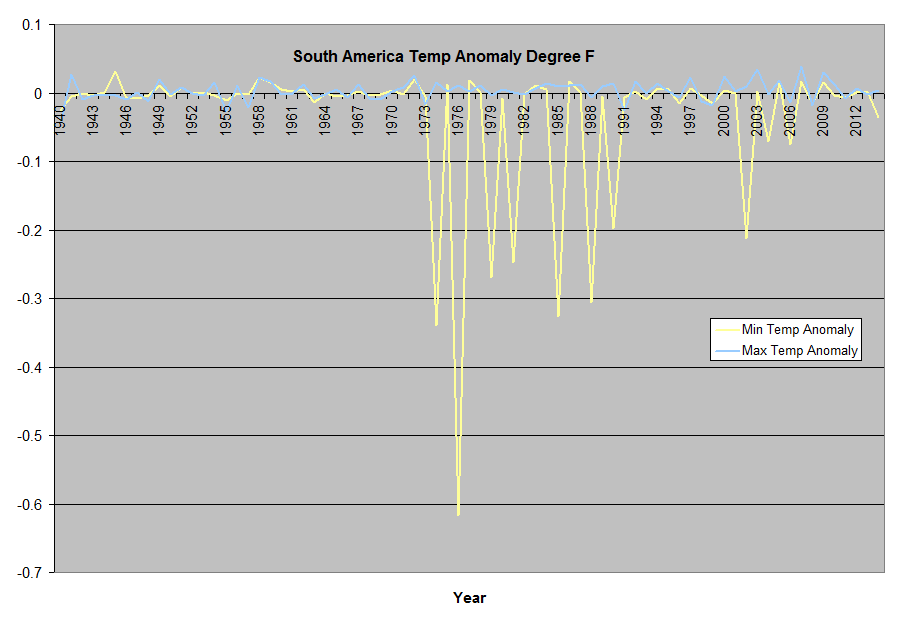
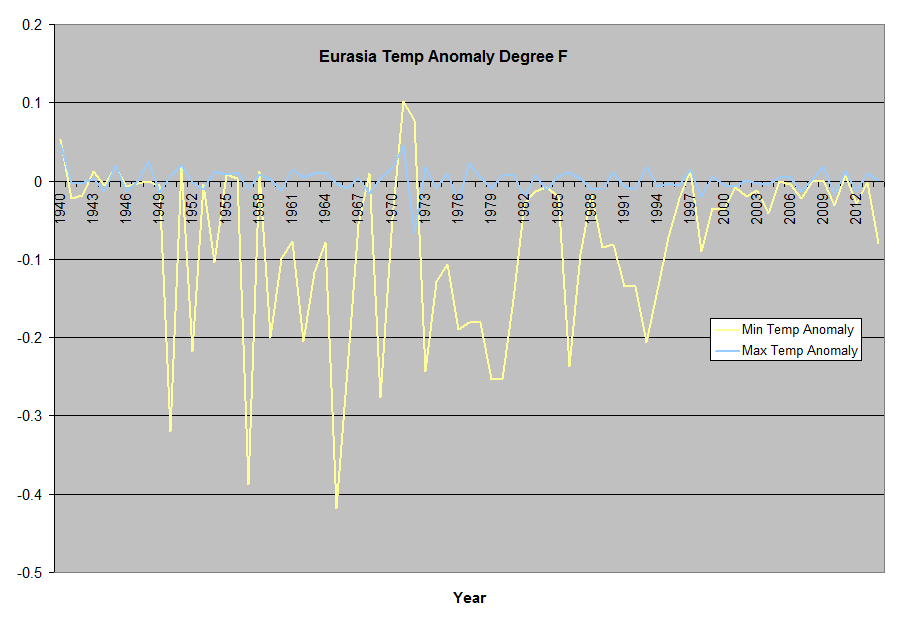
Only NAmerica and Eurasia have enough stations to dampen out weather, but even then you can see that annually average weather doesn’t have a residual trend, only the oceans moving around. That was the warming of the 80/90’s the oceans moved a lot of warm water downwind of first Eurasia, then the US.
It should be
Here’s a link to the data for the 1×1 cell of 40N 73W
https://micro6500blog.files.wordpress.com/2015/07/y_n41w73.xls
micro6500
Rather, new construction occurs over a long time of
(1) nearby disruption and demolition – which will open up space and can dramatically change the local sunshine and local heat island issues.
(2) construction itself (includes landscaping!) of 9 – 18 months. Not actually too much “energy” used at the local site, but frequent sunshine blockage or temporary building construction or roadway and ramp changes.
(3) initial occupancy = AT LEAST one year before the local “climate” stabilizes: New energy released (heat and AC changes to the local air), new wind patterns all year, new sunshine site angles and shadows and solar-reflected energy to and from local buildings and parking lots, new traffic patterns, etc.
Fair enough, but don’t you think that day to day changes will be more transient in nature, and look more like weather than climate?
@RACookPE1978
BTW, I finally got through doing all (well most all) of the code to calculate station solar forcing from the equation you gave me, it’s the daily forcing in the first graph, I wanted to again say thanks!
@micro6500When you look at the data like this, UHI will be small steps randomly placed, weather which at least on some scales overpowers UHI, and the seasonal change completely removes it’s year to year effect. This leave Climate, but only climate that exceeds the average weather for any particular collection of stations.
Climate would effect that collection, UHI as long as it doesn’t carry over from one year to the other disappears.
How can a dumb thermometer know the difference between “Climate Change” and someone erecting brick buildings, shiny glass wall, and multi-kilowatt air conditioners that influence the thermometer? Having thousand of thermometers doesn’t help if most of them are subjected to the same urban development influences. Thermometers cannot tell the difference between UHI and (real) Climate Change.
The fatal assumption that BEST makes is that they can spot just the hypothesized UHI step changes, and snip the record at that point. But all they do is bake in REAL UHI changes and instrument drift over months and years and tag it mistakenly as climate change. I believe you are making the same mistake.
UHI change is a longer lived event than is the sun-spot cycle and ENSO.
Which is why I don’t do what BEST does, the best description is I look for trends in the day to day change that end up in the yearly average , not short term trends that average way with a group of stations.
Stephen,
I saw your post again, and it reminded me of something I think is not well described.
What exactly are we looking for in the temperature record?
A change in peak temperature?
A change in minimum temperature?
A change in how much temps go up each day?
Annual average where most of the planet isn’t actually measured?
Annual average of station measurements?
As we consider this, we have to understand how each cause(UHI,Co2, etc) impacts each of these measurements, can we tell the difference between UHI and Co2 in the measurements?
Glad to see the direct heat production of megalopoles considered . I did 20 years in Manhattan ; was lucky to be along a edge by the East River , But walking thru the heating and air conditioning vents from highrises on a ninety degree anyway day was an unappreciated additional shirt-soaker . The extra heat generated by the valiant efforts of the industrial AC units working to produce islands of comparative comfort in the subway stations always made me think of how much heat they were adding to the ambient temperature they were battling .
And , of course , for all the electric energy released in the city , an equal amount has to be dissipated at the power station . These terawatt hours are not negligible .
The human heat load would be factored into the Air Conditioning load.
Thanks, JN, but I don’t think so. Consider. A person is standing in a room. They are putting out 100 W/m2. When you turn on the air conditioning, it doesn’t get rid of that 100 W/m2. Energy can’t be created or destroyed. All it does is pump the 100 W/m2 from inside the building to outside of the building.
Now, as soon as you turn on the air conditioner it has to do work to move that heat outside … but that is work IN ADDITION TO the heat that it is moving.
All the best,
w.
Years ago I went to an EPA seminar about addressing UHI. Four years later the same group effectively told me that UHI has no impact on warming. I just wish the government could come up with consistent data.
It is amazing, and must surely give some UHI.
But think of it opposite: So much energy released artificial (equal to the insolation which is still there), and even then the temperature rise is benign.
How does it compare with the climateers prediction of a boiling planet for just a few more w/m2?
The ice extend in Arctic is often measured in Manhattans, so how many Manhattans of ice would be needed to cool it down.
12,000 BTU per ton of ice. That is a lot of air conditioning systems locked up in all of that ice.
And consider how much ice is lost in the summer and then regrows every winter, the cooling to space as well as energy from the Sun in the summer is astounding.
And as you rightly note, they’ve gone all buggered over a couple watts/meter^2.
Willis, thanks for a brilliant take
W/m^2 is a UNfamiliar unit to most people, but it is a fair unit of measure for the climate crowd.
Convert the waste energy going into NYC into cataclysmic climate change energy densities and then ask, “Where is the cataclysm? “
I find that more data is always good for extending the conversation. Here, from the marvelous site GapMinder, I’ve taken their data to create the following chart …
Curiously, the anthropogenic energy per square metre of China and the US are about the same … always more for me to learn.
w.
Willis,
I am wondering if there is another factor to include which I started wondering about when reading your Heathrow analysis. Would the concentration of CO2 be higher in a city (or airport for that matter)? Does that suggest that there would also be higher CO2 inspired down welling radiation? So is it reasonable to assume that the classic “greenhouse” effect would actually be more pronounced in cities and other places of concentrated CO2 emission? I am not sure where to start with that calculation. Does anybody actually measure CO2 concentration in New York – or is it too low in the atmosphere, or too rapidly dispersed to matter, or would the aerosols from the city effectively cancel it out?
When you look at satellite data, the spread of min to max is only 5-10 ppm, not a lot.
But as I showed with my IR temps, I took them again at midnight, and while the sir, grass and sky were much colder, the concrete and asphalt were still much warmer, I’ll put up a graph shortly.
Air temp = 63F at midnight
Concrete=~70F
Grass=~59F
Asphalt=~75F
Sky= – 22F
Sunset was a couple minutes before local 9:00pm, Air temp peaked ~6:00pm @ur momisugly 80F, in 6 hours air temps dropped 17F, min temp this morning was @ur momisugly Sunrise 59F (sorry I didn’t get up early enough to get IR temps before the Sun was up).
But I think air temp isn’t the only player involved, it’s the ground temp + water vapor, just like the oceans radiating to space.
micro6500,
Thanks for replying. Interesting. So it looks like there would be no significant greenhouse effect island with such a small elevation in the co2 level, and likely that the surface radiation would substantially outweigh it even if there was.
Once again, thanks for responding.
It seems to me that the real players in air temps are water vapor, both because it carries a lot of latent heat with it and it’s impact on cooling rates, and land use/land temps.
Then the ratio of day to night as the seasons change.
If Co2 changes this it’s so small to be insignificant.
I haven’t a clue how to track it down. But, I’ve long wondered if our ‘air conditioning’ of our living spaces is a significant contributor to UHI. I’m not talking about accounting for the energy used to do the air conditioning or the heat generated by the machinery doing the conditioning. Rather, the actual conditioning.
We refer to our air conditioners as ‘heat pumps’ because that is exactly what they do. They move heat from a volume and push it into the surrounding environment.
If, when we are conditioning our air, we cool more than heat, accounting for geographies (northern heaters vs southern coolers) and seasons and stuff, then we are necessarily temporarily moving more heat out of our living spaces than we’re pushing in. Ergo, until air conditioning stops, we would be heating the environment in our urban areas with our ‘heat pumps’ by creating our little cool spaces.
The energy used to do the “moving” is all that really counts. Think of it as “pumping” the heat from the inside of the wall to the outside where it is leaking back to the inside, all you are really doing is “circulating the “heat”.
Reblogged this on Climate Collections and commented:
Willis Eschenbach discusses the Urban Heat Island on Manhattan
A guest post provides a glimpse of human body contribution.
Here’s a link to the 1969 paper by Dr. Leonard O. Myrup on UHI:
http://journals.ametsoc.org/doi/pdf/10.1175/1520-0450%281969%29008%3C0908%3AANMOTU%3E2.0.CO%3B2
A key component of UHI remains water: evaporation, irrigation, evapotranspiration, etc.