Just what you’d expect from 3 decades of dangerous global warming

CBS Boston has published a story with photographs of giant Icebergs washing ashore at Cape Cod, many of them metres thick.
According to CBS Boston;
WBZ-TV Chief Meteorologist Eric Fisher says this could be a “once-in-a-generation” event due to the extraordinary amount of ice on the Massachusetts Bay. Fisher says the ice won’t be around for long.
There have been several remarkable images left from the record-setting winter, including the nearly frozen waves captured off the coast of Nantucket last month.
http://boston.cbslocal.com/2015/03/09/giant-icebergs-wash-ashore-on-cape-cod/
Meanwhile, the Boston Globe reports:

The beaches of Cape Cod are taking on an Arctic look, even as the temperature warms.
Months of bitter cold created huge sheets of ice that are now breaking up and washing ashore. In Wellfleet, there are chunks of ice reminiscent of those found in much harsher climates.
https://www.bostonglobe.com/metro/2015/03/10/mini-icebergs-washing-ashore-along-cape-cod/jZJ8RIkyG9Rztlv0eJ3kMO/story.html
I guess nothing says “dangerous global warming” like a frozen ocean, or pictures of giant lumps of ice washing up on American beaches.
h/t IceAgeNow, story submitted by Eric Worrall
Further to Ren’s comments and map at Mar 11th 6.15a.m. & BFL’s map as well I always thought it interesting that the places that got the great ice caps were also the places that get the best aurorae observing now, perhaps by way of compensation?
Ah, I think I’ve worked out how (badmancaused) global warming actually is responsible. The SW US is abnormally warm, or something, which is definitely due to global warming, as 97% of sane human beings surely know. What’s happened is that the globally warmed SW US has stolen all the global warming from the NE US (which is just the sort of thing it would do, being badmancaused and all) causing local cooling there, and lots of badmancaused ice.
Anyhow, if we took an average, and included Cowton and Way . . .
Next, how Syria stole Antarctic warming . . .
Wow, I’m guessing JOHN KERRY moved his yacht?
and yet, the world recorded the warmest 12 months on record….go figure ?
Phil. you don’t know what you are talking about here, give it a rest. Nothing nefarious going on. And, unlike you. Mr. Stealey has the courage to put his name to his words.
Actually stealey’s posts are sometimes changed without indicating that they have been changed, I am not the only one who has commented on this (although my posts on that subject are censored). In the interest of transparency perhaps you could ask him to mark the changes he makes and date them? I put my name to all my posts and have used the same name on all the posts I have made here.
We still see numerous posts claiming that Arctic sea ice is not in a multi decade decline , or that glacial ice has not been declining, in spite of data to the contrary appearing in multiple sources. Is this not just rejection of science, but willful ignorance?
(Another wasted effort by a banned sockpuppet. Comment DELETED. -mod)
What is happening to Global Sea Ice Extent?
icoundwhatever, You tell me. It is a simple post showing arctic ice thickness measurements. It is not meant to be conclusive. It shows what it shows, and there is extensive collaborating evidence. If you want detail read these three links, and then call me back.
https://stevengoddard.wordpress.com/1970s-ice-age-scare/
https://stevengoddard.wordpress.com/polar-meltdown/
https://stevengoddard.wordpress.com/greenland-meltdown/
https://stevengoddard.wordpress.com/northwest-passage/
Phil, sorry to disappoint you with what you called not the same datum. However you will be relieved to know that the graphic you dissed IS NASA satellite data, prior to 1979, which matches the historical reports. (You are correct, they were not TOBS adjusted. (-; I will take satellite data over the charts from the 50s.
It is OK Phil, inconvenient data is ignored all the time. Take Heidi here….
https://stevengoddard.wordpress.com/2015/02/13/heidi-demonstrates-how-to-slime-the-public-through-maps/
gives a fine example of cheery picking decades.
icouldnthelpit
March 12, 2015 at 7:01 am
Global sea ice does NOT matter. The dominant effect of sea ice – at EITHER pole is reflection of immediate direct solar energy from the high-albedo sea ice back into space if sea ice is greater than average on any given day; plus the somewhat smaller absorption of solar energy into the open ocean if sea ice is lower than average on any given day.
So, sea ice at a given latitude on a given day? Might be, or might not be important to the world’s heat balance depending on latitude, season of the year, and day of year.
Total sea ice? Meaningless and distracting – every day of the year.
In addition, if sea ice is lower than normal at some assumed latitude and day-of-year, there may – OR MAY NOT be! – greater losses of thermal energy from the open ocean by convection, conduction, and evaporation and LW radiation than if sea ice is present. This difference in “other losses” depends on air temperature, winds, clouds, relative humidity and upper atmosphere temperatures – so do NOT assume the effect is the same every day, every hour, every season of the year.
Over the entire 12 months of ANY period, the edge of the Antarctic sea ice receives and reflects some 168% of the amount of solar energy received and absorbed into the Artic sea ice. SO, over the course of the entire year … Yes! That 32% – 50% of “excess” Antarctic sea ice matters much more than the 7% of missing Arctic sea ice.
warren, describe who said it was not in a multi decade decline. Sea ice has been recovering, with large increase in both extent and thickness, due to changes in ocean and wind currents.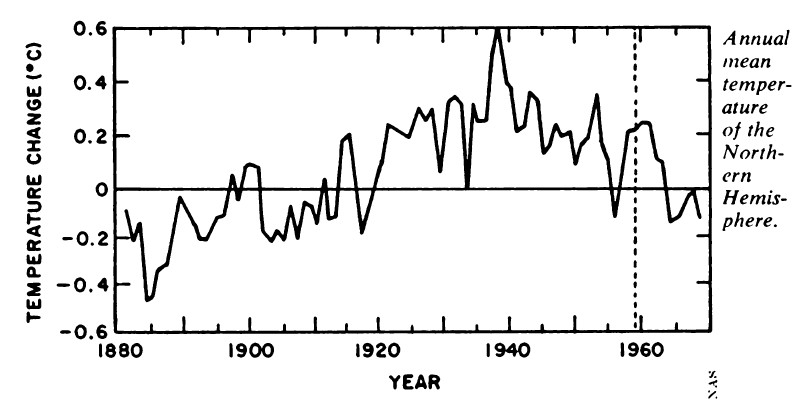


http://psc.apl.washington.edu/wordpress/wp-content/uploads/schweiger/ice_volume/BPIOMASIceVolumeAnomalyCurrentV2.1.png
warren, please note this chart begins in 1979. 1979 was a multi decadal high for NH sea ice. It was a multi decadal cherry pick of three decades. Warren, we actually have data prior to 1979. Do you want to see it?
Now warren, notice how NH T had dropped .6 degrees fro the 1940s high…
http://web.archive.org/web/20130621075830/http://www.sciencenews.org/view/download/id/37739/name/CHILLING_POSSIBILITIES
You see warren this cooling trend had been increasing Artic ice for , well multiple decades, See this 1970 NY Times article…
Every major climate organization endorsed the ice age scare, including NCAR, CRU, NAS, NASA – as did the CIA.
Now how may decades had this cooling trend been going on for.
International Team of Specialists Finds No End in Sight to 30-Year Cooling Trend in Northern Hemisphere.
http://query.nytimes.com/mem/archive/pdf?res=F40715F7395A13728DDDAC0894D9405B888BF1D3
Ice thickness is a repeated pattern, https://stevengoddard.wordpress.com/2014/09/06/arctic-sea-ice-is-the-same-thickness-as-1940-2/
According to the 1990 IPCC report, the Arctic sea ice anomaly in 1974 was almost -1.0 million km². Essentially identical to 2014. There has been no change in Arctic ice coverage over the past 40 years.
Now warren, who is being willfully ignorant?
(Another wasted effort by a banned sockpuppet. Comment DELETED. -mod)
Now warren, who is being willfully ignorant?
Apparently you are since you appear to think that the anomalies are based on the same datum!
Here’s a more reliable set of data which actually has the datum period indicated.
Apologies the annotation for the graph didn’t transfer, here it is:
Mean sea ice anomalies, 1953-2012: Sea ice extent departures from monthly means for the Northern Hemisphere. For January 1953 through December 1979, data have been obtained from the UK Hadley Centre and are based on operational ice charts and other sources. For January 1979 through December 2012, data are derived from passive microwave (SMMR / SSM/I). Image by Walt Meier and Julienne Stroeve, National Snow and Ice Data Center, University of Colorado, Boulder.
Phil and icouldwhatever see my response to your posts here.
http://wattsupwiththat.com/2015/03/11/giant-ice-chunks-washing-ashore-on-cape-cod/#comment-1881758
*FLASH*
The “REAL” (complete) Climate Cycle is approx. 100,000 years long.
Glacial to Interglacial and back.
The ice melts every single time.
.
The data-set they are using to try and predict this cycle is ~165 years. (1880-2015)
If you drew a line 1000 pixels wide (just less than white part of this page) representing the cycle ….
…. 1 pixel would = 1000 years.
You would not even be able to show how long the data-set is to compare it ….
…. because it’s impossible to display 16.5% of ONE pixel.
.
And some other food for thought.
The Interglacials (where we currently are in the cycle) typically last 10,000-20,000 years.
The current Interglacial began roughly 12,000 years ago.
Thus, we have been “in the window” for the next ice age to begin since the time of Christ.
.
http://www.scottcreighton.co.uk/images/Spiral-Precession/Glacial_eras.jpg
.
I see my math error in the middle comment – can’t see a way to edit here.
The point is the data-set in use is ridiculously small for the cycle they think they are going to predict with it.
there once was a Mann from Cape Cod,
whose spring-time beach ice was quite odd.
predictably lame,
he said “it’s the heat that’s to blame!”
no wonder people think he’s a daft sod.
There once was a Mann from Nantucket
whose beach so iced up he could suck it.
“the ice on the beach,
is because there’s more heat”
…if climastrology wasn’t ‘settled science’, we’d just chuck it.
Forecast polar vortex in the lower stratosphere means a significant cooling in the eastern US.
http://www.cpc.ncep.noaa.gov/products/stratosphere/strat_a_f/gif_files/gfs_z100_nh_f240.gif
It also seems very cold in Europe.
Such will be the position of the polar vortex at an altitude of about 20 km. Polar vortex shrinks due to the strong solar wind.
Frost returns to Boston.
http://oi59.tinypic.com/33enc3k.jpg
Can someone explain this to me…..I thought the Arctic was getting better.
http://nsidc.org/data/seaice_index/images/daily_images/N_stddev_timeseries_thumb.png
Now the surface of the ice in the Arctic will grow, just like last year (red).
http://arctic.atmos.uiuc.edu/cryosphere/arctic.sea.ice.interactive.html
So how did that turn out? Cold winters are delaying Maple Syrup production for the second year in a row.
https://stevengoddard.wordpress.com/2015/03/13/science-speaks-about-maple-syrup/
By Alex Sosnowski, AccuWeather.com Senior Meteorologist
March 13, 2015;
“With the mild weather making a widespread visit to the Midwest and Northeast during the second week of March, millions of people are wondering: Is warmth here to stay?
In short, people should not get used to the mild conditions over much of the northeastern quarter of the nation.”