Guest Post by John Goetz
Adjustments to temperature data continue to receive attention in the mainstream media and science blogs. Zeke Hausfather wrote an instructive post on the Climate Etc. blog last month explaining the rationale behind the Time of Observation (TOBS) adjustment. Mr. Hausfather pointed to the U.S. Climate Reference Network (CRN) as a source of fairly pristine data that can be used to analyze TOBS. In examining the CRN data, there is no doubt that the time of observation affects the minimum, maximum, and average temperature recorded on a given day. Also, changing the TOBS one or more times during a station’s history can affect the station’s temperature trend.
Temperature adjustments have bothered me not because they are made, but because there is a broad assumption that they skillfully fix a problem. Somehow, climate scientists are capable of adjusting oranges into apples. However, when adjustments are made to temperature data – whether to correct for TOBS, missing data entries, incorrect data logging, etc. – we are no longer left with data. We are left instead with a model of the original data. As with all models, there is a question of how accurately that model reflects reality.
After reading Mr. Hausfather’s post, I wondered how well the TOBS adjustments corrected the presumably flawed raw temperature data. In the process of searching for an answer, I came to the (preliminary) conclusion that TOBS and other adjustments are doing nothing to bring temperature data into clearer focus so that global temperature trends can be calculated with the certainty needed to round the results to the nearest hundredth of a degree C.
The CRN station in Kingston, RI is a good place to examine the efficacy of the TOBS adjustment. This is because it is one of several CRN pairs around the country. Kingston 1 NW and Kingston 1 W are CRN stations located in Rhode Island and separated by just under 1400 meters. Also, a USHCN station that NOAA adjusts for TOBS and later homogenizes is located about 50 meters from Kingston 1 NW. The locations of the stations can be seen on the following Google Earth image. Photos of the two CRN sites follow – Kingston 1 W on top and Kingston 1 NW on the bottom (both courtesy NCDC).


The following images are of the Kingston USHCN site from the Surface Stations Project. The project assigned the station a class 2 rating for the time period in question, 2003 – 2014. Stations with a class 1 or class 2 rating are regarded as producing reliable data (see the Climate Reference Network Rating Guide – adopted from NCDC Climate Reference Network Handbook, 2002, specifications for siting (section 2.2.1) of NOAA’s new Climate Reference Network). Only 11% of the stations surveyed by the project received a class 1 or 2 rating, so the Kingston USHCN site is one of the few regarded as producing reliable data. Ground level images by Gary Boden, aerial images captured by Evan Jones.


CRN data can be downloaded here. Download is cumbersome, because each year of data is stored in a separate directory, and each file represents a different station. Fortunately the file names are descriptive, showing the state and station name, so locating the two stations used in this analysis is straightforward. After downloading each year’s worth of data for a given station, they must be concatenated into a single file for analysis.
USHCN data can be downloaded here. The raw, TOBs, and homogenized (52i) files must be downloaded and unzipped into their directories. All data for a station is found in a single file in the unzipped directories. The Kingston USHCN data has a file name that begins with USH00374266.
Comparison of Kingston 1 NW and Kingston 1 W Temperatures
Both Kingston CRN stations began recording data in December, 2001. However, the records that month were incomplete (more than 20% of possible data missing). In 2002, Kingston 1 NW reported incomplete information for May, October, and November while Kingston 1 W had incomplete information for July. Because of this, CRN data from 2001 and 2002 are not included in the analysis.
The following chart shows the difference in temperature measurements between Kingston 1 NW and Kingston 1 W. The temperatures were determined by taking the average of the prior 24-hour minimum and maximum temperatures recorded at midnight. The y-axis is shown in degrees C times 100. The gray range shown centered at 0 degrees C is 1 degree F tall (+/- 0.5 degrees F). I put this range in all of the charts because it is a familiar measure to US readers and helps put the magnitude of differences in perspective.

Given the tight proximity of the two stations, I expected their records to track closely. I found it somewhat surprising that 22 of the months – or 15% – differed by the equivalent of half a degree F or more. This makes me wonder how meaningful (not to say accurate) homogenization algorithms are, particularly ones that make adjustments using stations up to 1200 Km. With this kind of variability occurring less than a mile apart, does it make sense to homogenize a station 50 or 100 miles away?
Comparison of Kingston 1 NW and Kingston 1 W Data Logging
A partial cause of the difference is interruption in data collection. Despite the high-tech equipment deployed at the two sites, interruptions occurred. Referring to the previous figure, the red dots indicate months when 24 or more data hours were not collected. The interruptions were not continuous, representing a few hours here and a few there of missing data. The two temperature outliers appear to be largely due to data missing from 79 and 68 hours, respectively. However, not all differences can be attributed to missing data.
In the period from 2003 through 2014, the two stations recorded temperatures during a minimum 89% of the monthly hours, and most months had more than 95% of the hours logged. The chart above shows that calculating a monthly average when missing 10-11% of the data can produce a result with questionable accuracy. However, NOAA will calculate a monthly average for GHCN stations missing up to nine days worth of data (see the DMFLAG description in ftp://ftp.ncdc.noaa.gov/pub/data/ushcn/v2.5/readme.txt). Depending on the month’s length, GHCN averages will be calculated despite missing up to a third of the data.
Comparison of Kingston USHCN and CRN Data
To test the skill of the TOBS adjustment NOAA applied to the Kingston USHCN site, a synthetic TOBS adjustment for the CRN site was calculated. The B91 forms for Kingston USHCN during 2003-2014 show a 4:30 PM observation time. Therefore, a synthetic CRN 4:30 PM observation was created by averaging the 4:00 PM and 5:00 PM observation data. The difference between the USHCN raw data and the synthetic CRN 4:30 observation is shown in the following figure. Despite a separation of approximately 50 meters, the two stations are producing very different results. Note that 2014 data is not included. This is because the 2014 USHCN data was incomplete at the time it was downloaded.

Although the data at the time of observation is very different, perhaps the adjustment from midnight (TOBS) is similar. The following figure represents the TOBS adjustment amount for the Kingston USHCN station minus the TOBS adjustment for the synthetic CRN 4:30 PM data. The USHCN TOBS adjustment amount was calculated by subtracting the USHCN raw data from the USHCN TOBS data. The CRN TOBS adjustment amount was calculated by subtracting the synthetic CRN 4:30 PM data from the CRN midnight observations. As can be seen in the following figure, TOBS adjustments to the USHCN data are very different than what would be warranted by the CRN data.

Adjustment Skill
The best test of adjustment skill is to take the homogenized data for the Kingston USHCN station and compare it to the midnight minimum / maximum temperature data collected from the Kingston CRN 1 NW station located approximately 50 meters away. This is shown in the following figure. Given the differences between the homogenized data from the USHCN station and the measured data from the nearby CRN station, it does not appear that the combined TOBS and homogenization adjustments produced a result that reflected real temperature data at this location.

Accuracy of Midnight TOBS
Whether the minimum and maximum temperatures are read at midnight or some other time, they represent just two samples used to calculate a daily average. The most accurate method of calculating the daily average temperature would be to sample continuously, and calculate an average over all samples collected during the day. The CRN stations sample temperature once every hour, so 24 samples are collected each day. Averaging the 24 samples collected during the day will give a more accurate measure of the day’s average temperature than simply looking at the minimum and maximum for the past 24 hours. This topic was covered in great detail by Lance Wallace in a guest post two and a half years ago. It is well worth another read.
The following chart shows the difference between using the CRN hourly temperatures to calculate the daily average, and the midnight minimum / maximum temperature. The chart tends to show that the hourly temperatures would produce a higher daily average at this station.

Discussion
Automated methods to adjust raw temperature data collected from USHCN stations (and by extension, GHCN stations) are intended to improve the accuracy of regional and global temperature calculations to, in part, better monitor trends in temperature change. However, such adjustments show questionable skill in correcting the presumed flaws in the raw data. When comparing the raw data and adjustments from a USHCN station to a nearby CRN station, no improvement is apparent. It could be argued that the adjustments degraded the results. Furthermore, additional uncertainty is introduced when monthly averages are computed from incomplete data. This uncertainty is propagated when adjustments are later made to the data.
A Note on Cherry-Picking
Some will undoubtedly claim that I cherry-picked the data to make a point, and they will be correct. I specifically looked for the closest-possible CRN and USHCN station pairs, with the USHCN station having a class 1 or 2 rating. My assumption was that their differences would be minimized. The fact that a second CRN station was located less than a mile away cemented the decision to analyze this location. If anyone is able to locate a CRN and USHCN pair closer than 50 meters, I will gladly analyze their differences.
================================
Edited to add clarification on y-axis units and meaning of the gray band to the description of each figure.
Edited to add links to the CRN and USHCN source data on the NCDC FTP site.
Does this analysis shed light on why it is that these adjustments always cause a upward change in the trend line compared to the unadjusted figures?
In the case of TOBS, that is clear. Vose et al 2005 show this plot of observation times over the years. The continuous lines are actual metedata – recorded times. Observers had been urged to read in the evening; this weakened over the years (many had to read the rain gauges in the morning). That moves from a warm bias to cool. Correcting has a warming effect.
http://www.moyhu.org.s3.amazonaws.com/misc/ushcn/vosetobs.png
Far to vague Nick. Taking the reading to early in the am could lead to a missed low vs a high. Take a reading in the afternoon, and the following days high was lower then the beginning of that days 24 hour period, then the 24 hour high taken actually the day before, right after the previous days reading was taken would register.
However, both before and after a certain afternoon time frame, or am time frame, this affect would diminish. So simply saying afternoon and evening, is nothing short of gross guesswork.
One simple soluton to the TOBS is to do nothing- start a new series with the time of observaton change and keep the data prior to time of observation change and after time of observation change separate.
Yes, I completely agree, but that wouldn’t allow the Mosher’s of the world to put their imprint on what they think the data should be.
Mr. Layman here.
It always struck me that trying to arrive at a “Global” temperature from all these instruments that were installed years ago to give local conditions is like trying to squeeze blood out of a turnip. It just ain’t there.
With or without a computer, we can’t project a rise in future “Global” temps if we don’t really know what they were in the past, let alone now.
As much as we may want one, no reliable baseline exist for the globe. Fiddling with the numbers only complicates things.
Temperature Adjustments
NOAA will calculate a monthly average for GHCN stations missing up to nine days worth of data (see the DMFLAG description in ftp://ftp.ncdc.noaa.gov/pub/da…..readme.txt). Depending on the month’s length, GHCN averages will be calculated despite missing up to a third of the data.
calculating a monthly average when missing 10-11% of the data can produce a result with questionable accuracy.
If reasons for missing data include problems accessing the data which are most likely to occur on the coldest days in higher latitudes [*fact] is there not a TOBS bias for warming the data present.
Given that the colder stations drop out more often does this not also warm the homogenization done?
Ben of Houston March 6, 2015 at 1:10 pm You know, I’ve never gotten the Time-of-day adjustment.
Me neither but it is correct, Zeke has an article at Climate Etc which sort of helps.
It’s a bit like the three door puzzle picking the car and the host shows you a goat behind one of the other 2 doors. Do you change your door to the last door ? Yes
Why? It’s very hard to explain and still doesn’t feel right though it assuredly is.
TOBS work both ways like a cooling bias if you check in the am then moved to a pm system?
A fantastic amount of time and effort is spent analysing surface temperature adjustments and, while it may well be an interesting topic in itself, it has no real influence on the argument for or against global warming. UAH is totally independent of GISS (and Hadcrut) but the warming trends are of similar magnitude. Since 1990 the trends are:
UAH +0.165 deg per decade
GISS +0.15 deg per decade
Sure it does. You can not prove AGW (not just global warming) if we had hotter temperatures in the past with lower levels of CO2. Looking back 25 years to prove that we are destroying planet is stupid beyond believe.
Surface records give you over 100 years of historical temperatures, much more belieavable period. Which is why removing warmth in 1930s is so important for alarmists.
The 1930s warmth is only relevant to the US. It seems a lot of Americans become confused by the fact that about 98% of the planets surface is not in the US.
John, I do not think so. Here is an earlier global NH north of 23 degrees. (NASA 1981 vs 1990)

Here is GISS global, (2002 vs 2014)
Here is global 1981, vs 2014
and here is Iceland stations…
I won’t bother to do more Iceland, as you get the idea.
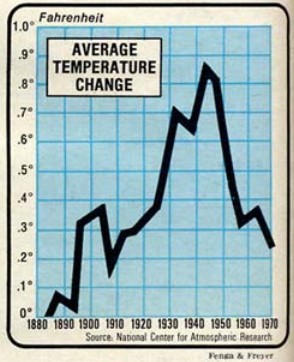
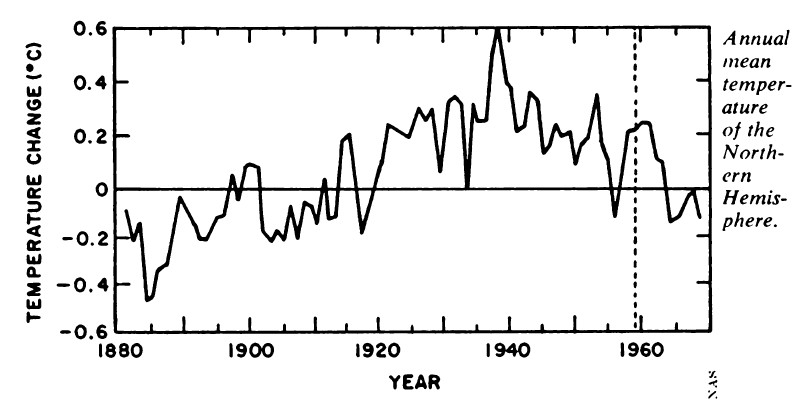
NCDC has dramatically cooled pre-1963 Northern Hemisphere temperatures since the 1975 National Academy of Sciences report.
Some more global for you..
The NH anomaly was at one time .6 degrees.
“Every major climate organization endorsed the ice age scare, including NCAR, CRU, NAS, NASA – as did the CIA.”
What was done to the US was done to the world.
John, in fact the CAGW proponent scientist talked about the 40s blip and said it would be good to remove it.” (Confirmation Bias?)
UAH shows 2014 as nowhere close to as warm as 1998. Either does RSS.
That’s because Lower Troposphere are much more responsive to El NIno. The GISS and UAH anomalies for 2014 were virtually identical if you use the 1981-2010 base period for both.
It’s more correct to say that UAH and RSS were much warmer than GISS in 1998. .
Not so, but best to just show you.

So UAH becomes the odd one out.
http://www.woodfortrees.org/graph/hadcrut4gl/from:1987/to:2016/plot/hadcrut4gl/from:2002/to:2015/trend/plot/hadcrut3gl/from:1987/to:2016/plot/hadcrut3gl/from:2002/to:2016/trend/plot/rss/from:1987/to:2016/plot/rss/from:2002/to:2016/trend/plot/hadsst2gl/from:1987/to:2016/plot/hadsst2gl/from:2002/to:2016/trend/plot/hadcrut4gl/from:1987/to:1997/trend/plot/hadcrut3gl/from:1987/to:1997/trend/plot/hadsst2gl/from:1987/to:1997/trend/plot/rss/from:1987/to:1997/trend/plot/uah/from:2002/to:2016/trend/plot/uah/from:1987/to:1997/trend
John Finn, you said…It’s more correct to say that UAH and RSS were much warmer than GISS in 1998. .

=========================================
Clearly both UAH and RSS were much warmer in 1998 period.
1998
2014
I’m not sure what the “Not so” refers to.
The GISS anomaly for 2014 is 0.28 (relative to 1981-2010)
data.giss.nasa.gov/cgi-bin/gistemp/nmaps.cgi?sat=4&sst=3&type=anoms&mean_gen=0112&year1=2014&year2=2014&base1=1981&base2=2010&radius=1200&pol=rob
Now tell me what the UAH anomaly was?
The GISS anomaly in 1998 was 0.21 (relative to 1981-2010).
http://data.giss.nasa.gov/cgi-bin/gistemp/nmaps.cgi?sat=4&sst=3&type=anoms&mean_gen=0112&year1=1998&year2=1998&base1=1981&base2=2010&radius=1200&pol=rob
UAH and RSS ‘measure’ temperatures of the LT which is more sensitive to ENSO, i.e. there are sharper spikes in both directions but the overall trends for UAH and GISS are similar.
Since every climate sceptic on the planet put great faith in the UAH temperature record for at least a decade or more and there appears to be no good reason abandon that faith, UAH is the dataset we should be using as the gold standard. You can’t keep switching form one to the other – without justification – just because the recent data doesn’t support your agenda.
Picking an anomaly relative to a certain base is , well relative and an anomaly. The question is do either UAH or RSS show any year close to as warm as 1998. The answer is no, they do not. Both show 2014 as nowhere near 1998, and both show 1998 as the “warmest year ever” to quote the CAGW phrase.
Both UAH and RSS are ballpark .3 degrees below 1998, both show 2010 and other years as warmer then 2014. Schmitt proclaimed a what, 34% chance that 2014 was the hottest year ever based on what.04 degrees. By that measure there is a 100 percent chance that RSS and UAH show that 2014 was not the warmest year ever.
Adjustment is an excuse to jigger the data in favor of one’s thesis. Any changes to time of observation are unfortunate but are best dealt with by increasing the overall uncertainty of the data. Isn’t there a science of bias? The existence of double blind experiments in the medical field is evidence of how easy it is to introduce bias even with the best of intentions.
Yes, where is the C.B adjustment. (Confirmation Bias.)
https://chiefio.wordpress.com/2010/12/13/the-rewritten-past/
Phil Jones, 1985, about the temperature decline after the 1930´ies:
“No satisfactory explanation for this cooling exists, and the cooling itself is perplexing because it is contrary to the trend expected from increasing atmospheric CO2 concentration. Changing Solar Activity and/or changes in explosive volcanic activity has been suggested as causes… but we suspect it may be an internal fluctuation possibly resulting from a change in North Atlantic deep water production rate.”
==============================
“So, Jones said in 1985 that: “the cooling itself is perplexing” – but why not say so today? And why don’t we see a “perplexing” cooling after 1940 in the IPCC graphic today? And furthermore, back in the early 1980´ies Jones appears to accept data as is at least to such an extent that he is considering how nature has produced these “perplexing” cooling data – like a real scientist should. (EM Smith)
Here are the changes made to GISS temperatures on just one day this February. Yellow is the new temperature assumption and strikeout is the previous number. Almost every single monthly temperature record from 1880 to 1950 was adjusted down by 0.01C.
I mean every freaking month is history suddenly got 0.01C colder. What the heck changed that made the records in 1880 0.01C colder. Did the old thermometre readers screw up that bad?
http://s2.postimg.org/eclux0yl5/GISS_Global_Adjustments_Feb_14_2015.png
GISS’ data comes from the NCDC so the NCDC carried out the same adjustments. They have been doing this every month since about 1999. So 16 years times 12 months/year times -0.01C of adjustments each month equals -1.92C of fake adjustments.
Lots of opportunity to create a fake warming signal. In fact, by now it is clear that 1880 was so cold that all of the crops failed and all of the animals froze and all of the human race starved to death or froze to death and we went extinct. 135 years ago today.
GISS and GHCN adjust for apparent non-climate events, and adjust backward, so present day readings are not affected. For example, when MMTS came in, past readings were raised or lowered to remove a discrepancy with MMTS.
There is nothing unusual about this. I looked here at how stock exchanges present historic stock prices. They adjust for dividends, share splits and issues etc. They are not the closing prices on the day, except recently. And when there is a dividend etc, it is all previous prices that are lowered.
Bad analogy, Nick. If a stock splits the effect is known and well defined.
If I own one share of Telstra valued at $100, and it splits, I now own two shares of Telstra worth $50 each — my total investment remains the same, and change in valuation applies to every shareholder.
If I own a weather station instead, the change in temperature data is arbitrary and not well defined. My weather station may or may not be affected by UHI effect, TOB adjustments. Regardless of the actual true affect on my data, my results (data) are adjusted and ultimately hidden.
Reg,
It’s still adjusting the past, constantly, and in the same way – back from the event. And for the same reason – something makes a change to the measured number, but reflects an effect different from what you are interested in.
But the effects aren’t necessarily well known. What if Telstra hives off part of its business and gives shareholders a stake in that? The worth of that has to be estimated.
What a crock Nick. What a great post Bill.
Data is data. ‘Adjustments’ are not data, any more than averaging.
Given the stock markets ability to get it wrong or be caught out they are hardly a an example of how this approach works without problems.
Bottom you cannot ‘adjust’ worth a dam if you do have a very good idea of what needs ‘adjusting ‘ and in what way . You can guess it , but that is all your really doing.
Nick Stokes explains…”For example, when MMTS came in, past readings were raised or lowered to remove a discrepancy with MMTS”
==============================================
So what “came in” to cause this change hum? ,,,and the one before that? …and before that?
(Prove me wrong, but I do not expect a real answer)
Basically all Nick said (with a convoluted stock market analogy) is there is a reason for the .01 changes still happening to the past.
Nick, we know there is a reason, it could be a great reason, it could be fraud, so explain it, and the others that keep happening, month after month.
Here’s a way to check what Bill Illis is saying using TheWayBackMachine.
http://data.giss.nasa.gov/gistemp/
(The basic site.)
http://data.giss.nasa.gov/gistemp/tabledata_v3/GLB.Ts+dSST.txt
(One of the data tables.)
http://web.archive.org/web/20120104220939/http://data.giss.nasa.gov/gistemp/tabledata_v3/GLB.Ts+dSST.txt
(The “same” data table as it was in 2012)
(To use http://archive.org/web/web.php enter the address of the page you’re looking into the main search box. If old versions have been archived you’ll see a calendar with years above it. The 2012 page above is the oldest GISS I could find.)
May I propose an experiment, to evaluate the skill of temperature correction?
The idea is that we take pairs of “relatively close” unadjusted stations, and treat them as a single station for the purposes of our analysis. (This will only work if the stations did not move/change over the time period in question.)
We can then create an artificial change-event for our meta-station by plexing it’s record from one station to the other. This is now a “known wrong”. If the adjustment software works correctly, it will do a good job of identifying the event and tracking the “correct” version of the meta-station. (Ie, the one we switched from.)
This gives us the ability to make “known wrongs” at will, and compare the “corrected” records with the “known right” records. (We can run almost unlimited versions of this experiment, by choosing different times and directions to our event.)
I’d call this a HASH analysis. (Holdback Analysis with Synthetic Errors) Who has the data to do this?
You might like this paper; it did something along the lines of what you are suggesting (adding in synthetic errors to known “perfect” data and testing the skill of homogenization to correct them): ftp://ftp.ncdc.noaa.gov/pub/data/ushcn/papers/williams-etal2012.pdf
Erik Gross,
See also this: http://surftempbenchmarking.blogspot.de/2014/11/release-of-daily-benchmark-dataset.html
Victor Venema has some comments here: http://variable-variability.blogspot.com/2014/11/participate-in-best-validation-study.html
I was going to ask Zeke if he was involved, but now I see that he is.
The problem of the TOB’s adjustment is more subtle than most people seem to think. It is only a problem if the usual observations take place around the normal high or low temperature of the day. Which can cause either a double counting of the highs or lows. Or if the location has temperature shifts that overpower the daily shifts.
It also presupposes that the record keepers were idiots and blindly recorded the position of the metal bars, instead of the actual temperature. In other words if the recorder normally records the temperature at the hottest part of the day and the mercury is a few degrees below, the recorder has to make a judgement call as to whether that really is the high temperature of the day.
Personally I think it is more accurate to trust the judgement of the original record keeper who knows whether a cold front came through and if the days min/max temperatures accurately reflect the days actual temps or if they are a residual of yesterdays temps.
I drove about 8 miles from home and saw a 5F swing in temps, the airport 20 miles away was 8 warmer still. So a 12 – 13F range over 30 miles, which is the average?
Plus i wonder about the difference of the temp taken in the middle of a field, vs in those woods off to the side.
Zeke,
Would you explain what is happening in the above data Bill Illis presents using “elimination of outliers and homogeneity adjustment” and how often those adjustments are made. Thanks.
Might be me, but seems many are missing the forest for othe trees here. Forget about TOBS and corrections. RGB is dead on. The big aha here is the variance in the observations among three stations in such close proximity. Where are Zeke’s and Mosher’s curiosity? Why aren’t they asking themselves “what implications does this have on our BEST models?”
Nice article. And real problems.
Algorithms adjusting temperature
will never work.
Real actual temperatures can
vary greatly based on so many micro
factors. I savor(and collect) “original
data”.
Averaging the temperature over the global scale is meaningless. General climate classifications we use temperatures of the global stations but not for calculating the trend. For this purpose extrapolation and interpolation distort the real picture. For different purposes we use different network. For studying micro-climate variation or urban to rural temperature change with changes in urban sprawl growth with the time. With the time changed the met network over the globe. Changed the manual observations to sophisticated automatic recording, etc. The average of a maximum and minimum thermometers based observations taken once a day may differ with the automatic data.
The time of observation will not affect maximum, minimum and average temperature recorded on a given day under traditional system but the temperature is measured for the one decimal point only [like 30.3 oC] but while taking an average depending upon the odd or even number of 1st decimal number, the rounding of second decimal of 0.05 will change by 0.1 oC after 1956 and 0.1 oF before 1957..
Dr. S. Jeevananda Reddy
.
The issue with automated stations is that as long has they chuck out data the temptation is to regard the data has valid without even knowing about any changes in the area of the station . After all not using the mark one eye ball is the very reason for automating it in the first place , but without that how do you know someone has not just planted a load of trees or built a drive way right next to it ?
In an ideal situation and if we actually doing good science, how many measurements of temperature would we need to have a worthwhile ‘average’ and how far are we actually away form that number ?
Is a question I never managed to get an answer to , you have to start from the basics , and these are do you have the ability to measure in the first place the very thing your basing your claims on.
If not your claims are never going to be better than ‘a guess’ no matter how intelligent.
I wish Zeke had explained and defended the “elimination of outliers and homogeneity adjustment” above. Maybe he still will? Zeke has twice presented guest posts at Climate Etc.about the adjustments saying, among other things that the adjustments have not changed the global temperature record significantly. To me, that’s one more reason not to do it. I am on record there as saying that the recorded data should be inviolate and footnotes should be used to explain differences in measurement methodology.
In the heated climate war atmosphere, we all know persons on both sides who would, from noble cause corruption, to change the recorded data. Much more likely- and I fear this is happening- confirmation bias might well play a part in creating those adjusting algorithms.
Thank you John Goertz for the post. My takeaway is the substantial difficulties of accurate temperature measurement outside laboratory conditions and the false precision of claimed measurements. When NOAA and NASA use this false precision to claim record warmth for year 2014 , we have propaganda, not science. Zeke- where are you?
should read above- be tempted to change the recorded data.
No j’accuse intended.
I have been flummoxed as to what to call what is commonly referred to as the temperature data record. “Model of the original Data” is the most precise description I have seen to date and brings further into focus the gaps between climate science claims and reality.
The “Model of the original Data” description points out that the temperature data sets are not data, they are an abstraction or a best guess model of the data. I am ok with best guesses, since often that’s all we have for a starting point in exploring new areas of knowledge. In this case however best guesses are based on the presumption that the past has to be cooler because CO2 has increased. That is the cart leading the horse or the old, “my conclusion is supported by my conclusion”.
Bottom line, in terms of past temperature data, we do not have reliable data. It simply does not exist, we don’t even have a consistent theoretical definition of what a days temperature is. Regardless, fix the unreliable data, then create a new modeled data-set, and feed it into more models so we can pretend we have solved the mystery of climate.
In a court anyone presenting this kind of evidence, would be skewered under cross-examination. Under cross-examination any credibility of the data being representative of global temperature would plummet. But this is science and not a court of law, and science often requires experimentation, exploration, speculation to get to the next experiment or hypothesis and so on. The sin of climate science is they are misrepresenting where they are in the process of understanding global temperature as well as the mechanics of climate. Is is the simple age-old character flaw of dishonesty.
@Alx,
I think there is usable it the historical temp record, they just shouldn’t be adjusting the data.
which if you pay attention to the data, what it has to say is something completely different from what they show it to be.
I think there is enough evidence above to indicate that “outliers” should not be adjusted by stations miles away just because an “adjuster” thinks the station is showing “the wrong results” (from his perspective). This is particularly so if the stations used as basis are affected by UHI such as airport proximity thus warming the outlier. How many “outliers” are in rural locations and affected by adjustments upwards? How many of the “E” stations i.e. no longer extant are getting readings from UHI affected stations even although they may be assumed to be located in rural locations. As I understand the issues, the main problem is not only TOBS, but really the “double adjustments” such as to Iceland temperatures, but also the adjustments to non exisiting stations and the lack of realistic UHI adjustments to stations at encroaching constructions retaining heat evening/night and affecting min. readings. I simply think that for as long the surface stations show a divergence from satellite measurements there is a problem to be investigated by independent statisticians such as is now happening in Australia. This is a statistical issue of enormous proportions. Maybe a suggestion made that error bands should be increased rather than numerous adjustments made is a good one. Makes it more difficult to “cry wolf” but perhaps more ealistic. Don’t like the idea that all the adjustments increase current and decrease past temperatures. When I look at the current US temperatures from the thirties I don’t recognize what I read about the dustbowl in Steinbeck’s novels when I was young.
At least the acronym is right . . . To BS.
Hi John Goetz
Excellent analysis! I posted the note below in the comments at
http://judithcurry.com/2015/02/22/understanding-time-of-observation-bias/
“Are you going to respond on this WUWT post. If you do, I suggest posting at both there and on Judy’s weblog. ”
Roger Sr.
P.S. Nolan Doesken at the Colorado Climate Center did a comparison of two sites in Fort Collins when they were building a transit center there that was very near the site of the long term Fort Collins climate station. It is not as ideal as the location you have looked at but it would be another near station comparison that could be informative. I will ask if he still has that report.
Hi Roger,
I left a detailed reply over at Climate Etc.
Here is Nolan’s paper; it is quite excellent: http://ams.confex.com/ams/pdfpapers/91613.pdf
I discuss it in my post on MMTS transition bias here: http://rankexploits.com/musings/2010/a-cooling-bias-due-to-mmts/
Thanks Dr. P.
Mr. Zeke has responded been very helpful and informative in his responses. I have been reminded of the value of using anomalies in some of the analysis, although I don’t quite agree with some of the conclusions drawn. But that is science. We will continue to debate, analyze, and debate some more.
About 5 years ago I visited a marine lab where their thermometer(s) measured temperature continuously and recorded in real time electronically. As a result the 24 hour Tmax, Tmin and Tmean required no daily readings, no adjustment and no TOBS. Incidentally Tmean did not necessarily equal (Tmax + Tmin)/2.
I understood that the only part of the apparatus which required updating on a regular bi-monthly basis was the paper for printouts, if and when these were needed in paper form. I wondered why these devices were not used throughout and Steven Mosher explained that this was so that current records could be better compared with previous ones where such modern devices had not been available. Which made sense then. But is there any reason, today, why we should not have had at least 5 years of unadjusted daily records?
Nick Stokes has explained on his website the need for TOBs and I found his argument persuasive but, now that we are in an electronic age and there is no need to physically inspect the thermometers, I have never really understood why the climate world could not ensure that all readings are taken as at, say 12.00 p.m. GMT worldwide (i.e. measuring the same 24 hour period worldwide).
I am sure that there must be a good reason and perhaps someone will enlighten this layman.
Average is not (max+min)/2. Average is sum(observations)/(number of observations). So no need for any TOBs adjustments.
If you want a daily average, use all data points for one day.
If you want a monthly average, use all data points for one month.
If you want a yearly average, use all data points for one year.
Why is this difficult?
It’s hard to avoid (temp1+temp2)/2 when all you have is 2 temps.
If you consult original temperature records in meteorolgical year books you will see that TOBS change is a rare event. Those i believe that TOBS changes are justified here and there and everywhere have no idea how rare actual TOBS changes are.
Further, When some “correct” for TOBS in recent years, then they are at the same time claiming that the versions made public just a few years earlier should have been published while forgetting TOBS …!
Kind Regards, Frank Lansner